
International Journal of Analytical and Bioanalytical Methods
(ISSN: 2633-8912)
Volume 2, Issue 1
Research Article
DOI: 10.35840/2633-8912/2411

Article Formats
A Survey on the Monosodium Glutamate Occurrence in Food Products and it's Analysis by Thin Layer Chromatography and Liquid Chromatography-Mass Spectrometry from Sultanate of Oman
Table of Content
Figures
Tables
Table 1: Various samples analyzed after taking snap shots of the packed labels containing MSG and without MSG.
Table 2: MSG optimized ESI MS parameters.
Table 3: This table shows the statistics analysis between the products and the data collected across various grocery stores. Here parameters like mean, median, mode, standard deviation, variance, range, minimum value, maximum value and sum.
Table 4: This table shows the analysis of data by (ANOVA) methods in which it groups the data of the products in three parts.
Table 5: This table shows the group statistics of MSG written products and not written products. Here N- number of products.
Table 6: This table shows the independent samples test. The Independent Samples t Test compares the means of two independent groups in order to determine whether there is statistical evidence that the associated population means are significantly different. The Independent Samples t Test is a parametric test. In statistics, (Levene's test) is an inferential statistic used to assess the equality of variances for a variable calculated for two or more groups. A (t-test) is any statistical hypothesis test in which the test statistic follows a Student's t-distribution under the null hypothesis.
Table 7: This table shows the analysis of the data in a given frequency, percent, valid percent and cumulative percent.
Table 8: This table shows the statistics of MSG labelled products and non-labelled products.
Table 9: This table shows the samples that are used for TLC analysis.
Table 10: Rf value for the Dry-MSG-Yes products.
Table 11: Rf value for the Wet-MSG-Yes products.
Table 12: Rf value for the Dry-MSG-No products.
Table 13: Rf value for the Wet-MSG-No products.
Table 14: Highest Rf value samples.
Table 15: Lowest Rf value samples.
Table 16: The tests of normality (for all the Rf values) since the data is more than 30 (large sample) using Kolmogorov-smimov test the sig. value is 0.000 it is less than the probe value = 0.05. So it is non-parametric data.
Table 17: This table shows the s significance value for Mann-Whitney U is 0.164 which is more than = 0.05. So the null hypothesis is accepted.
Table 18: The table shows the maximum and minimum Rf value of the products.
Table 19: The table shows the high Rf value products.
Table 20: Concentration of the MSG in the samples by LC/MS.
References
- Sampson HA, Metcalfe DD (1993) Food allergies. J Amer Med Assoc 268: 2840-2844.
- Bawaskar HS, Bawaskar PH, Bawaskar PH (2017) Chinese restaurant syndrome. Indian J Crit Care Med 21: 49-50.
- Fernstrom JD (2000) Second international conference on glutamate: Conference summary. J Nutr 130: 1077S-1079S.
- (1995) Analysis of adverse reactions to monosodium glutamate (MSG). Life Sciences Research Office, FASEB, USA.
- Yamaguchi S, Ninomiya K (2000) Umami and food palatability. J Nutr 130: 921S-926S.
- Krishna VN, Karthika D, Surya DM, Rubini M, Vishalini M, et al. (2010) Analysis of monosodium l-glutamate in food products by high-performance thin layer chromatography. J Young Pharm 2: 297-300.
- Mustafa S, Saleem Y, Hameed S (2015) Determination of monosodium glutamate content in selected traditional meat dishes. International Journal of Scientific & Engineering Research 6: 569-572.
- Rodríguez MS, González ME, Centurión ME (2003) Determination of monosodium glutamate in meat products. Anales de la Asociación Química Argentina 91: 41-45.
- Afraa A, Mounir A, Zaid A (2013) Colorimetric determination of monosodium glutamate in food samples using L- Glutamate oxidase. Chin J Appl Environ Biol 19: 1069-1072.
- Smith T, Haider C (2014) Novel method for determination of sodium in foods by thermometric endpoint titrimetry (TET). Journal of Agricultural Chemistry & Environment 03: 20-25.
- Walker R, Lupien JR (2000) The safety evaluation of monosodium glutamate. J Nutr 130: 1049S-1052S.
Author Details
Mohammed Mubarik Sulaiman Khalaf Ambusaidi1, Sathish Babu Soundra Pandian2, Senthilraj Swaminathan3 and Magapu Solomon Sudhakar4*
1Laboratory Technicians, Hassan bin Thabit Secondary School, Qatar
2Centre for Analytical & Applied Unit (CAARU), College of Science, Sultan Qaboos University, Oman
3Assistant Professor in Mathematics, General Requirement Department, Sur College of Applied Sciences, Ministry of Higher Education, Sultanate of Oman
4Department of Applied Biotechnology, Sur College of Applied Sciences, Ministry of Higher Education, Sultanate of Oman
Corresponding author
Dr. Magapu Solomon Sudhakar, Department of Applied Biotechnology, Sur College of Applied Sciences, Ministry of Higher Education, P.O.Box 484, P.C -411, Sur, Sultanate of Oman.
Accepted: August 01, 2020 | Published Online: August 03, 2020
Citation: Ambusaidi MMSK, Pandian SBS, Swaminathan S, Sudhakar MS (2020) A Survey on the Monosodium Glutamate Occurrence in Food Products and it's Analysis by Thin Layer Chromatography and Liquid Chromatography-Mass Spectrometry from Sultanate of Oman. Int J Analyt Bioanalyt Methods 2:011.
Copyright: © 2020 Ambusaidi MMSK, et al. This is an open-access article distributed under the terms of the Creative Commons Attribution License, which permits unrestricted use, distribution, and reproduction in any medium, provided the original author and source are credited.
Abstract
Monosodium Glutamate or (MSG) is used in food to enhance flavor, originally used for meat and savory dishes, however these days it's used in a wide array of foods or 'food like' products. Objective of the study is to determine whether MSG is included in dry and wet products that sold in the market and long-term study, how it affects the people once the MSG was detected in the samples and consumed by them. In this current study only detection of MSG was carried out and reported. The samples and the MSG standards are purchased from several grocery markets in Oman and taken picture of the different dry products and wet products. Samples were analysed using Statistics, Thin Layer Chromatography (TLC) and Liquid Chromatography- Mass Spectrometry (LCMS). ANOVA statistical analysis was employed for this study. Statistical analysis was performed by SPSS software (Version16). The samples were weighed (equivalent to 1.0 gram) and diluted to 100 ml with HPLC water. TLC for all the samples were done using the mobile phase Methanol:Chloroform:Formic acid (5:5:1). 10 Microlitre used for spotting the samples and standard in the TLC plate. Samples showing high Rf value in TLC were confirmed by LC/MS. Most of the products showed the presence of MSG in the TLC. This study highlighted the importance of adequate baseline and control data and indicated that such a rigorous protocol for individual assessment is feasible.
Keywords
Mono-Sodium Glutamate (MSG), Thin Layer Chromatography (TLC), Chinese Restaurant Syndrome (CRS), Class Internal (CI), Liter (L), Liquid Chromatography-Mass Spectrometry (LCMS)
Introduction
In 1908, in Japan, Kikunae Ikeda invented the food ingredient, "mono-sodium glutamate" who identified the natural flavor, enhancing substance of seaweed, however, today's MSG is completely man made and there is nothing natural about it. About one year later, with a partner, he formed a company, Ajinomoto, to produce the product. Mono-sodium glutamate did not appear in the United States to any degree until the late 1940s, following the Second World War. During the war, it had been noted that Japanese soldiers' rations tasted better than the rations used by our soldiers. The difference was believed to be "mono-sodium glutamate." Today, "mono-sodium glutamate" or its reactive component, "processed free glutamate acid," is found in almost all the processed foods that are manufactured in the United States [1].
In 1957, Lucas and Newhouse found that normal neonatal mice suffered acute deteriorating lesions in the inner retina when "monosodium glutamate" was administered by feeding tube. In 1968, during a replication of this study at Washington University Medical School, St., Louis, Missouri, Dr. John W. Olney noted that, some of the mice had become strangely obese. John determined to sacrifice some of the mice to confirm his belief that lesions would be found in the hypothalamus region of the brain [1].
In 1968, the New England Journal of Medicine, asked for help in determining why he and his friends suffered reactions shortly after eating in some Chinese restaurants, though he never experienced such reactions when he lived in China. The journal titled the letter "Chinese Restaurant Syndrome," and researchers from around the country wrote the journal to suggest that Dr. Kwok and his friends' problem was intolerance to MSG. One letter indicated that 30% of the population reacted to MSG [2].
In 1969, apparently concerned with the bad reports regarding "monosodium glutamate," the glutamate industry formed a nonprofit organization to defend the safety of MSG, the International Glutamate Technical Committee. Later, in 1977, they increased their efforts with the development of a nonprofit subsidiary, The Glutamate Association, primarily operating as a public relations arm of the glutamate industry.
In about 1990, the glutamate industry turned to the International Food Information Council (IFIC), another nonprofit industry-funded organization, to be their spokesman and to promote the safety of MSG along with the other products that they represent [1].
The literature is clear in demonstrating that MSG is toxic to humans and that over 25% of the population suffer adverse reactions from MSG. "Monosodium glutamate" is approximately 78% processed free glutamic acid and 22% sodium (salt) and moisture, with about 1% contaminants. It is the processed free glutamic acid that causes people to suffer adverse reactions, and, unfortunately, there are over 40 food ingredients other than "monosodium glutamate" that contain processed free glutamic acid in varying amounts. Consequently, consumers refer to all processed free glutamic acid as MSG, regardless of the name of the ingredient [1].
MSG and Public Health
In 1958 the U.S. Food and Drug Administration (FDA) designated MSG as a Generally Recognized as Safe (GRAS) ingredient, along with many other common food ingredients such as salt, vinegar and baking powder [3].
There is general, consensus in the scientific community, based on numerous biochemical, toxicological and medical studies conducted over four decades that MSG is safe for the general population, including pregnant and lactating women, and children [3].
In 1995, the safety of MSG for use by the American population was again reinforced in a review by the Federation of American Societies for Experimental Biology (FASEB). The review was conducted by FASEB upon request of the FDA as is periodically done for all GRAS ingredients [4].
MSG Consumption and Metabolism
This is comparable to U.S. estimates of roughly 0.55 grams for the average consumer, spread out through an entire day [5]. In Taiwan, for example, per capita consumption figures are much higher, averaging 3 grams per day [5]. Still, the human body metabolizes added glutamate in the same manner it metabolizes glutamate found naturally in many foods. Once glutamate is ingested, our bodies make no distinction between the origins of the glutamate. The body does not distinguish between glutamates from foods like tomatoes or MSG added to a tomato sauce. In fact, research now shows that glutamate from food or MSG is important for normal functioning of the digestive tract and digestion [5].
Experimental
Sampling collection method
Eight different provisional stores were visited to study the packed food samples among which three stores chosen are from local Sur and five stores are from Nizwa. The study was carried out by taking photo snaps of food labels containing MSG in the ingredients. Samples of all the packed food types like dry and wet were considered in this study. For maintaining the secrecy, the brand name or the product names were mentioned with the sample codes (Table 1).
The sample analysis was categorized into three.
1. Statistical analysis: From the information available in the label.
2. TLC Analysis and
3. LC/MS analysis.
Totally 32 products were analyzed statistically as per their information present in the label from a random pool of 200 samples. Samples were categorized into two, Dry and wet as per their physical appearance.
Dry and wet samples are further categorized into four "Dry-Yes" & "Wet-Yes "for the samples which is having MSG in the label and "Dry-No" & "Wet-No" for the samples having no information about MSG in the Label. Six samples from each four categories were analyzed by TLC. Four Samples were analyzed by LCMS for the final confirmation.
Statistical Analysis
ANOVA method was used to differentiate sampling labels containing MSG in both the dry and wet products.
Sample analysis by labels
ANOVA analysis was used for this study. Statistical analysis was performed by SPSS software (Version16). ANOVA method was used to differentiate sampling labels containing MSG in both the dry and wet products.
TLC Analysis of MSG
Standard preparation
Standard solution was prepared by dissolving 100 mg of Mono-sodium Glutamate in HPLC water to get a final concentration of 1 mg/ml.
Sample preparation
Sample weight equivalent to 1.0 gram for both dry and wet products was weighted in a 100 ml volumetric flask and the volume made up to 100 ml with HPLC water. Samples were mixed thoroughly to get a homogenous mixture and filtered through a wattman filter paper no. 42. Filtrate from each sample was spotted in a TLC plate.
TLC conditions
TLC was performed [6] in a commercially available silica gel pre-coated plate. Mixture of Methanol:Chlorofrom:Formic acid (5:5:1) was used as a mobile phase to develop the plates. A line was drawn 1.0 cm above the bottom of the plate with a pencil for spotting. 10 µl sample and standard were spotted at an equal distance in the straight line.
The TLC developing chamber is saturated with the mobile phase for 20 minutes before placing the spotted TLC plate. Once the Spotted plate placed in the TLC Chamber the mobile phase will starts moving upwards due to capillary forces.
When the mobile phase start moving the components of sample separate because of the interactions between the molecules of mobile phase and the coated stationary phase. After development, the plates were sprayed with 1% ninhydrin in acetone solution and dried at 60 ℃ for 5 min to visualize the compounds. Rf Value was calculated for standard and samples. In TLC analysis the Rf values were analyzed using Mann-Whitney U test: Chromatography: The mobile phase resolved MSG very efficiently and the mixtures reanalyzed according to the above method. The data was analyzed by Mann-Whitney U, which was carried out for the Rf value calculated.
LCMS conditions
Liquid Chromatography Mass Spectrometry analysis was performed on an Agilent Technologies Triple Quad LC/MS system, equipped with 6460 Triple Quad MS Detector, a High Performance Autosampler (G4226A), Quaternary Pump (G4204A), and Thermostatted Column Compartment (G1316C).
The separation was achieved with Waters: Symmetry® C18column (3.5 µm, 2.1 × 100 mm, part No. WAT058965). The mobile phases consisted of A (0.1% Formic Acid in water HPLC Grade) and B (Acetonitrile HPLC Grade). The isocratic condition 30:70 (A:B) for five minutes. Mobile phase flow rate was 0.5 ml per min and Injection volume 5 microlitres.
Ionization of MSG was optimized using Electrospray Ionization (ESI) with Positive polarity and the selectivity was achieved by multiple reaction monitoring (MRM) mode, m/z 148.08 → 131 and m/z 148.08 → 85.2 respectively, with gas temperature 300 ℃; Gas flow 5 L/Min; Nebulizer gas 50 PSI; Sheath Gas Heater 375 ℃; Sheath gas flow 12 L/Min; Capillary Voltage 4000/4500 V; charging 500/1500. Positive identification criterion of MSG was based on retention time in comparation to the standard sample. Also depending on the ratio of abundance of two specific precursor ion/product ion transitions (Table 2).
Results and Discussion
Statistical analysis
The Analysis of Variance (ANOVA) was used for this study, and the following parameters are considered for the statistical analysis.
1. Packed food samples having labels of MGS and without MSG parameters were taken into consideration.
2. The percentage of samples containing MSG in both dry and wet packed food products were also considered in the study.
Statistical analysis (ANOVA) was performed by SPSS software (Version16). ANOVA method was used to differentiate sampling labels containing MSG in both the dry and wet products. Eight provisional stores were visited, 200 different packed food samples were analyzed for MSG content through label by photo snap of the ingredients from 60 different commercial food companies, statistical analysis was carried out for the identified MSG labels in which food products having labeled MSG are abbreviated as "YES" which are of 34.8% and similarly food products which are not labeled with MSG are abbreviated as "NO" which are 65.2%. After statistical analysis the packed food sample labels were classified as wet and dry products containing MSG wherein the wet products were containing high numbers of MSG through labeling which is within the pool of 34.8% (Table 3, Table 4, Table 5, Table 6, Table 7 and Table 8). These percentages were taken into consideration based upon the significance values.
TLC analysis
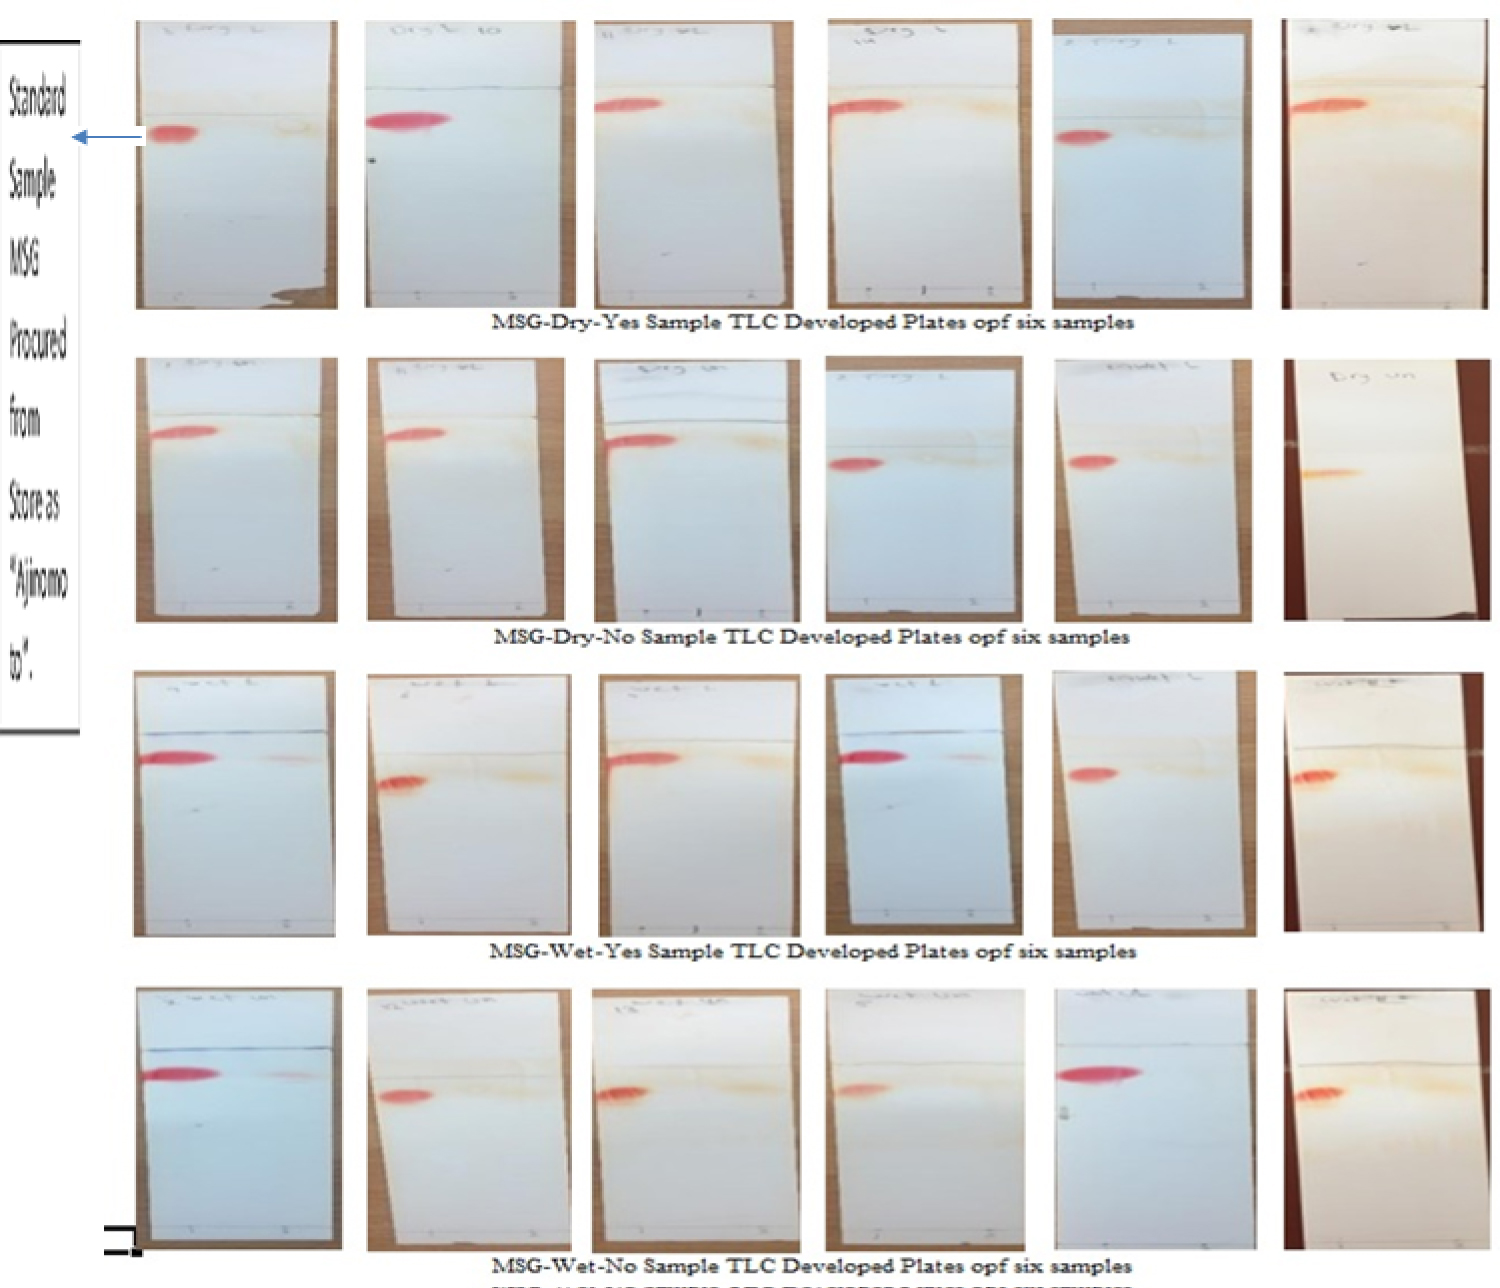
Six samples from each category, MSG-Yes-Dry, MSG-No-Dry, MSG-Yes-Wet and MSG-No-Wet, total of 24 samples were selected for TLC analysis (Figure 1 and Table 9).
Rf Value for the twenty-four samples were calculated from the TLC plate after development are tabulated below (Table 10, Table 11, Table 12 and Table 13). Results from the TLC analysis with the sample having high Rf value and Low Rf value were tabulated below (Table 14 and Table 15). The average Rf standard value of Standard MSG was 0.81.
Statistical analysis for the Rf value derived from the TLC analysis done by "Test for normality" were tabulated below (Table 16) and it was concluded as a Non-Parametric data.
The Mann-Whitney U test is a non-parametric test of the null hypothesis that it is equally likely that a randomly selected value from one population will be less than or greater than a randomly selected value from a second population. The Mann-Whitney U test for the Rf value is tabulated below (Table 17) and it shows that s significance value for Mann-Whitney U is 0.164 which is more than α = 0.05. So the null hypothesis is accepted.
Descriptive statistics are brief descriptive coefficients that summarize a given data set, which can be either a representation of the entire or a sample of a population. Descriptive statistics for the Rf value are tabulated below (Table 18).
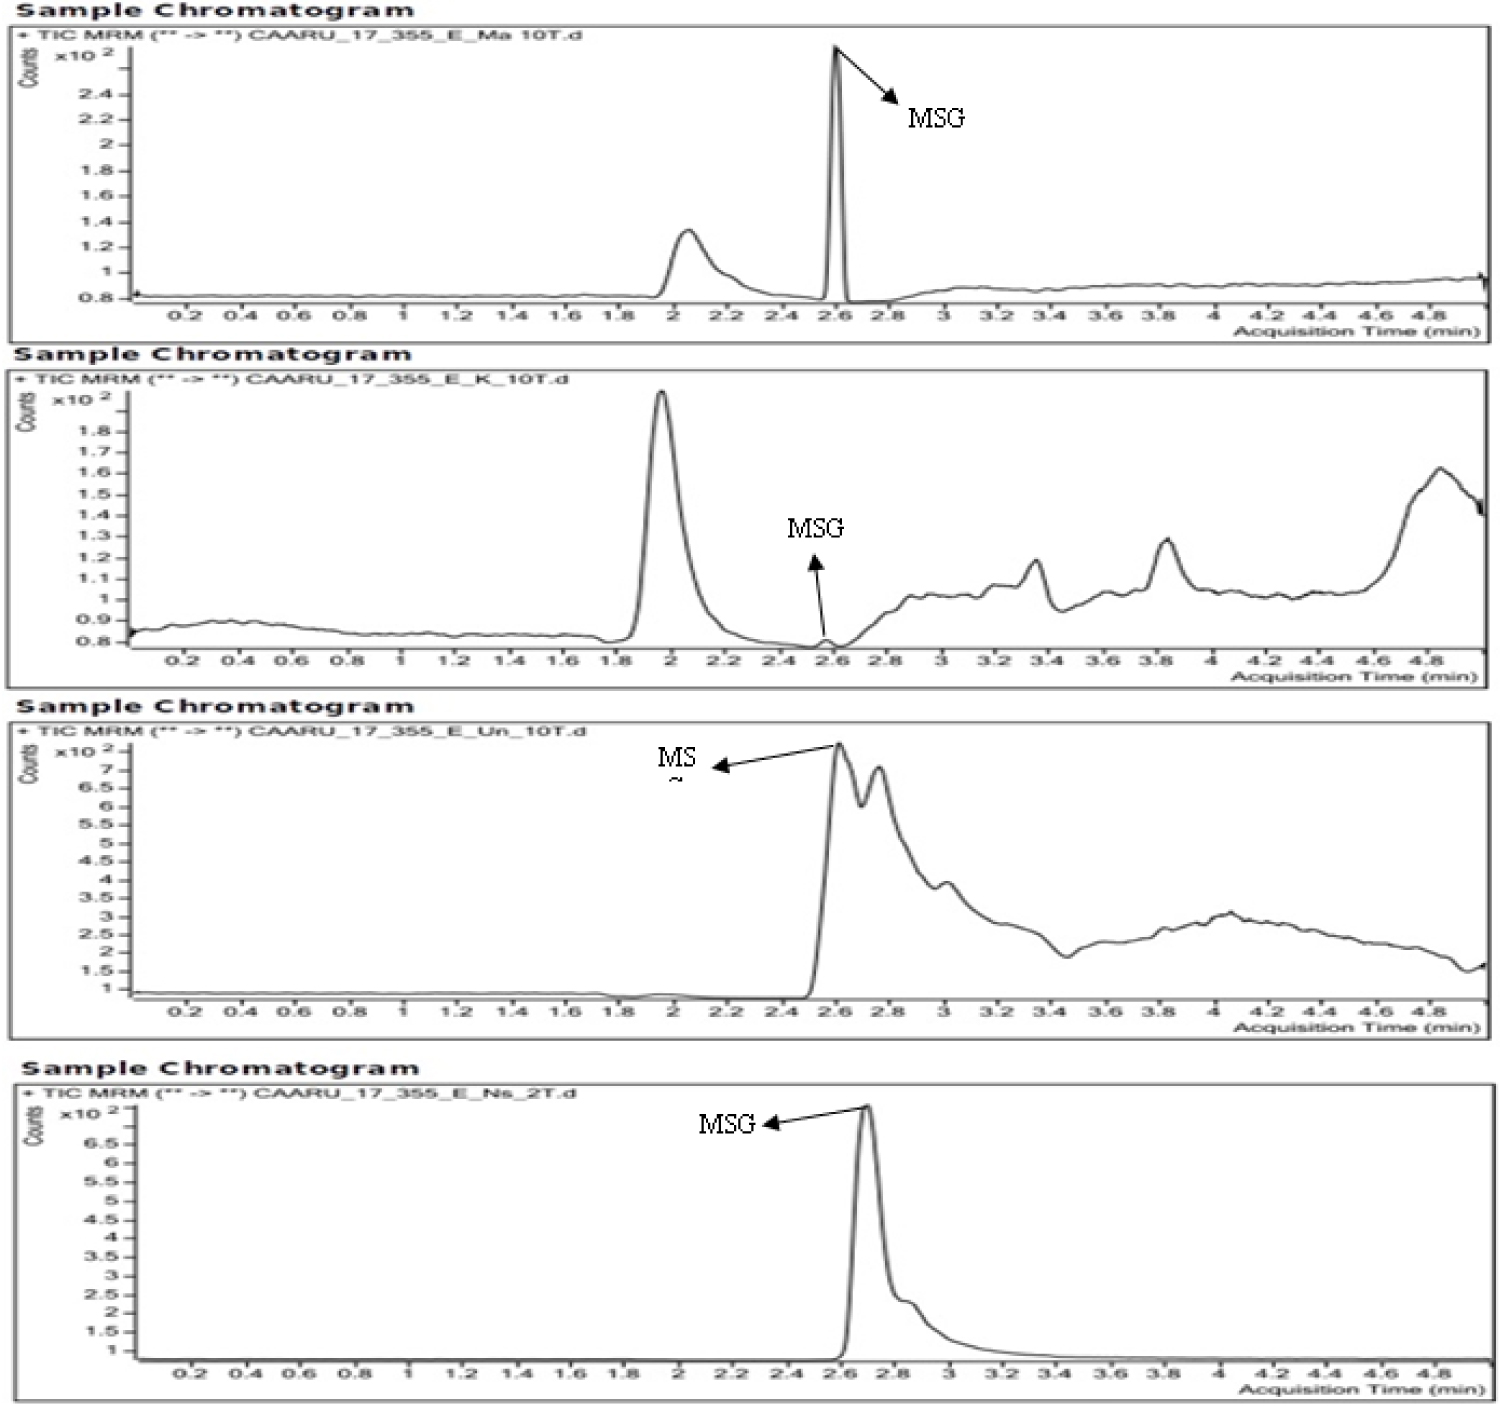
LC/MS analysis
Four samples were selected from the TLC analysis which was having high Rf values. One from each category of the products, Dry-Yes, Dry-No, Wet-Yes and Wet-No. Results in ppm of MSG in the samples were given in the (Table 19, Table 20 and Figure 2). MSG was confirmed by the ratio of abundance of two specific precursor ion/product ion transitions with respect to the standard ratio.
Conclusion
In this study, the label analysis of 200 food products indicated that 34.8% were labelled with MSG and 65.2% were not labelled in Sultanate of Oman as this survey was carried out at various hypermarkets of Sur and Nizwa. At the same time both qualitative and quantitative analysis carried out by TLC and LC/MS respectively reaffirmed that MSG is a matter of concern in Oman and it needs to be regulated after further studies being carried out on the effect of MSG on populations' of both Omani as well as expatriates living in the Sultanate. In fact, the current study did employ a unique technique which was not cited elsewhere. Although methods like HPLC [7,8], TLC [6], Colorimetric [9] and Thermometric endpoint titrimetric (TET) [10] analysis were reported but LC/MS was not cited in the search for literature.
In fact the future studies on this compound will through much insight of its effect and remedy. Although, In this current study it was observed that MSG concentration was more than the stipulated concentration as suggested by FAO, 1971 and WHO, 1974 as at that time, the Acceptable Daily Intake (ADI) was 120 mg/kg (120 ppm) body weight which was encompassing the L-glutamic acid equivalents of the salts and this considered additional to the intake from all non-additive dietary sources [11]. But to confirm this excess concentration of MSG, many samples must be analysed by repetition in the LC-MS analysis as in the current study the sample is restricted to only four, this studies needed further extension with regard to sample size so that the present findings become more robust.
Acknowledgement
The corresponding author wishes to thank the Deanship of Sur College of Applied Science, Ministry of Higher Education, Sur, Sultanate of Oman for extending all the support to the graduate student Mr. Mohammed Mubarik Sulaiman Khalaf Ambusaidi, to carry out this dissertation work. The author wishes to thank Dr. Premkumar Samuel, Application Specialist (NMR & MALDI), Central Analytical & Applied Unit, College of Science, Sultan Qaboos University, Muscat, Oman, for critical reviewing of this paper.