Changes in Rainfall, River Level and Discharge: Implications on Flooding in Makurdi, Benue State

International Journal of Earth Science and Geophysics
(ISSN: 2631-5033)
Volume 10, Issue 1
Research Article
DOI: 10.35840/2631-5033/1876

Article Formats
Changes in Rainfall, River Level and Discharge: Implications on Flooding in Makurdi, Benue State
Figures
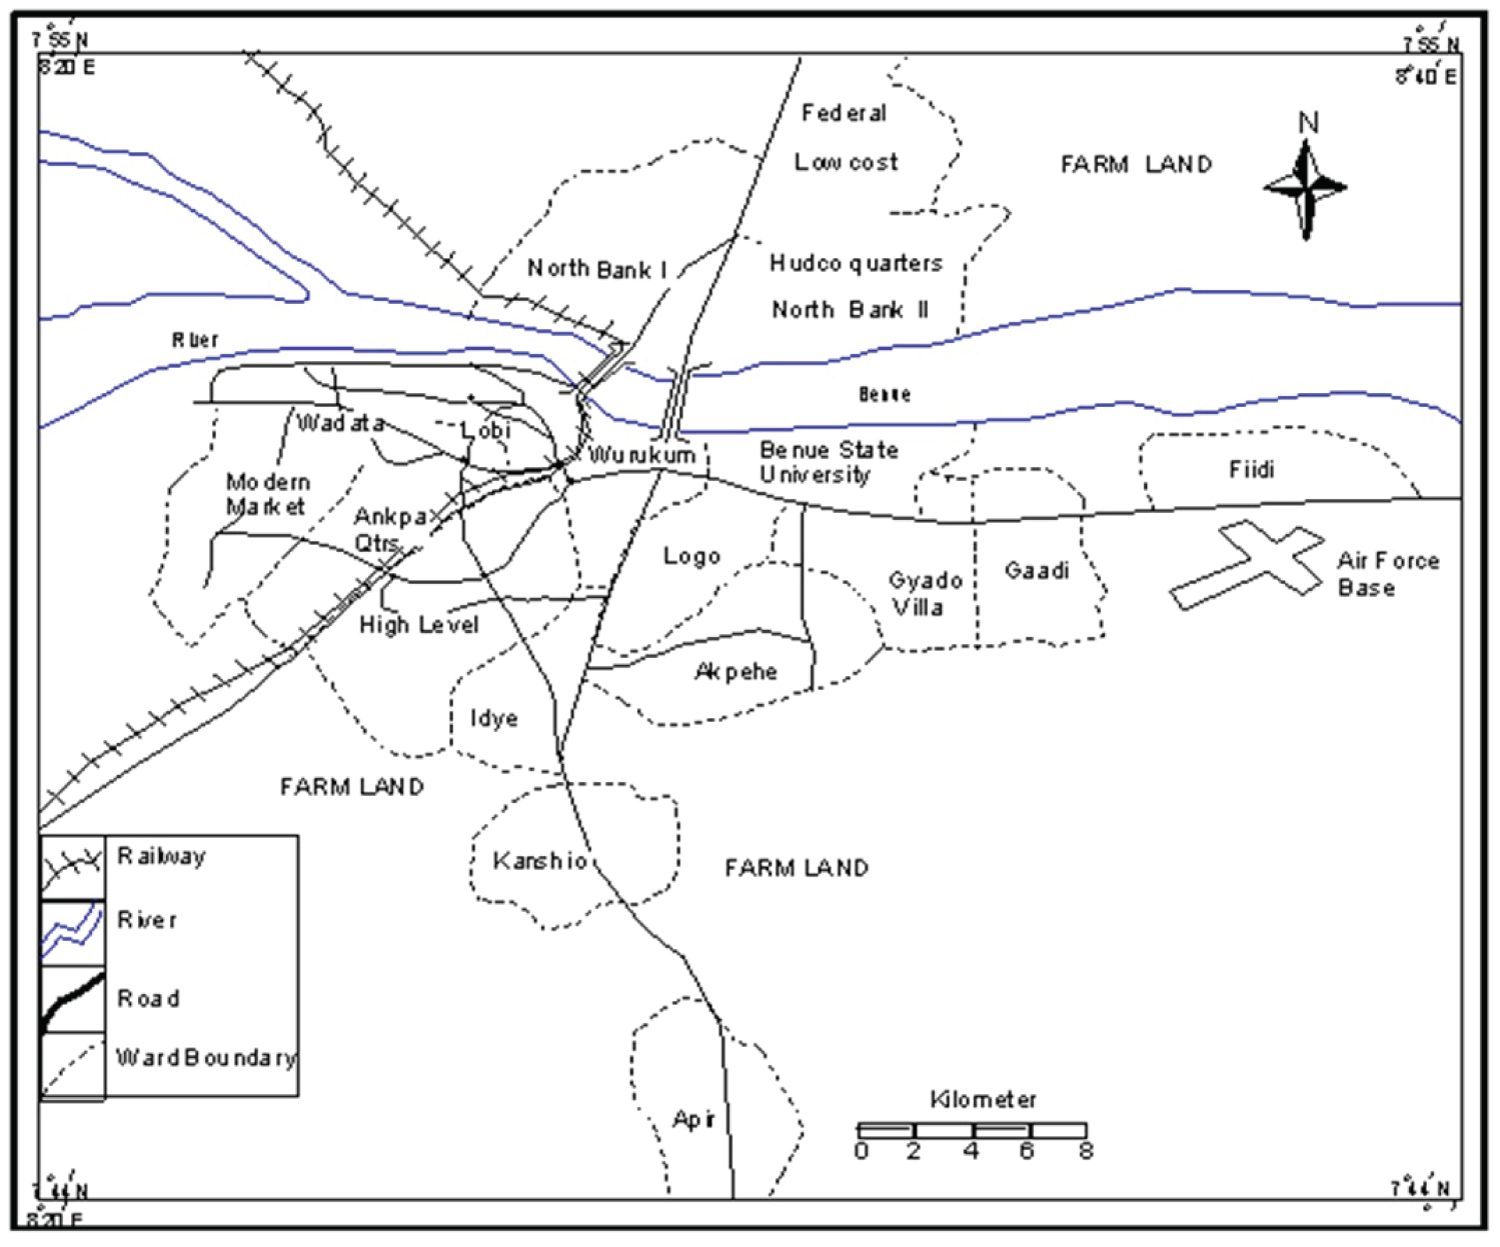
Figure 1: Makurdi Metropolis, the...
Makurdi Metropolis, the Study Area.
From: Shabu and Tyonum [13].

Tables
Table 1: Results of One-Way ANOVA on Monthly Variation of Variables in Makurdi.
Table 2: Results of One-Way ANOVA on Yearly Variation of Variables in Makurdi.
Table 3: Results of One-Way ANOVA on Decadal Variation of Variables in Makurdi.
Table 4: Pearson Correlation of Rainfall, Water Level and River Discharge in Makurdi.
References
- Agada S, Nirupama N (2015) A serious flooding event in Nigeria in 2012 with specific focus on Benue State. A brief review. Nat Hazards 77: 1405-1414.
- Ologunorisa TE, Eludoyin AO, Lateef B (2022) An evaluation of flood fatalities in Nigeria. Journal of Weather, Climate and Society 14: 709-720.
- Adekola AO, Lamond J (2018) A media framing analysis of urban flooding in Nigeria: Current narratives and implications for policy. Reg Environ Change 18: 1145-1159.
- Adeaga O, Oyeneye OT, Akinbaloye O (2020) Urban flood vulnerability mapping of part of the Lagos metropolis. Proc Int Assoc Hydrol Sci 383: 249-254.
- https://thenationonlineng.net/flood-is-king-in-etsakomakurdi-lokoja-others/
- https://punchng.com/floods-destroy-200-households-in-makurdi/
- IPCC (2023) Climate Change 2023: Synthesis Report. Contribution of Working Groups I, II, III to the Sixth Assessment Report (AR6) of the Intergovernmental Panel on Climate Change.
- Ifatimehin OO, Eneche PSU, Ismail NA (2020) Flood vulnerability assessment of settlements in the Niger-Benue Trough, Central Nigeria. International Journal of Environment and Climate Change 10: 50-67.
- Akumaga U, Tarhule A (2018) Projected changes in intra-season rainfall characteristics in the Niger River Basin, West Africa. Atmosphere 9: 497.
- Gbobaniyi E, Sarr A, Sylla MB, Diallo I, Lennard C, et al. (2015) Climatology, annual cycle and interannual variability of precipitation and temperature in CORDEX simulations over West Africa. International Journal of Climatology 34: 2241-2257.
- Tarhule A, Zume JT, Grijsen J, Talbi-Jordan A, Guero A, et al. (2015) Exploring temporal hydroclimatic variability in the Niger Basin (1901-2006) using observed and gridded data. Int J Climatol 35: 520-539.
- NPC (2006) National population census report.
- Shabu T, Tyonum TE (2013) Residents coping measures in flood prone areas of Makurdi town, Benue state. Applied Ecology and Environmental Sciences 1: 120-125.
Author Details
Adewale F.Olatunde1, Davidson Alaci2, Uvirkaa Akumaga3, Irene Mngutyo4, Laraba S. Rikko2, Taibat Lawanson5, Tom Edward4, and Terwase Shabu4
1Federal University Lokoja, Nigeria
2University of Jos, Nigeria
3Lincoln University, Jefferson City, USA
4Benue State University, Makurdi, Nigeria
5University of Lagos, Nigeria.
Corresponding author
Adewale F Olatunde, Federal University Lokoja, Nigeria, Tel: +2348164441708.
Accepted: October 18, 2024 | Published Online: October 20, 2024
Citation: Olatunde AF, Alaci D, Akumaga U, Mngutyo I, Rikko LS, et al. (2024) Changes in Rainfall, River Level and Discharge: Implications on Flooding in Makurdi, Benue State. Int J Earth Sci Geophys 10:076
Copyright: © 2024 Olatunde AF, et al. This This is an open-access article distributed under the terms of the Creative Commons Attribution License, which permits unrestricted use, distribution, and reproduction in any medium, provided the original author and source are credited.
Abstract
This study evaluated changes in rainfall amount, river water level and discharge and their implications on flooding in Makurdi, Benue state . The daily rainfall data were obtained from Nigerian Meteorological Agency (NiMet) from 1992 to 2021. The data for river level and discharge were from Nigeria Inland Waterways (NIWA) and covers from 1992 to 2021. In this paper, charts and graphs, the One Way ANOVA and the Multiple Pearson Product Moment Correlation were used for data analysis and presentation. Findings show August and September with highest amount of rainfall that would have contributed to the flooding of the study area. Also, the months of September, October and sometimes November tended to have high water levels usually between 8 and 10 metres that caused the River Benue to flood its plains and the adjacent areas. Results also indicated the months of August, September and October with river discharges of above 8,000 m 3 s. In addition, results show significant monthly variation in rainfall (P < 0.001) and water level ( P < 0.001). However, there was no significant monthly variation of river discharge ( P > 0.240). Also, there was no significant decadal variations in rainfall (P > 0.160) water level (P > 0.665), and river discharge (P > 0.101) in Makurdi. This study concluded that despite the importance of the above variables in the flooding of neighborhoods in Makurdi, other factors such as layout planning should also be evaluated to have a true picture of the flooding situation in Makurdi.
Keywords
Flooding, Climate change, Rainfall, River level, Decadal event
Introduction
Makurdi is the administrative capital of Benue state, Nigeria. Over the years, flooding has become a re-occurring and devastating disaster in the town [1,2]. On an annual basis several square kilometers of land area, settlements and farmlands are submerged during flood occurrence. The flood events of 2012, 2015, 2018 and 2022 affected the town in a very uncommon way with very high level of property and human loses [3,1,4,5]. In the 2012 episode, for example, several parts of the town along with adjoining villages and other towns in the states were heavily inundated [1,5]. The increase in flood frequency and magnitude in Makurdi brings to focus the need to evaluate factors affecting flood incidences in the city [1,6]. In general, there are rising incidences of natural disasters including flooding in countries across the globe [7]. Flooding has contributed to massive displacements of people and the destruction of settlements, properties and critical infrastructure [2,7,8]. Studies suggest that flood events have increased since the mid-1970s and it is believed that the amount and scale of flood events will continue to increase in the next 50 years due to rapid urbanization and overwhelming environmental change [7]. According to [7] report, at 1.5 °C global warming, heavy rainfall and flooding are projected to intensify and become frequent in most regions of Africa. The continued exposure of cities to natural disasters such as floods will impact negatively and threaten developmental gains in multiple ways and further degenerate the already precarious situation in Nigeria [2,8]. However, in spite of the current episodes of flooding in these communities, there have been little or no attempts by relevant institutions to prevent the occurrence or mitigate the effects of flooding [2]. Even where preventive measures exist, continuous incidences of flooding suggest that such measures are inadequate or ineffective. This is the situation in Makurdi where flood episode is basically a yearly event [1,2,6]. This is why, knowledge concerning expected change in rainfall characteristics and patterns, river water level and discharge is critically needed for flood adaptation and mitigation planning [2,9]. Owing to a variety of reasons, however, including data constraints, majority of studies on rainfall and flood to date have focused on changes in the mean annual rainfall and flood events and fatalities [1,2,9,10]. There are fewer studies that evaluated changes and trend in rainfall characteristics and river level and discharge, including, for example, the number, frequency, and intensity of rain events (extreme events) and floods [2,9-11]. Therefore, the objective of this study is to evaluate changes and trend in rainfall characteristics and patterns, river level and discharge as contributory factors to flooding in Makurdi.
Materials and Methods
Study area
The study area covers Makurdi town and greater Makurdi. Makurdi, the capital of Benue State is located between latitudes 7° and 44 °N and longitudes 8° and 35 °E (see Figure 1). The River Benue and some of its tributaries maintain a conspicuous present in the city. A large part of the town therefore is situated on its floodplains. The climate type of Makurdi is sub-humid or tropical wet and dry (Aw) according to Koppen’s climatic classification. This city lies in the Southern Guinea zone and annual rainfall reaches 1600 mm distributed across seven months (April to October), allowing a growing period of 150 to 210 days. The average temperature is about 27.9 ℃. The minimum temperature can be as low as 24 ℃ while the maximum temperature can be as high as 34 ℃. The city has a population of about 297, 392 [12].
Data and analysis
The rainfall data (1992 to 2021) were obtained from Nigerian Meteorological Agency (NiMet). The data for water level and discharge for the same period were from Nigeria Inland Waterways (NIWA). Data for few years of discharge (1992 to 1996) were not available. This is not expected to significantly affect the result of the analysis. The statistical tools used were the One-Way ANOVA and the Multiple Pearson Product Moment Correlation. Also, simple percentages, and charts were used to summarize the data. In addition, One-Way ANOVA was used to test the monthly, yearly, and decadal variations of rainfall, water level and river discharge in the study area. The amount of rainfall, water level and river discharge represent the criterion or the dependent variables while the years (1992-2021), decades, and months (January-December) represent the factors or independent variables. The one-way analysis of variance (ANOVA) is used to determine whether there are any statistically significant differences amongst the means of three or more independent (unrelated) groups. Furthermore, Pearson’s Correlation Analysis was used to determine the relationship among rainfall, water level and river discharge in the study area. The analyses were carried out using Statistical Packages for Social Sciences (SPSS) Version 21.
Results and Discussion
Rainfall in Makurdi
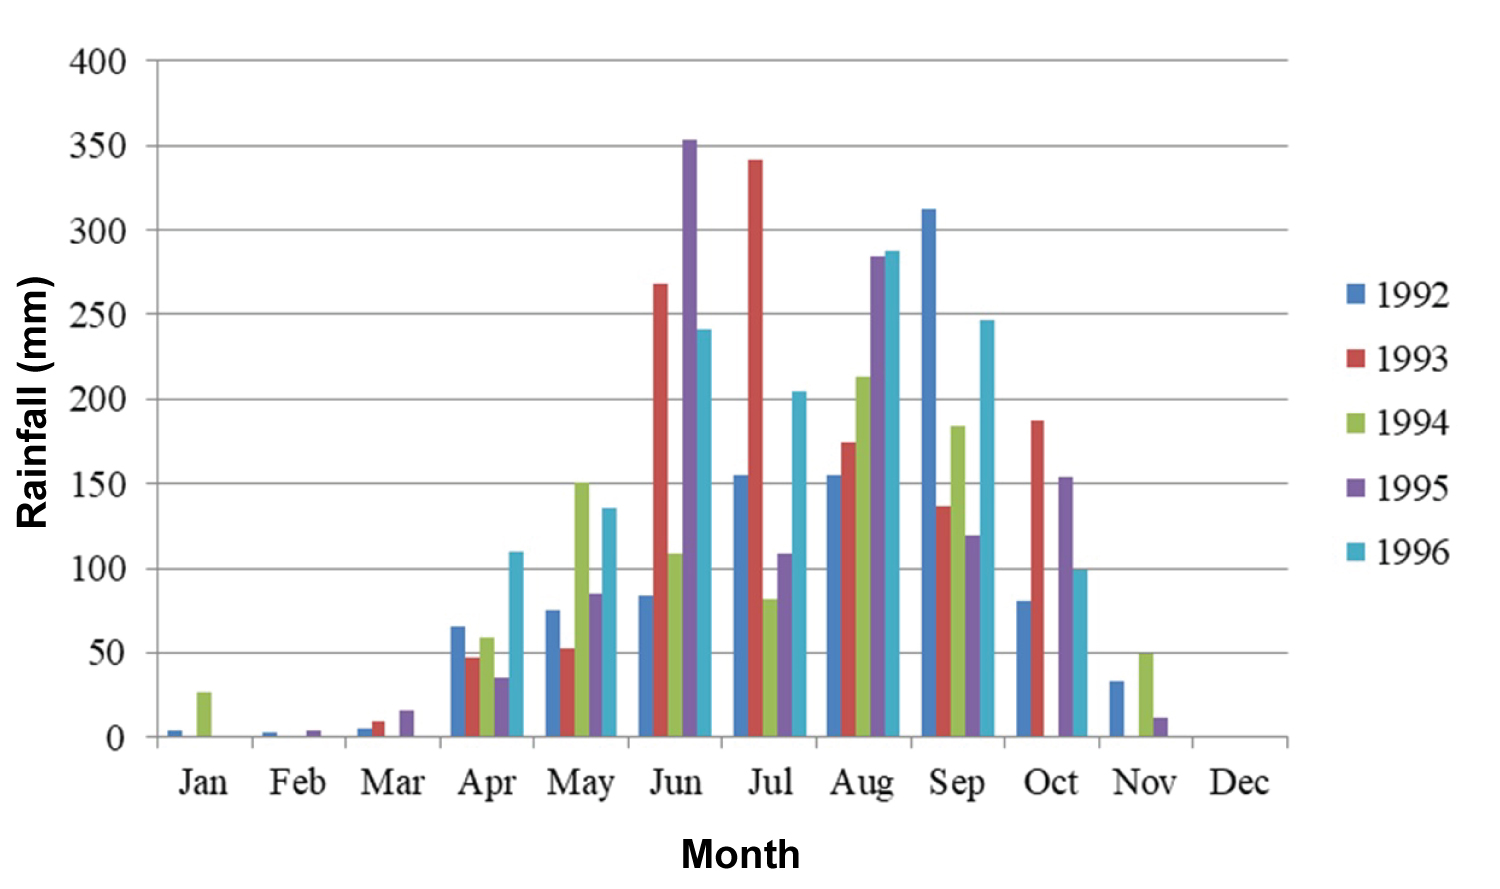
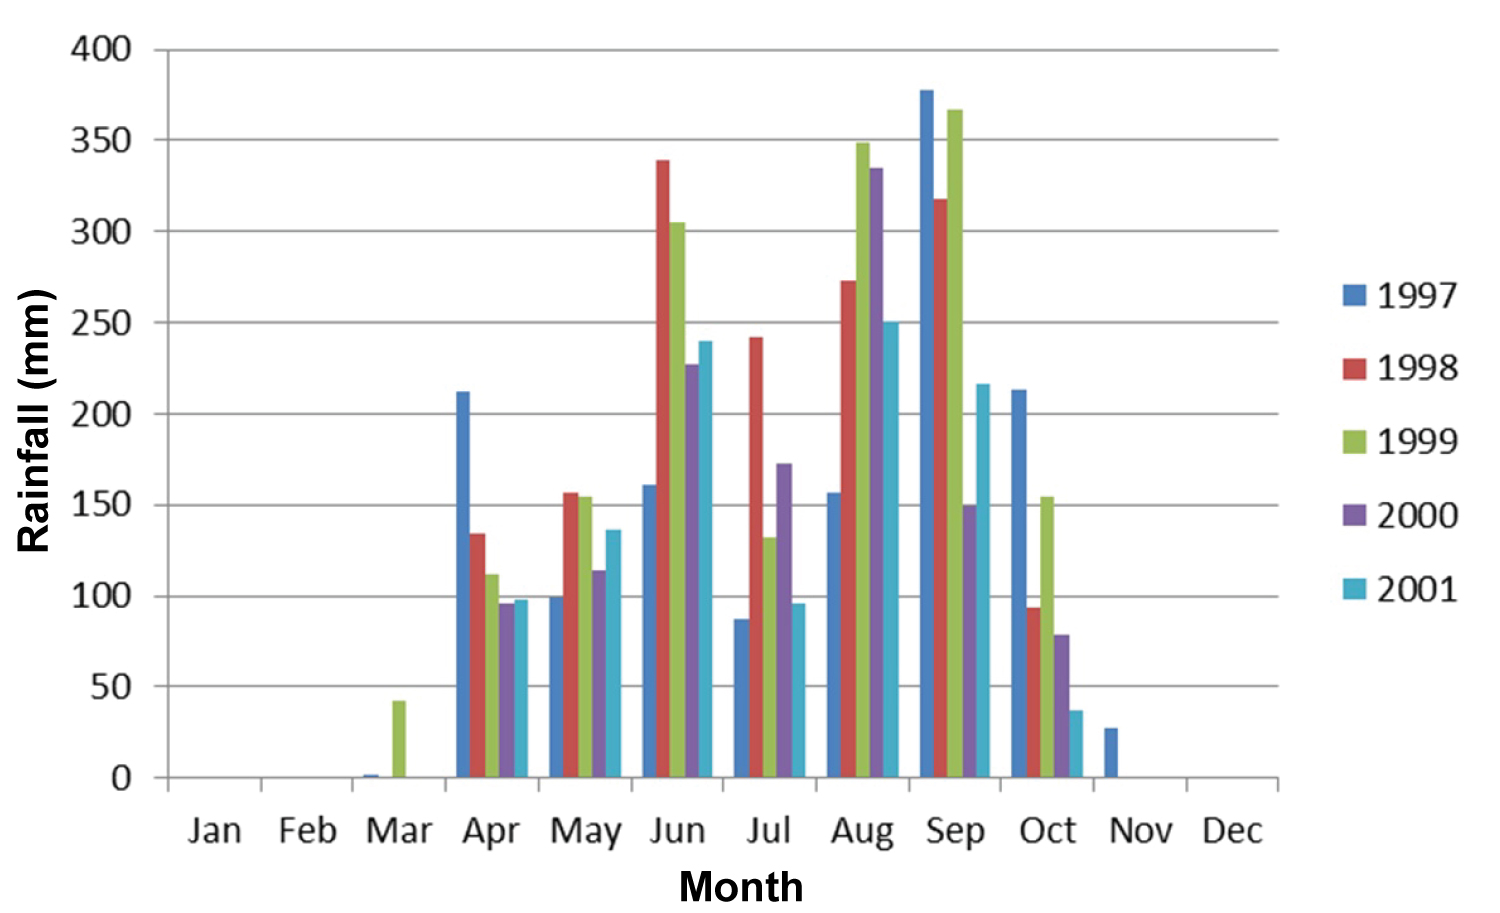
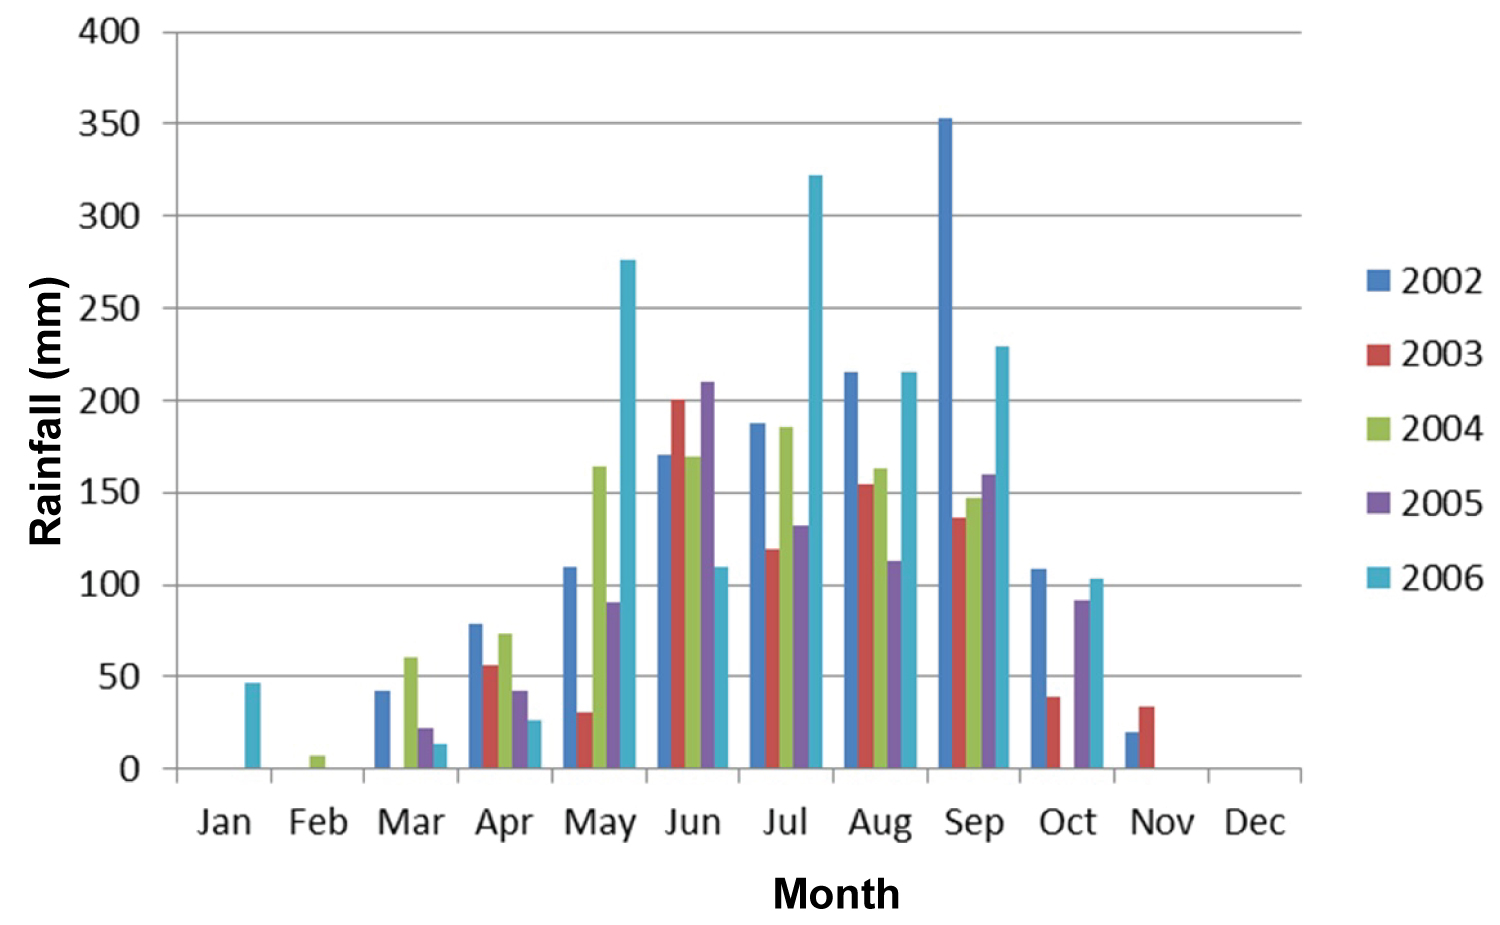
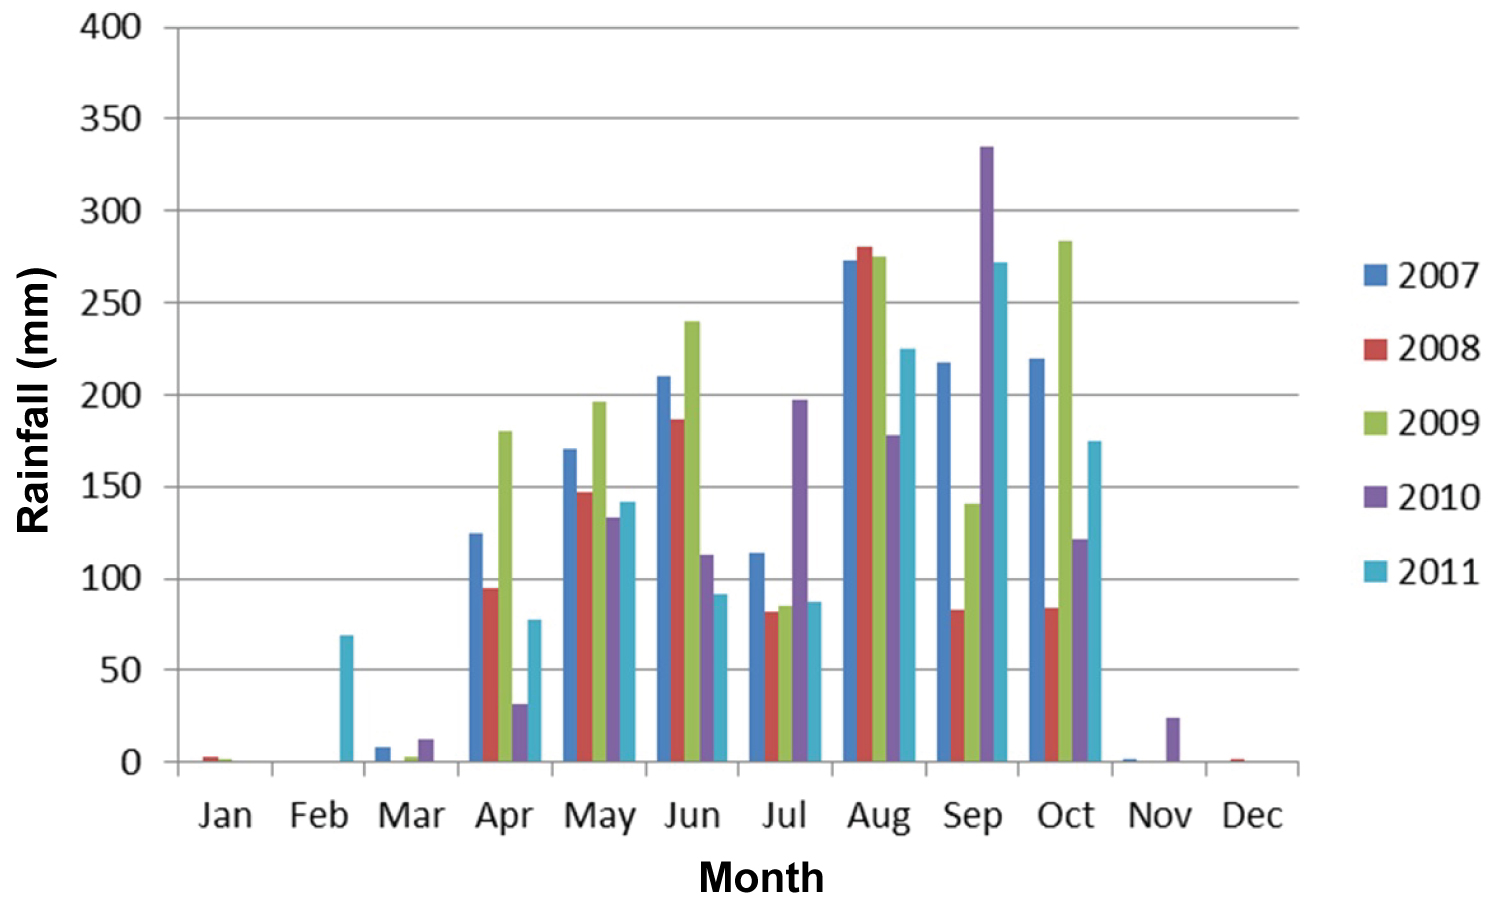
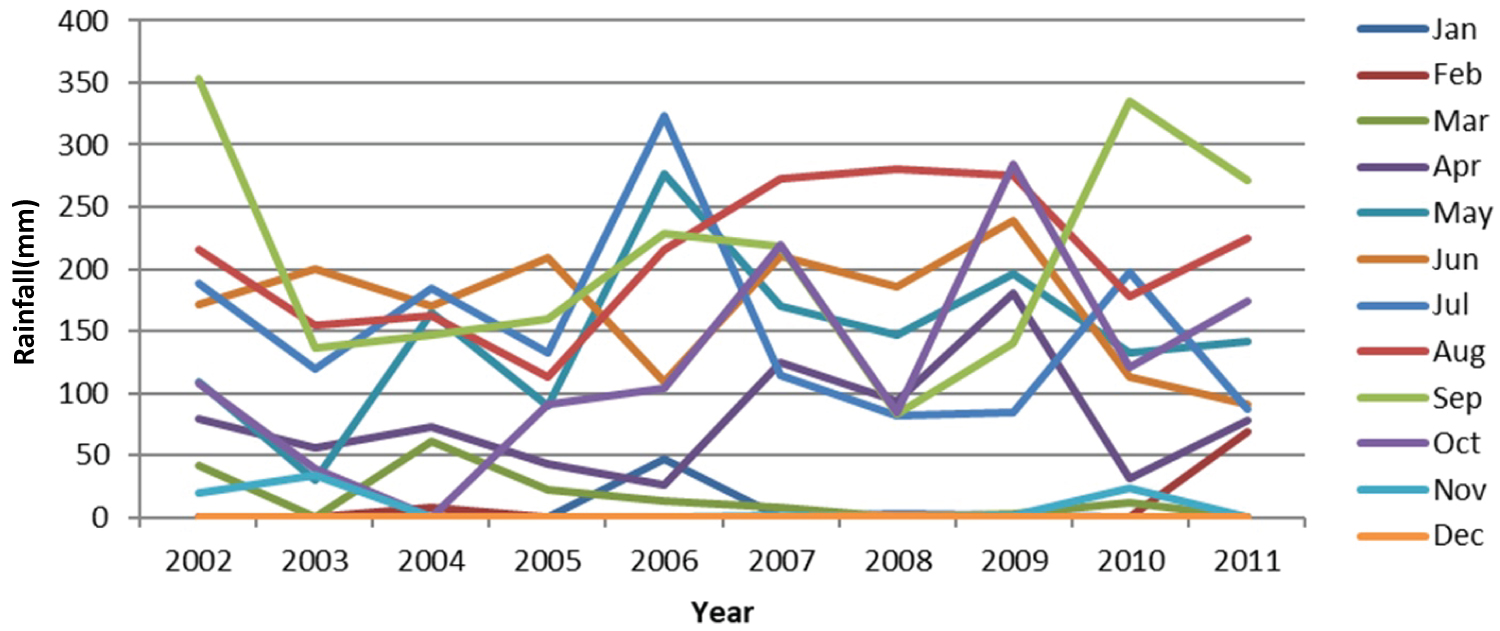
In the first five years of study (1992 to 1996), the first four months (January to April) had rainfall total amounts between zero and 100 mm. The months of May to October had amounts that varied between 100 mm and 350 mm in June 1992 with 84 mm. The months of November and December also had amounts of rainfall between zero and 30 mm (Figure 2). In the second five years of study (1997 to 2001), the limited rains that fell in the first three months were below 50 mm in amount. Also for the months of April and May, the rain amounts varied between 100 mm and 150 mm except for April 1997 that was up to 220 mm. For the months of June, August and September, the amount of rainfall varied between 150 mm and 370 mm. This indicates a general decrease (valley) in the amount of rainfall in the month of July in between the two high rainfall months (peaks) of June and August/September. At the end of the rainy season, in the month of October, the amount of rainfall also decreased to between 70 mm and 220 mm with the season ending in December (Figure 3). In the third five years of study (2002 to 2006), in the first four months (January to April) limited rainfalls were experienced and were below 80 mm. The months from May to September experienced relatively high amount of rainfall that varied between 100 mm and 350 mm except in May 2003 and 2005 that were below 100 mm. Also rainfalls were below 110 mm in October and November during this period. The rainy season ended in December (Figure 4). Between 2007 and 2011 which was the fourth five years of study. The rainfall amounts were below 80 mm in the months of January, February and March. The rainy season can be grouped into high amounts (two peaks) with low amount in between them. The first peak occurred between the month of April and June. In this peak, rainfall amounts varied between 80 mm and 280 mm with the exception of April 2010 and 2011 with amounts below 80 mm. This peak was followed by a low amount of rainfall (valley) that varied between 75 mm and 190 mm. This was followed by another high amount/peak in the months between August and October. The amounts varied between 70 mm and 340 mm. During this period, the rains virtually stopped to end the seasons except for November 2010 with rains below 50 mm (Figure 5).
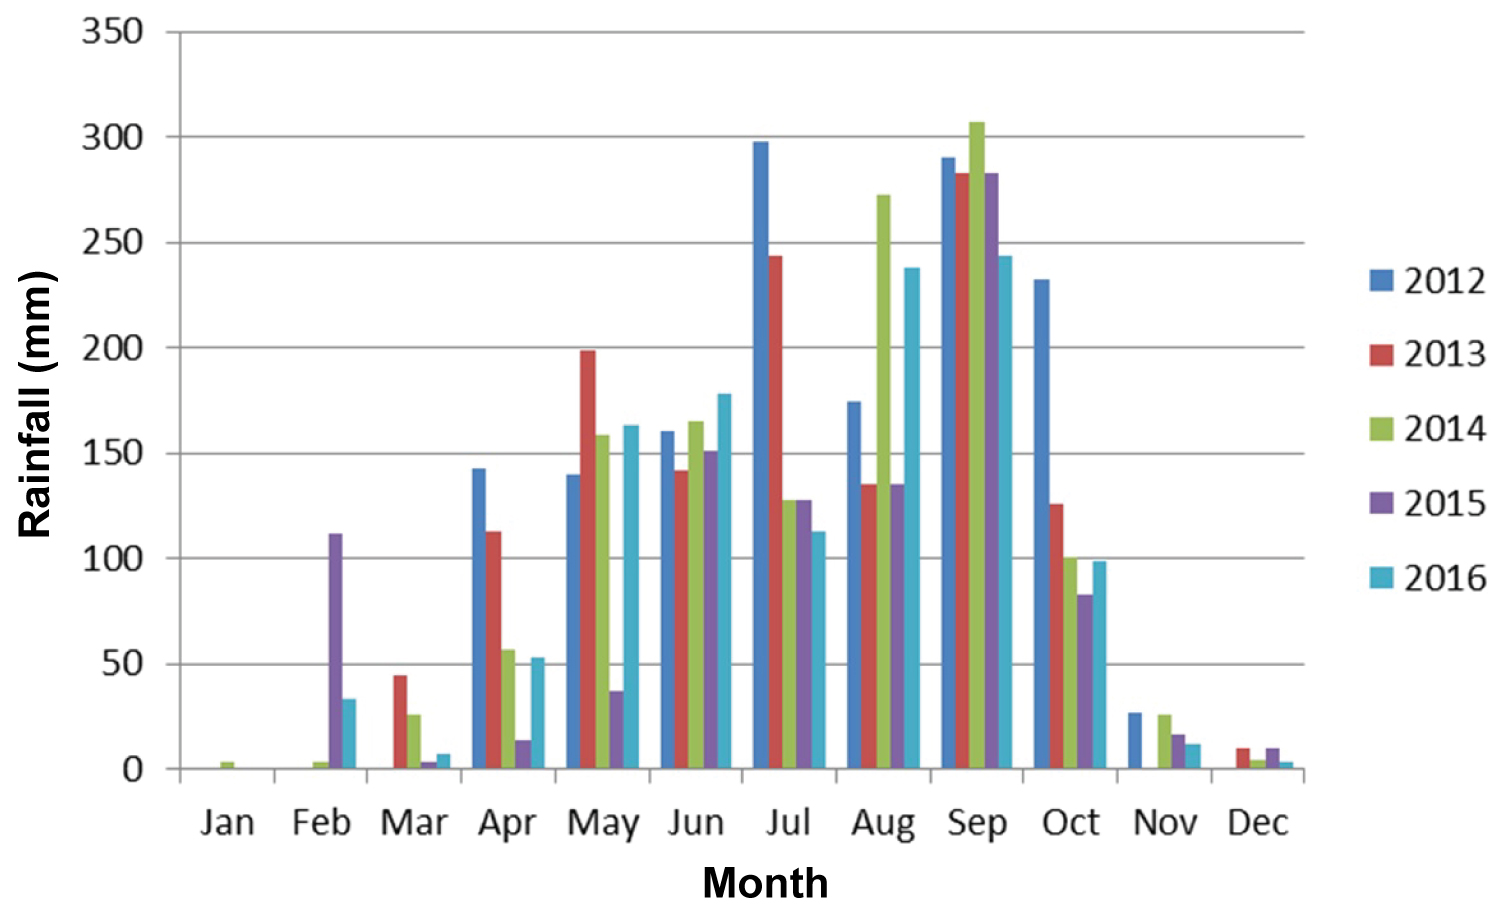
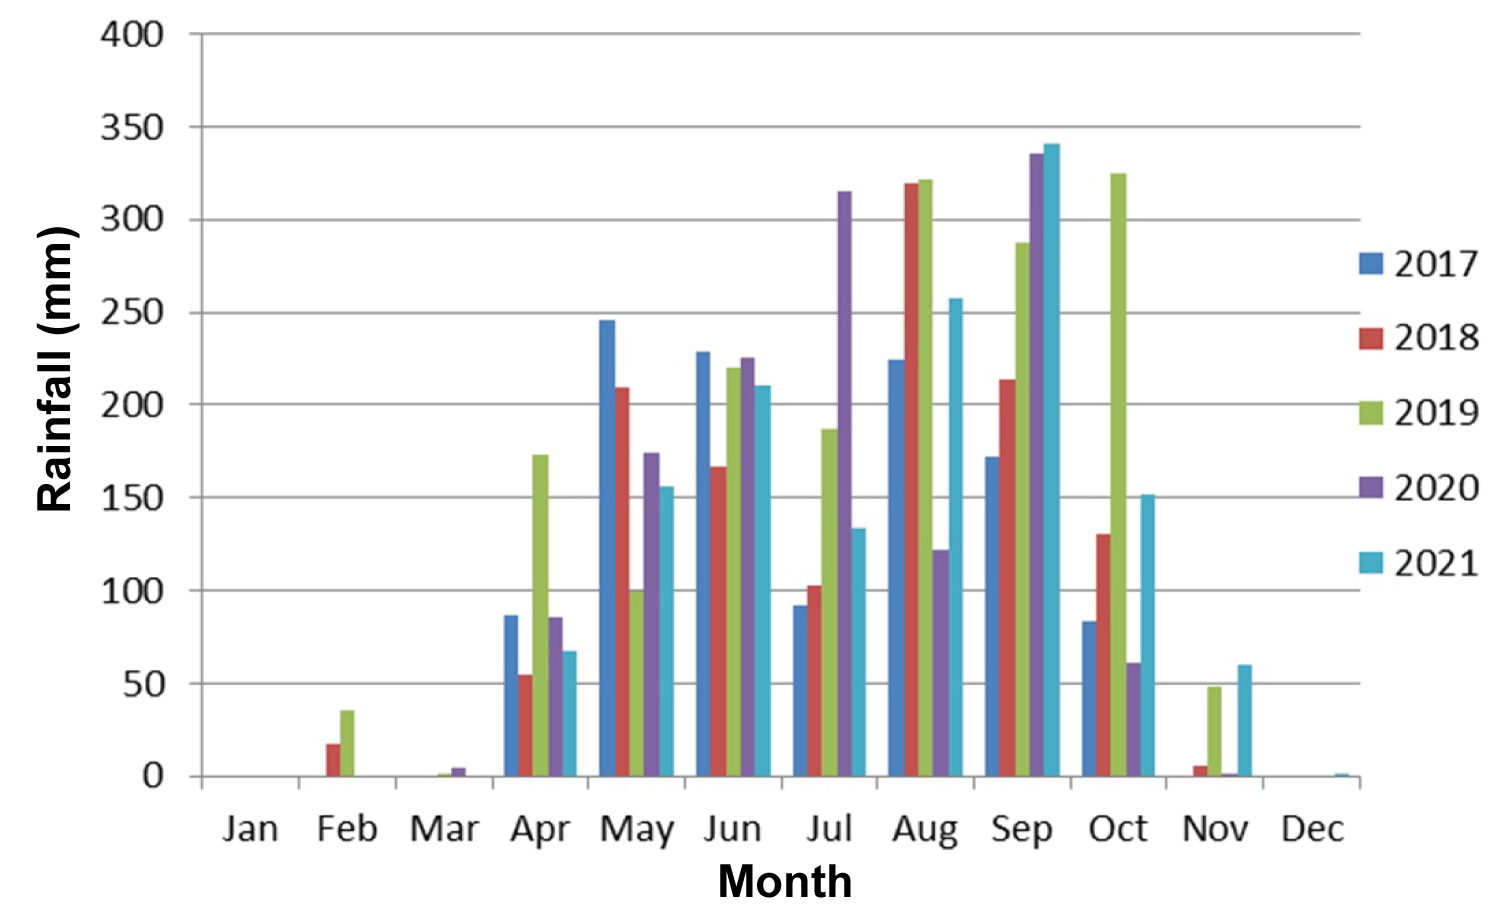
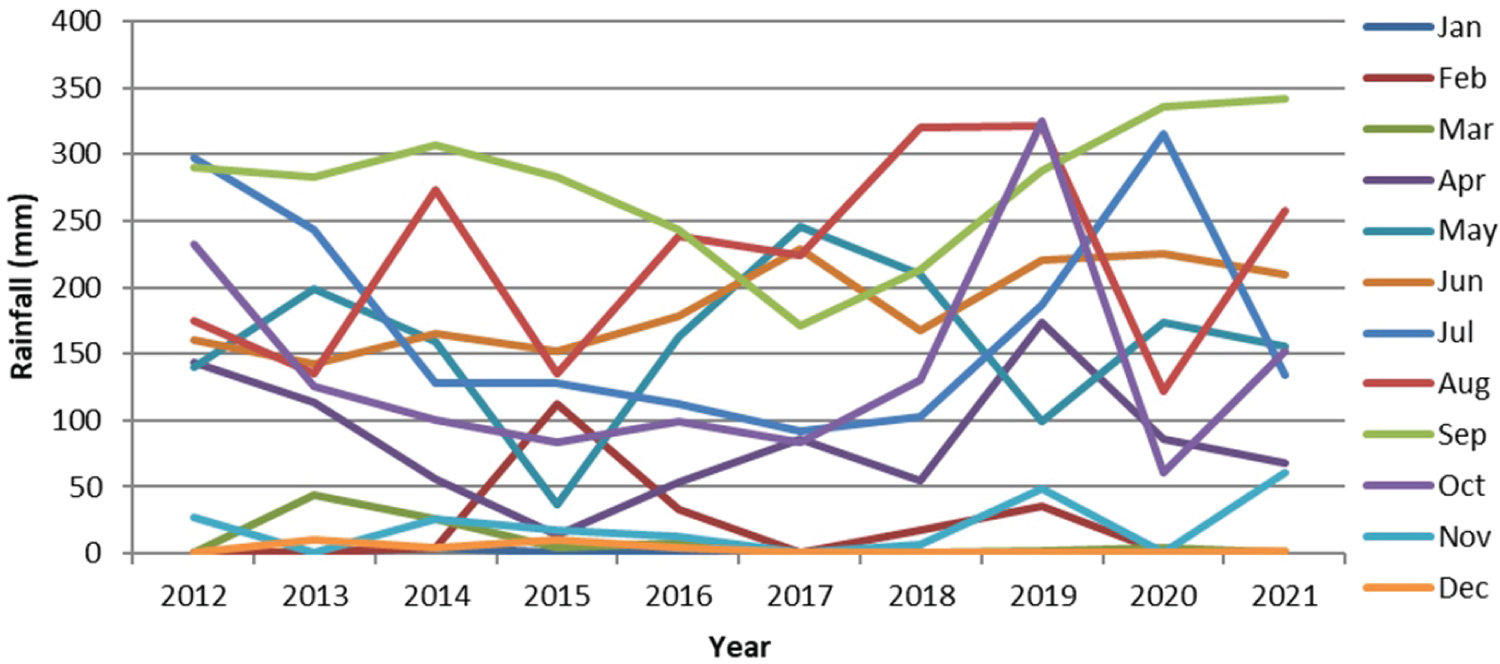
In the fifth five years of study (2012 to 2016), except for very low amount of rainfall in January 2014, rains were absent in Januarys during this period. For the three months of February, March and April, the amounts of rainfall were not high and generally below 60 mm with the exception of February 2015, and April 2012, 2013. Also, May and June rainfalls amounts vary between 130 mm and 150 mm with only May 2015 that was below 50 mm. The three months of July, August and September also indicated high amounts of rainfall that varies between 120 mm and 310 mm. The month of October also experienced decreased rainfall of generally below 130 mm with the exception of October 2012 with rainfall amount of about 230 mm. This month of October in 2012 from historical records was that of floods. The months of November and December during this period experienced low rainfall with amounts below 30 mm (Figure 6). In the last five years of study (2017 to 2021), the rains event that occurs in the months of January to March were below 40 mm. The months of April to June experienced rainfall amounts that varied between 50 mm and 240 mm. The month of July experienced a drop in amount of rainfall that was generally below 140 mm with the exception of July 2019 and 20220 with amounts between 180 mm and 320 mm. The rainfall amounts in August and September were high and varied between 170 mm and 340 mm with the exception of August 2020 that was about 130 mm. The month of October generally also had amounts that varied between 60 mm and 150 mm but with the exception of October 2019 with about 320 mm. Rains during this period had declined to below 60 mm in the month of November, with no rains in December (Figure 7).
Decadal rainfall in Makurdi
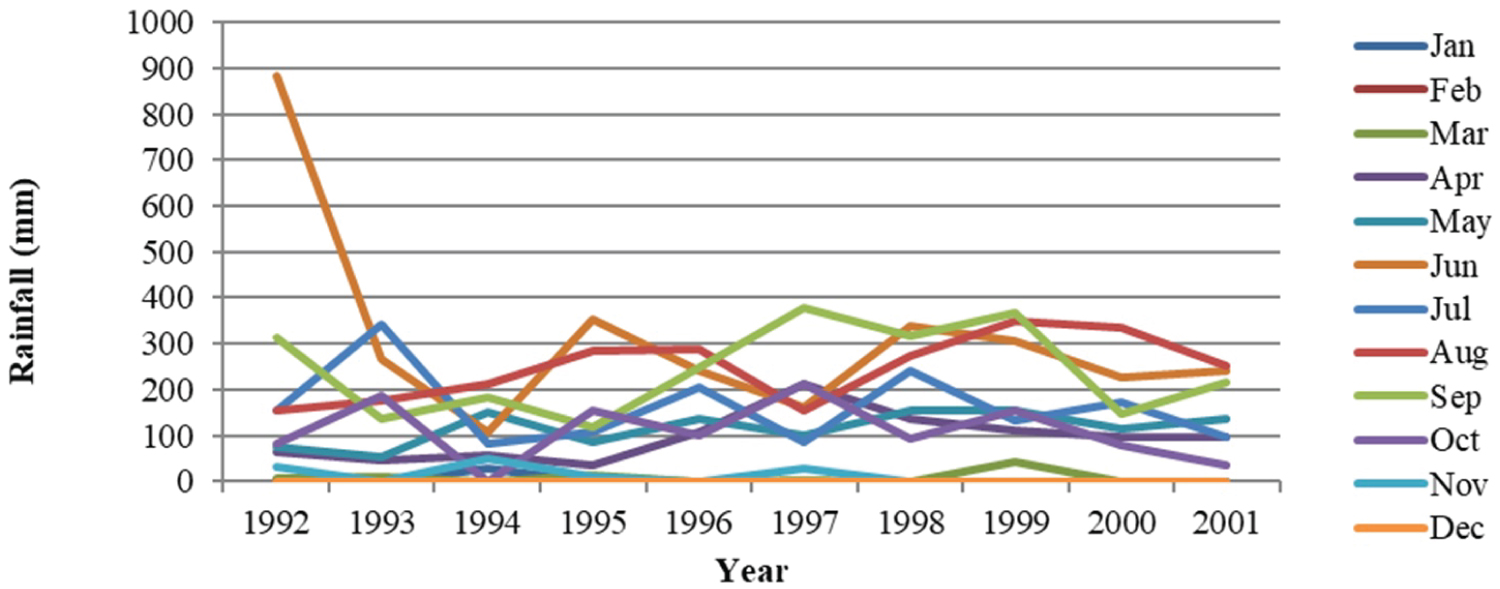
In the first decade of study (1992 to 2001), the amount of monthly rainfalls can be categorized into four. The first category includes those months with high amount of rainfall that is above 200 mm. Some of the months in this category were; June 1993, 1995; August 1996, 2000; and September 1993, 1997 and 1999. The second category includes those months with average amounts of rainfall between 100 mm and 200 mm. They include July 1998 and October 1993 and 1997. The third category of months are with low amounts of rainfall that is below 100 mm. They include April 11996, October 1994, 2001 and November 1993 and 1997. Lastly were those months without rains, they include months of January and December (Figure 8). In the second decade of study (2002 to 2011), the amounts of rainfalls in the months can be classified also into four. The first category includes months like most of the Januarys and Decembers with little or no rainfall. The next category include months with rainfall amounts below 100 mm. Some of these months include January 2007; February 2011; November 2010 and March 2004, 2007. The third category included those months with amounts between 100 to 200 mm. These months were April 2005, 2009; June 2003, 2008, 2010; July 2003, 2004. The last category includes those months with rainfall between 200 mm and 350 mm. The months included May 2006; July 2006; August 2008; September 2002, 2010 and October 2009 (Figure 9).
In the third decade of study (2012 to 2021), rainfall amounts in months can also be categorized into four. The first include months without rains such as January. Next include months with rainfall below 100 mm. Some of these months were February 2015, 2016; March 2013; April 2014, 2018; October 2017 and November 2015, 2021. This category is followed by another with months with rainfall amounts between 100 mm and 200 mm. Some of the months include April 2013; May 2013, June 2015, 2018; July 2019; August 2020 and September 2017. The last category include months with rainfall amounts between 200 mm and 350 mm. Some of these months include May 2017; June 2020; July 2020; August 2014, 2019, 2021 and September 2013, 2014 and 2020 (Figure 10). The above findings show that some months such as July, August and September experience high amount of rainfall that in association with other factors make the flood plains of river Benue prone to seasonal inundation [1,5].
Water levels in Makurdi
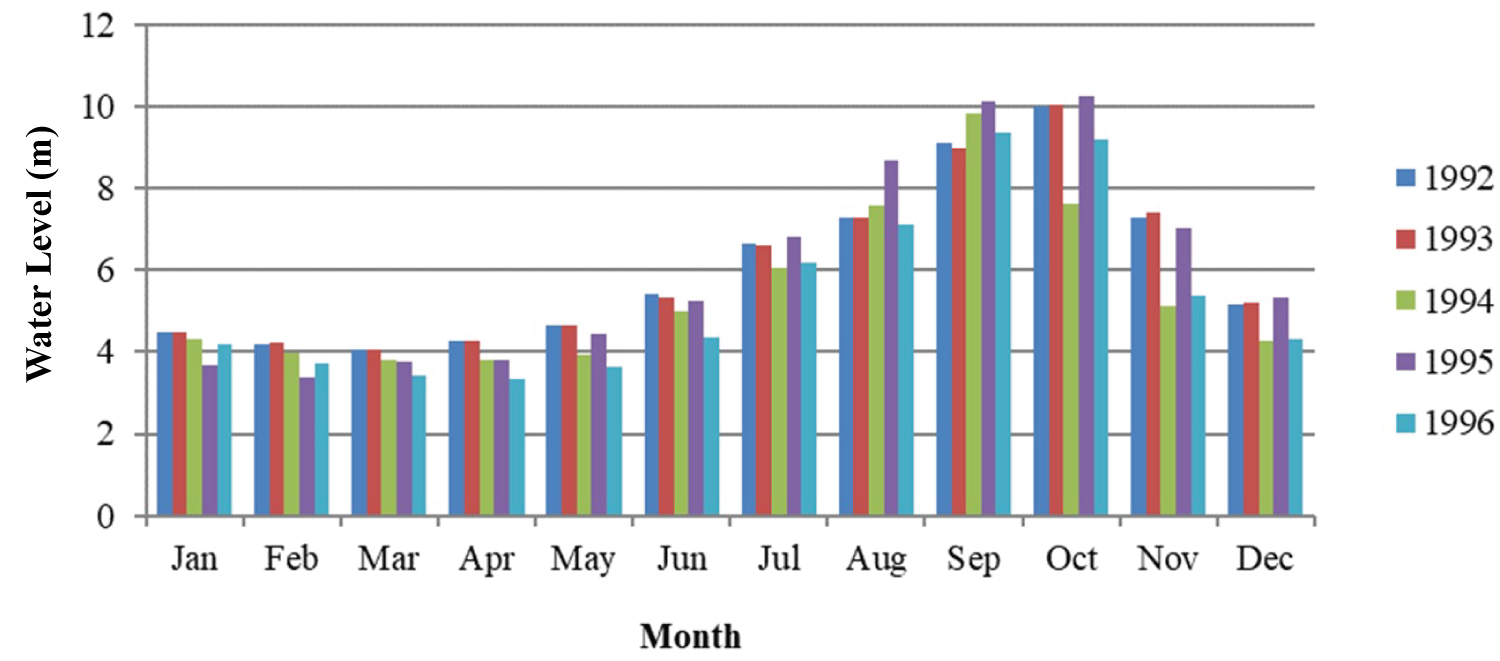
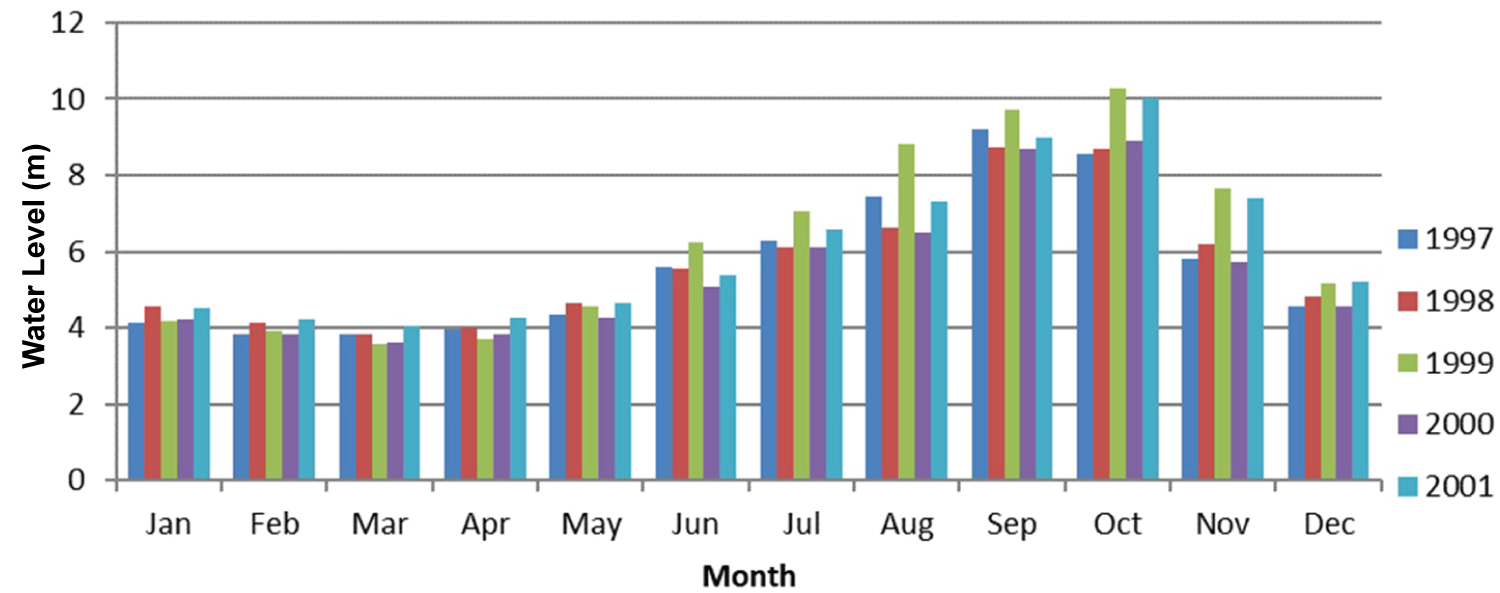
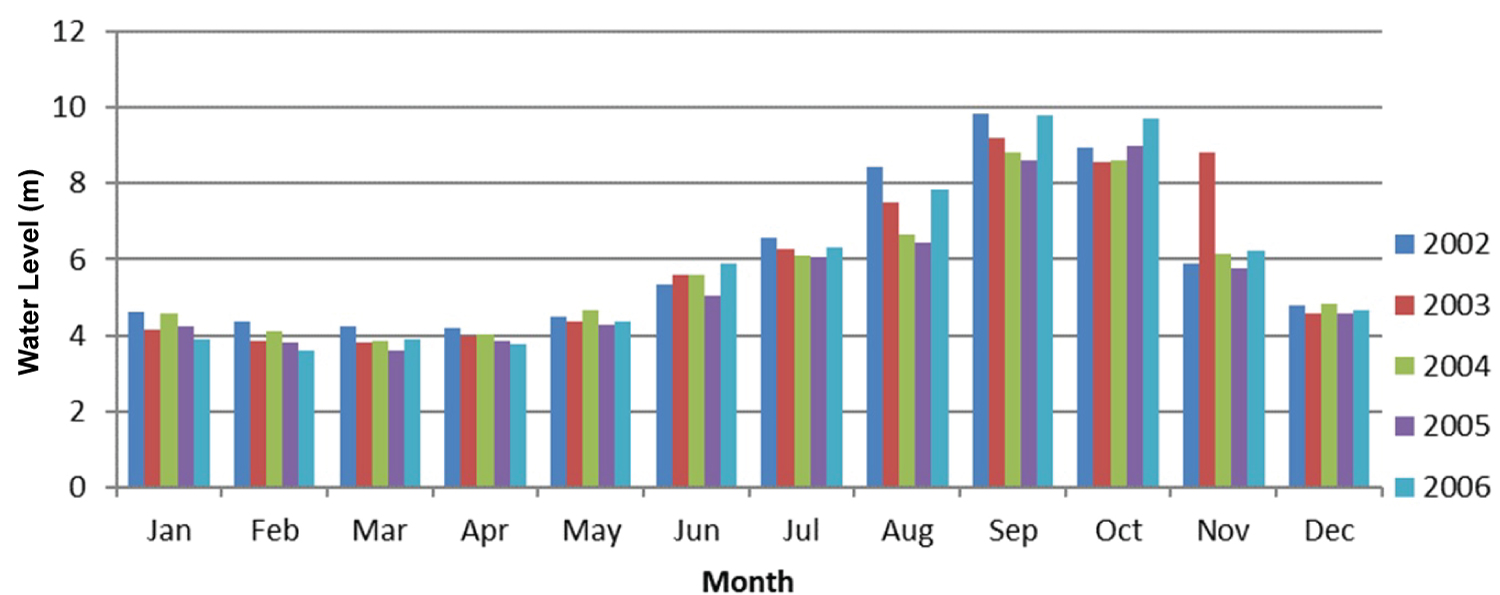
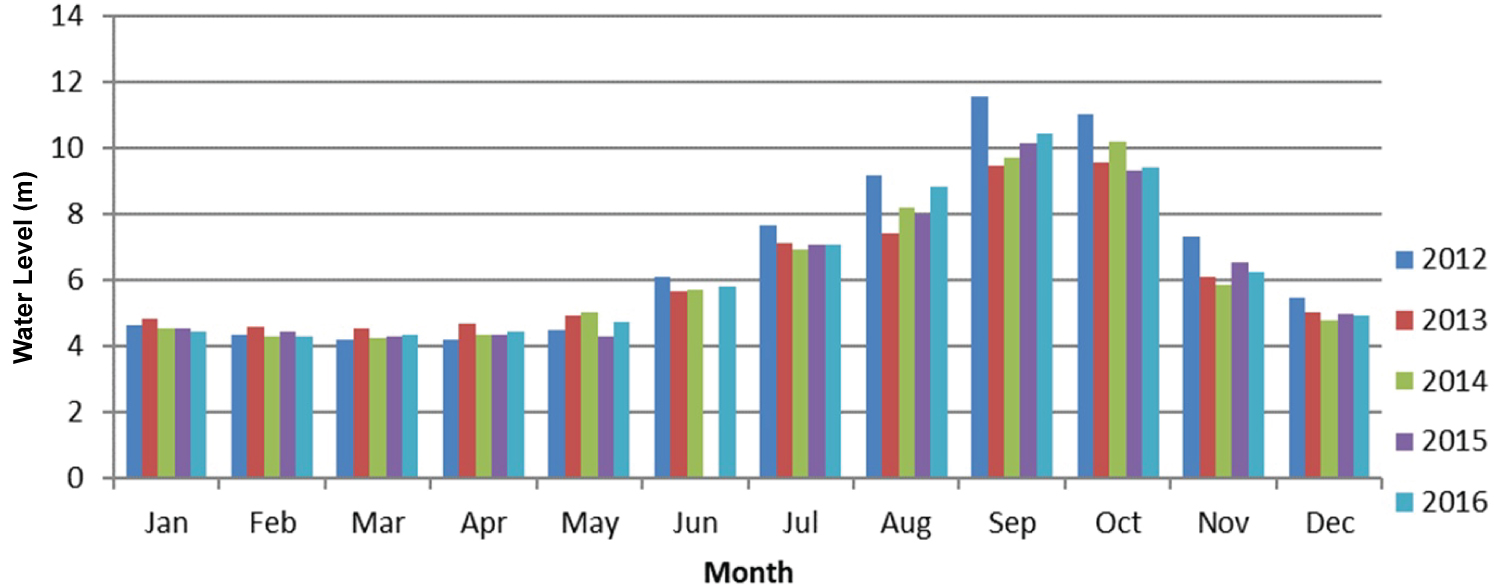
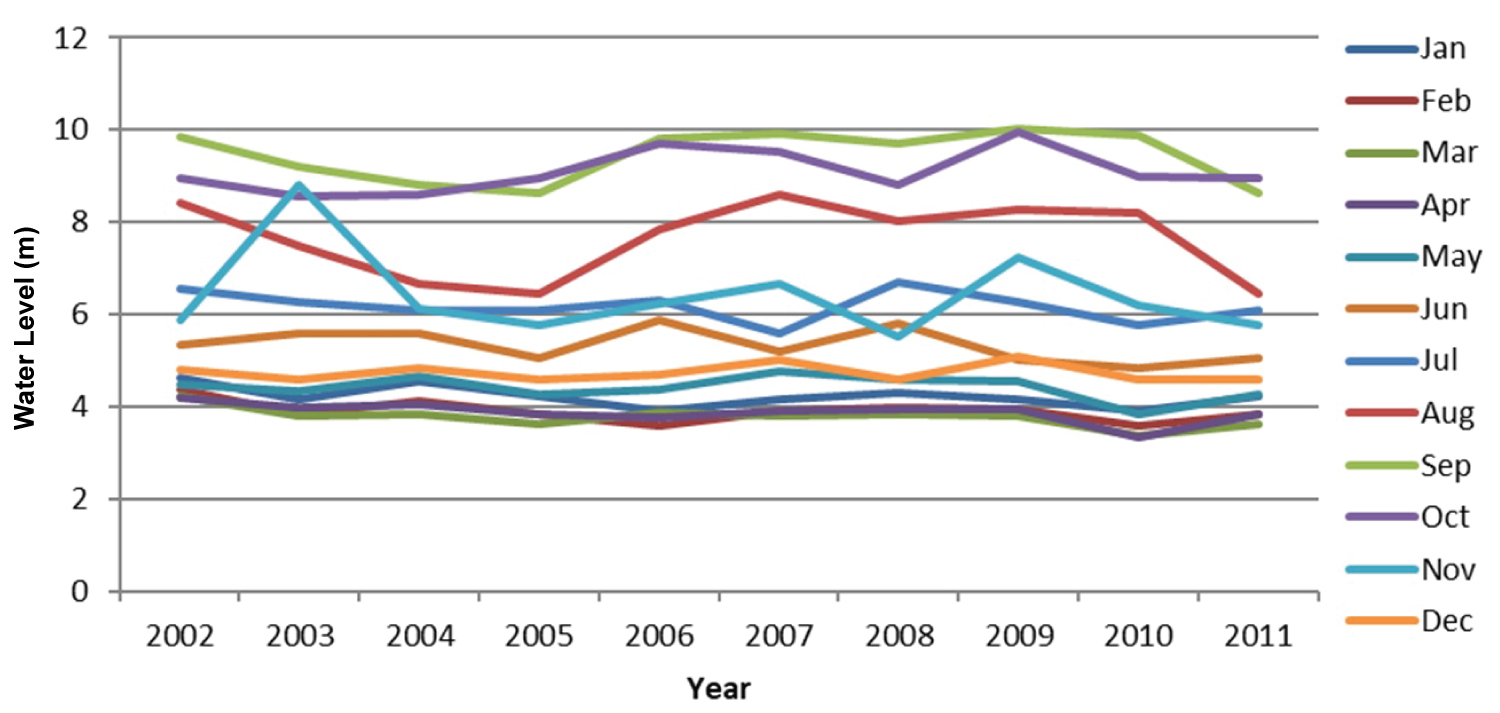
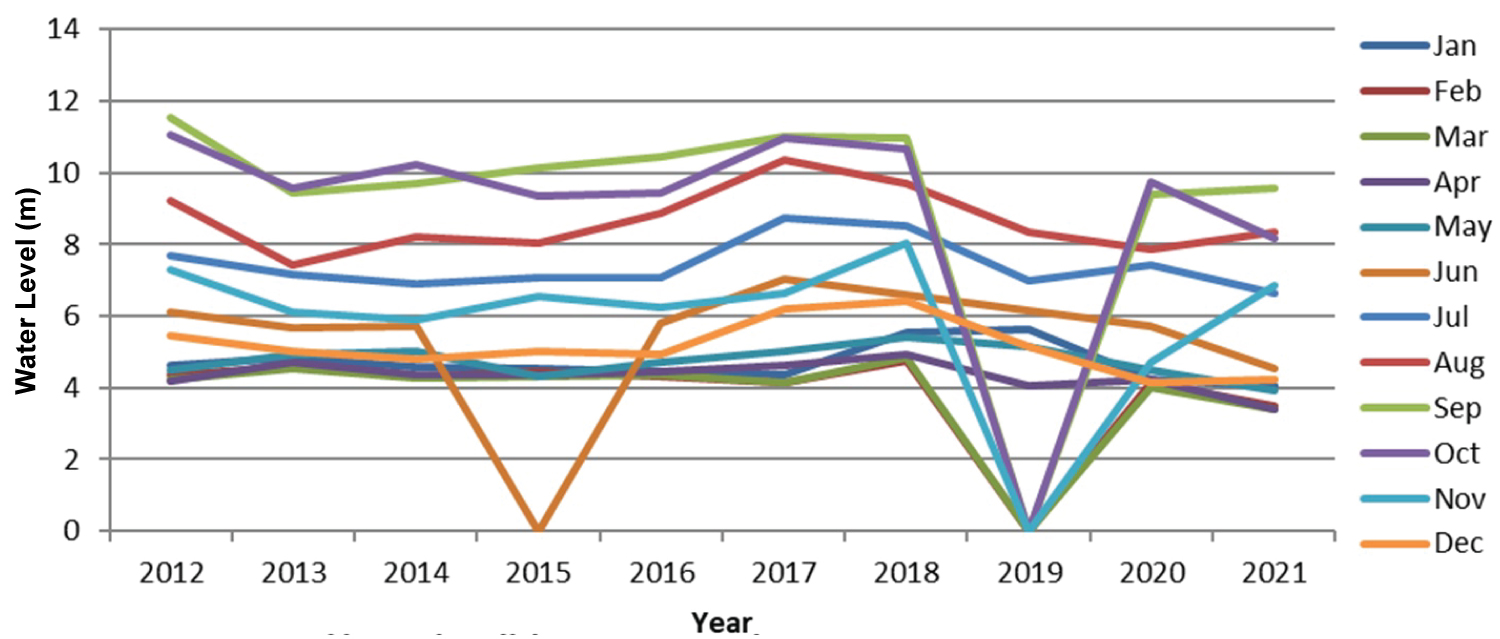
In the first five years of study (1992 to 1996), the level of water consistently stayed below 5m in the months between January and May. In general, the water level rose above the 5m in June and continued that way to get to its peak in the months of September and October, before it declined in the months of November and December (Figure 11). Also in the second five years of study (1997 to 2001), the same trend exhibited in the first five years of study was also observed as it concerns the water levels in the various months of the year (Figure 12). The characteristics of the water levels of river Benue that included being below 5 m in the first five months of the year and also the gradual increase from the month of June to reach its peak of about 10 m in September and October and the decline thereafter in the months of November and December as noticed in the first two five years of study (1992 to 1996 and 1997 to 2001) were also clearly exhibited in the third and fourth five years of study (2002 to 2006 and 2007 to 2011) (Figure 13 and Figure 14). In the fourth five years of study (2012 to 2016), the months between January and May experienced water levels below 5 m. However by June, the water levels have exceeded 5 m and were closer to 6 m. The water levels gradually increased to reach their peaks in September and October with some being above 10 m (September 2012, 2015 and 2016; October 2012 and 2014). These were the flood prone months of Makurdi [1,5]. Thereafter, the water levels receded to below 8m (Figure 15).
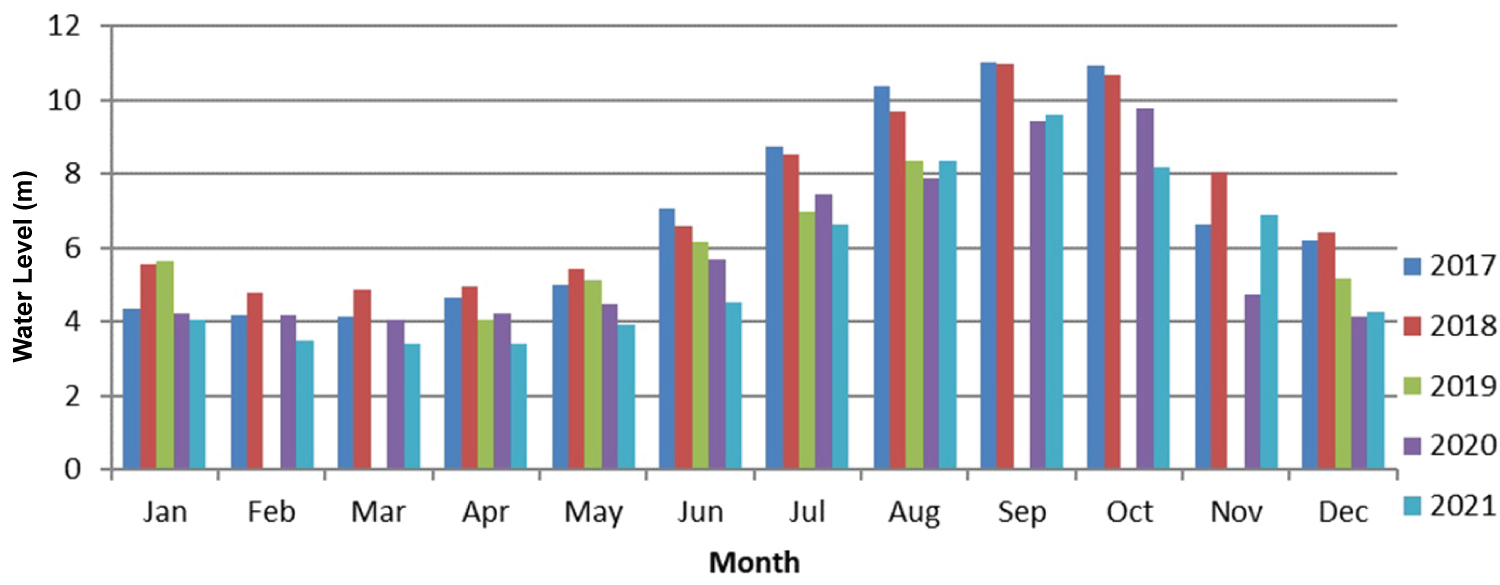
In the last five years of study (2017 to 2021), the water levels varied between 3m and 6m in the first five months (January to May) of those years. In June the water levels in some of the years were above 6m (June 2017 and 2018). The water levels generally increased and got to their peaks that vary between 8m and 11m in the months of August, September and October but also in November 2021. These were probably the months that floods were very prevalent in the areas prone to them due to high water levels and other conditions mentioned earlier. The water levels also vary between 4m and 7m in the months of November and December during this period (Figure 16).
Decadal water levels in Makurdi
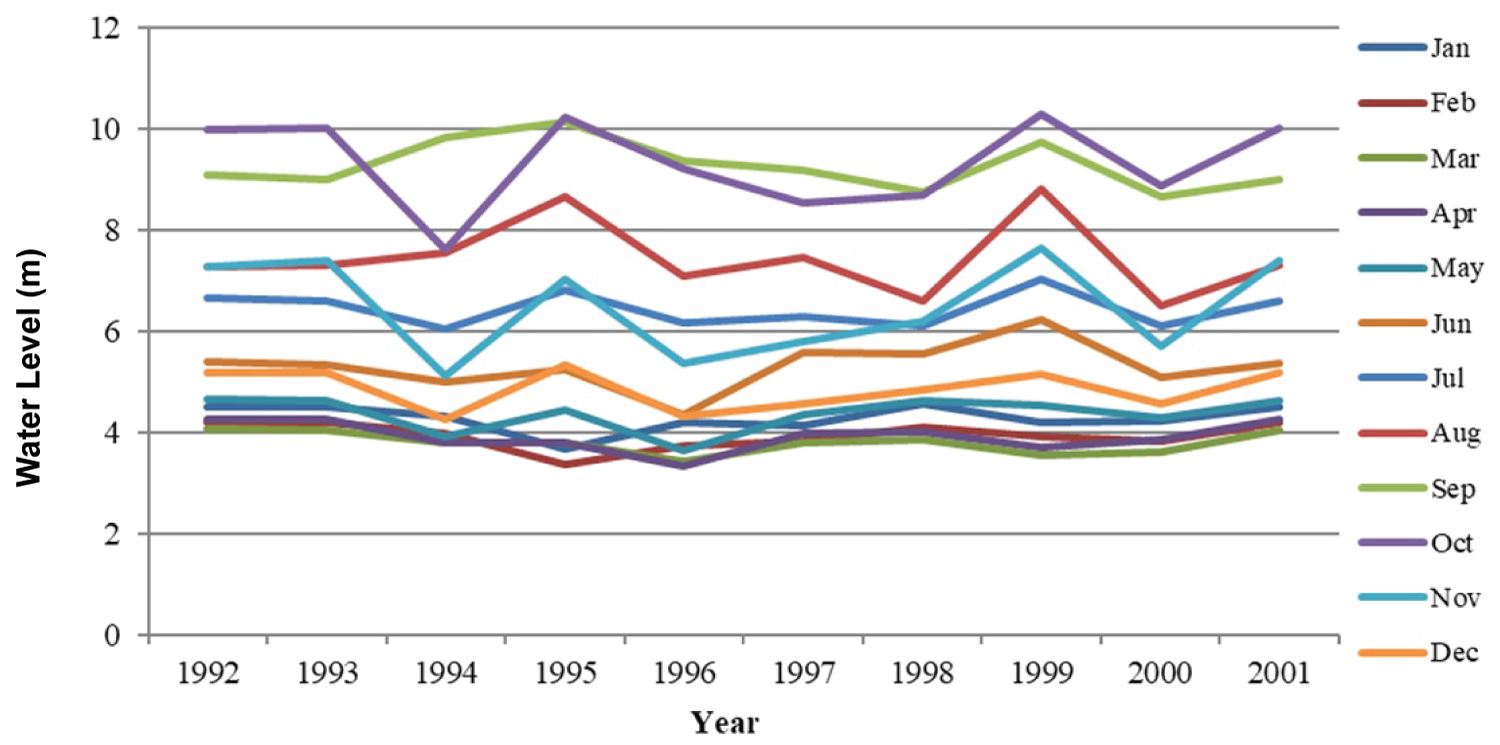
In the first decade of study (1992 to 2001), the water levels can be categorized into three; the first category is the water level between 3m and 6m. The months during this period that experienced this level included; February 1995; April 1996, 2001; May 2001; November 1994, 1995, 1996, 2020; December 1995, 1999. This water level obviously did not trigger the occurrence of floods in the River Benue basin especially in Makurdi. The second category is when the water level vary between slightly below 6 m and 8 m. The months that were included are; July 1993, 1994, 1996; August 1994, 1996, 1997, 1998, 1999 and 2000. This water level is also not exactly high enough to sustain wide spread flood, but may be able to do so in certain local areas close to the channels of the river. The third category is when the water level vary between above 8 to above 10m. The months involved were; September 1993, 1994, 1997, 1999, 2001; October 1993, 1994, 1995, 1997, 1998, 2000 and 2001. This water level probably caused floods in areas prone to it in Makurdi (Figure 17).
In the second decade of study (2002 to 2011), the water levels can also be classified into three categories. The first of the three categories being water levels between 3 m to 6 m. Some of the months in this category included; January 2009; April 2002 to 2011; May 2002 to 2011; June 2002 to 2011; July 2007 and November 2008. The low level of water could be attributed to the rains not being at the peak. This also resulted in absence of floods. The second category is the water levels between above 6m and 8m. The months that this situation occurred included; July 2003, 2004; August 2003, 2004; November 2004, 2005, 2006 and 2011. The third category included those water levels that vary between above 8m and 10m. This high level of water probably made the flood plains and areas close to the rivers to be inundated. The months that this occurred included; September 2002 to 2011; as well as October 2002 to 2011 (Figure 18).
In the third decade of study (2012 to 2021), the water level below 6m occurred in the months of January of 2012 to 2021; March of 2012 to 2021; April of 2012 to 2021; May of 2012 to 2021; June of 2013 to 2016; November of 2012 to 2021; December of 2012 to 2021. This was the period of low water level and absence of flood in Makurdi. The next category had water level between above 6 m and 8 m. The months in which this took place were; June of 2018, 2019; July of 2012 to 2017, 2019 and 2021; August of 2013, 2014; November of 2013, 2015, 2016, 2018, 2019 and 2021. Although there was increase in the water level, there were limited flooding in the region. The third category included situations when water levels vary between above 8m and 12m. This took place in months such as; August of 2016, 2017, 2019, 2020; Septembers of 2012 to 2018, 2021 and October of 2012 to 2021. This was the period with the highest level of water with areas prone to flood in Makurdi being affected by it (Figure 19) [2,5].
Five years discharge of river benue in Makurdi
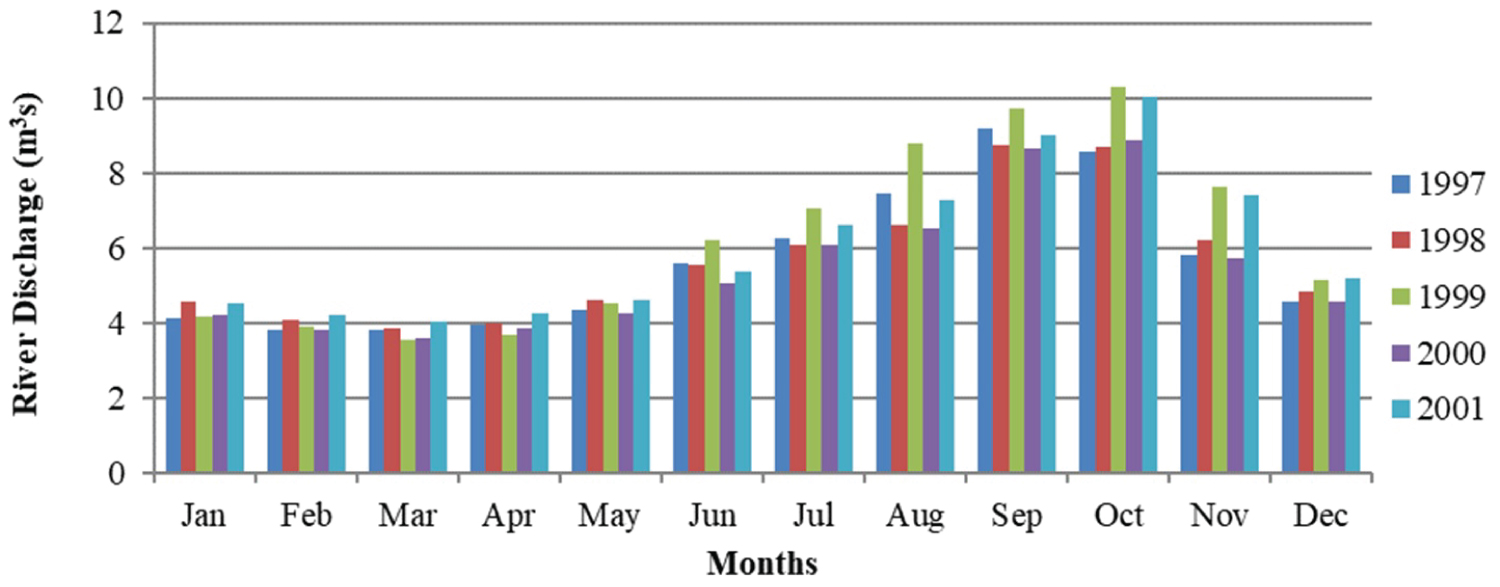
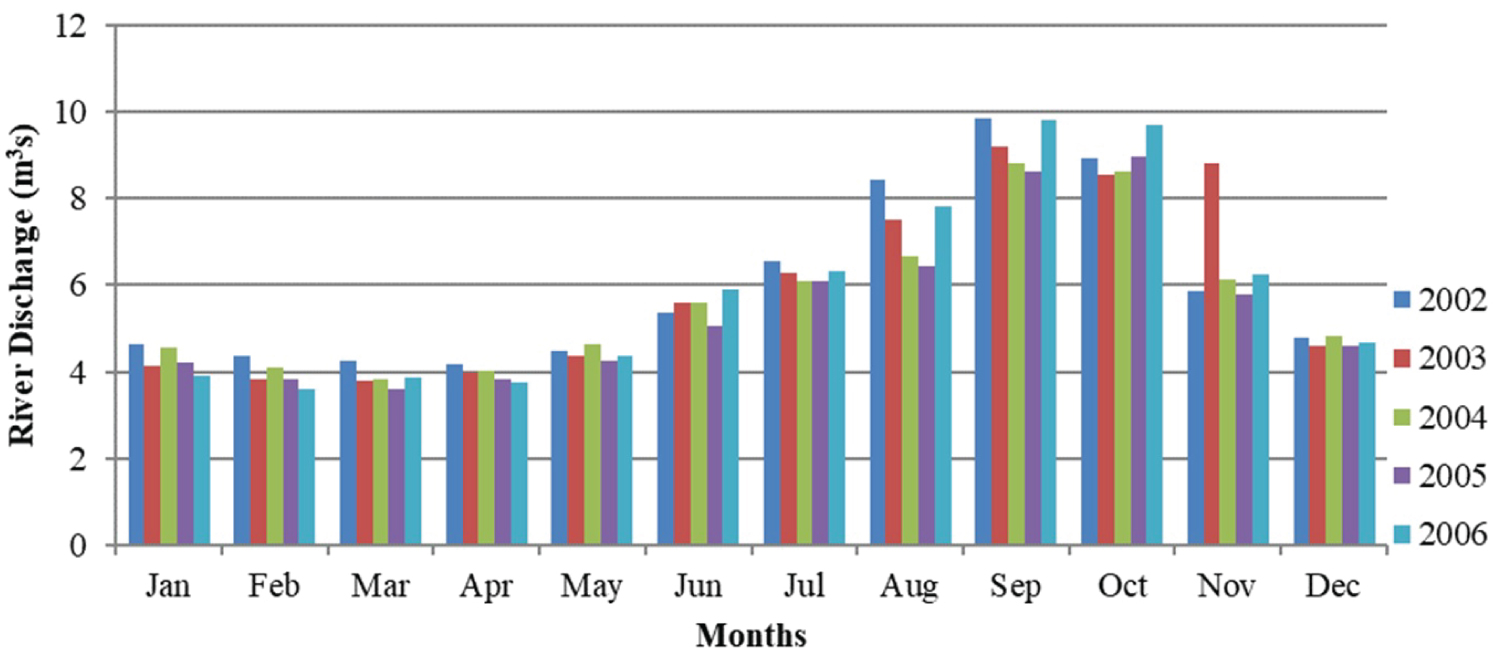
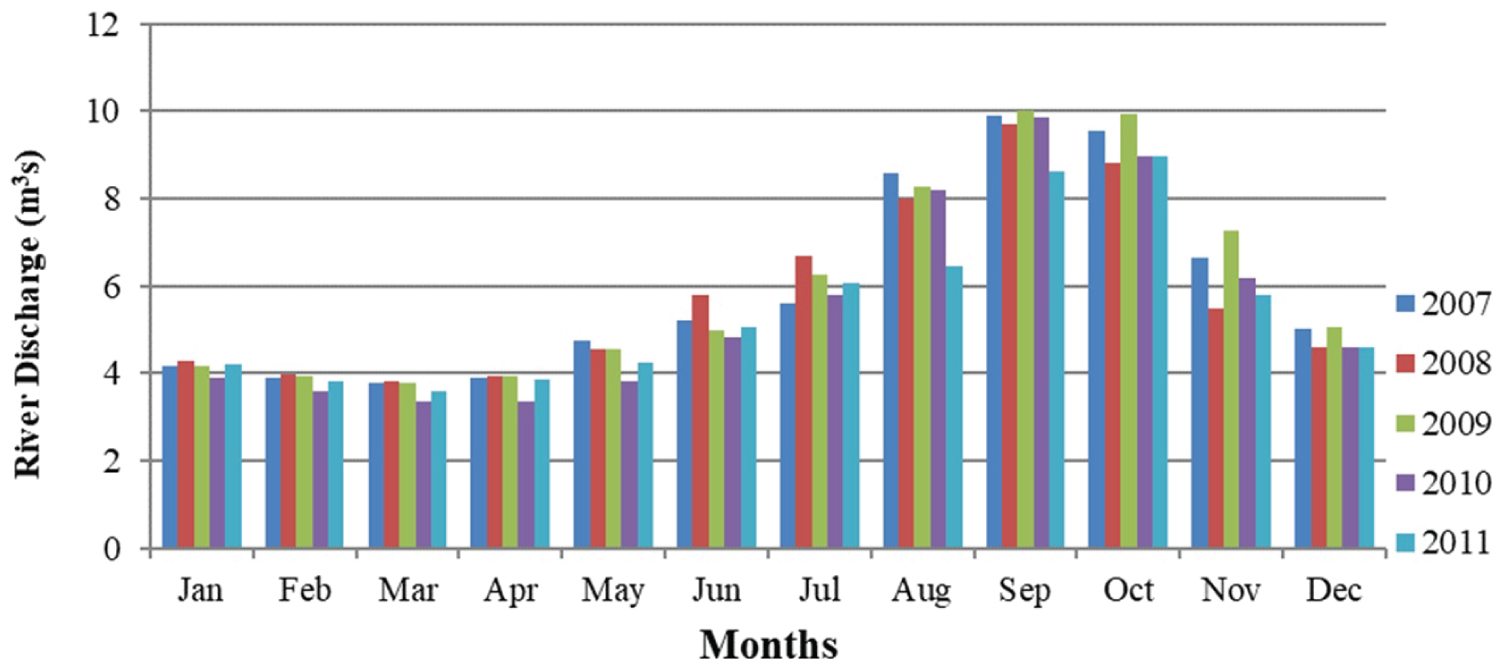
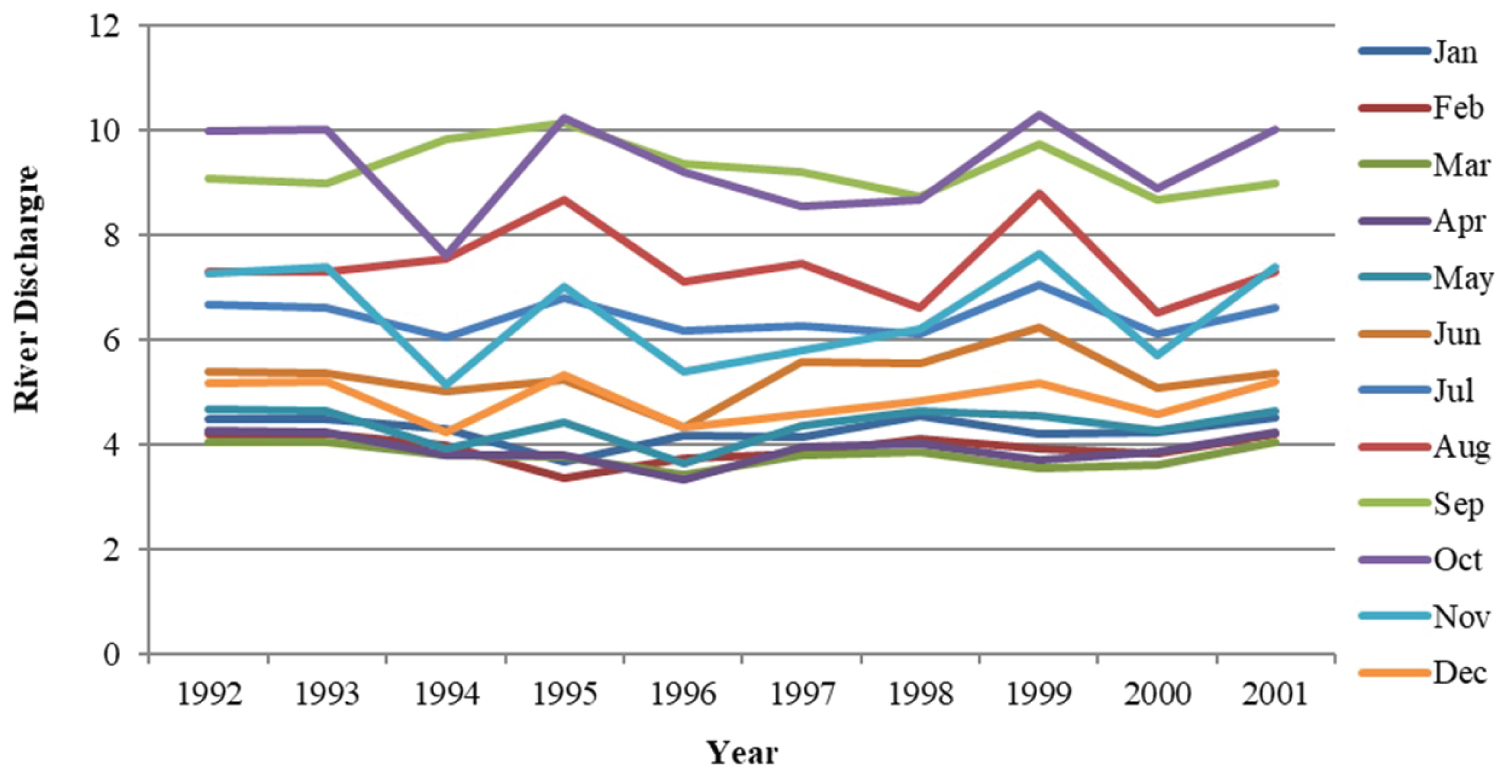
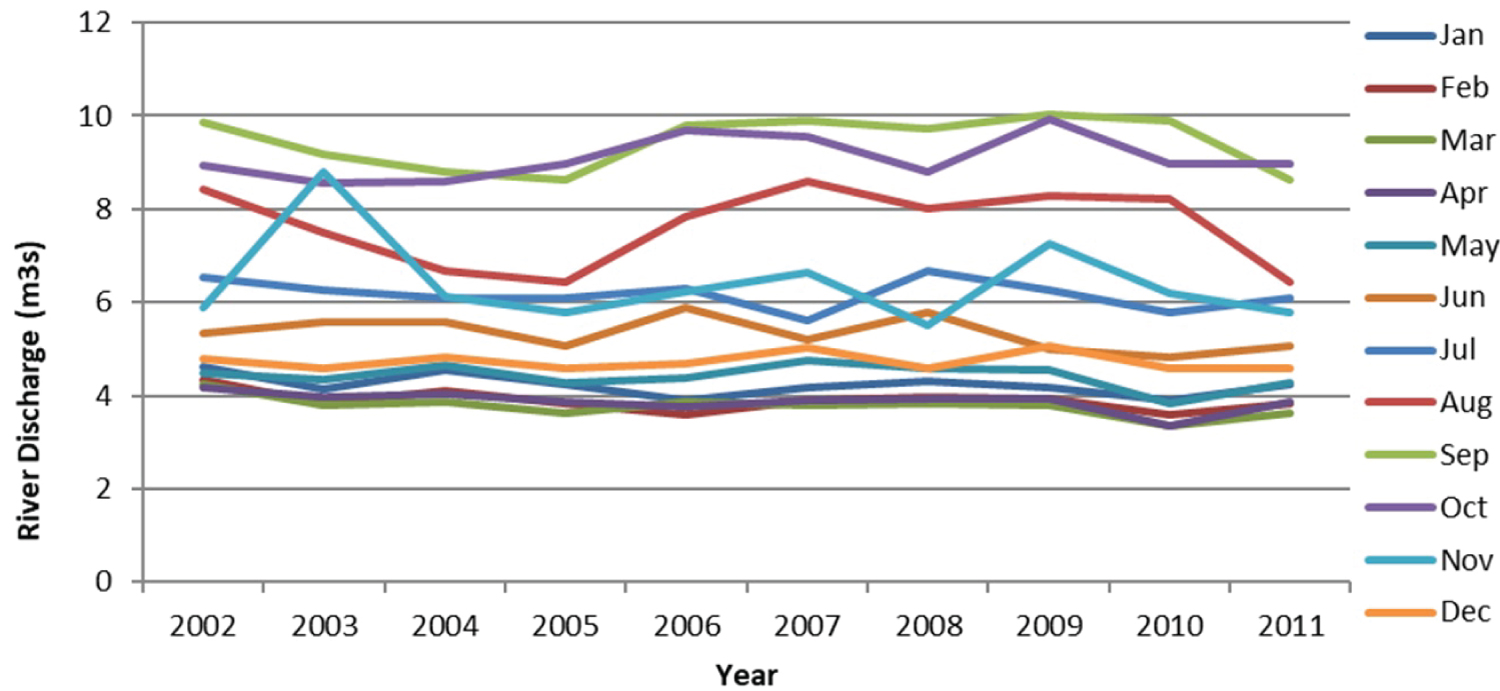
In the second five years of study (1997 to 2001) in Makurdi, the river discharge stayed below 5 m 3 s in the months between January and May as well as December. However, in other months (June to November), the discharge vary between 5 m 3 s to above 10 m 3 s reaching its peak in the months of September and October (Figure 20). These same trends that occurred in the second five years of study were also repeated in the third five years of study (2002 to 2006) and fourth five years of study (2007 to 2011) with the exception that the maximum discharge in the months of September and October were slightly below the 10 m 3 s (Figure 20, Figure 21, Figure 22 and Figure 23).
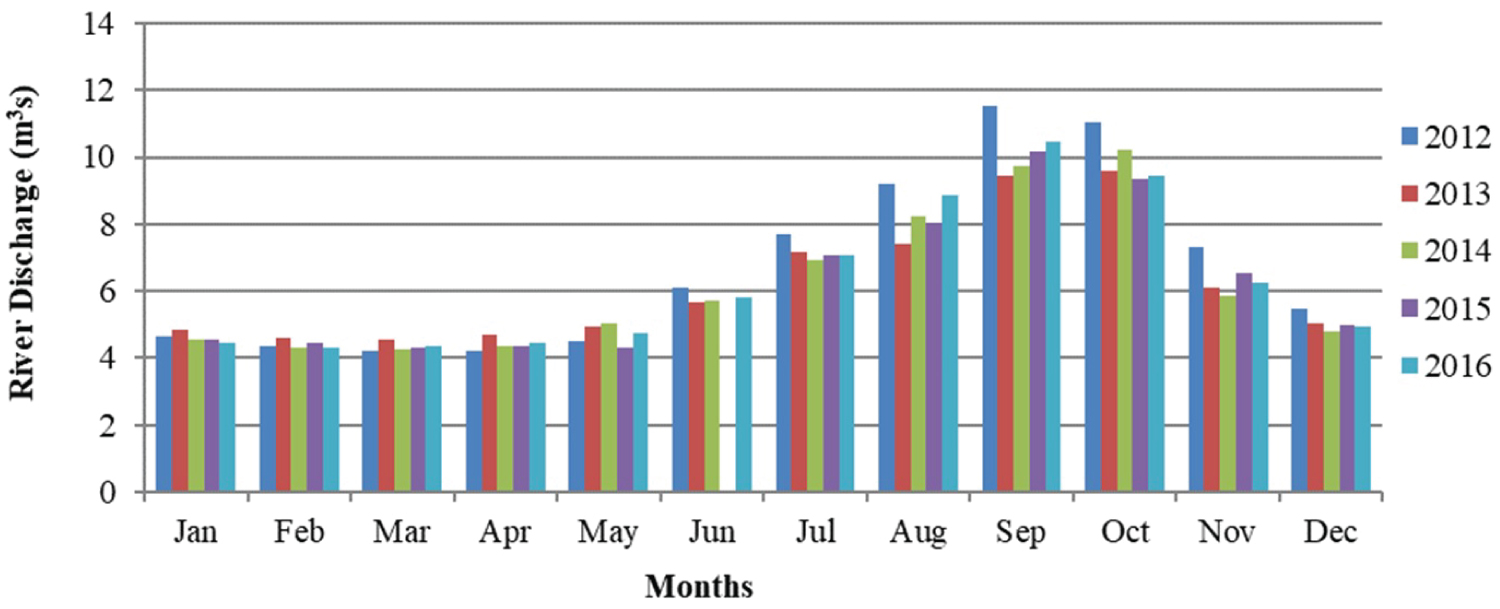
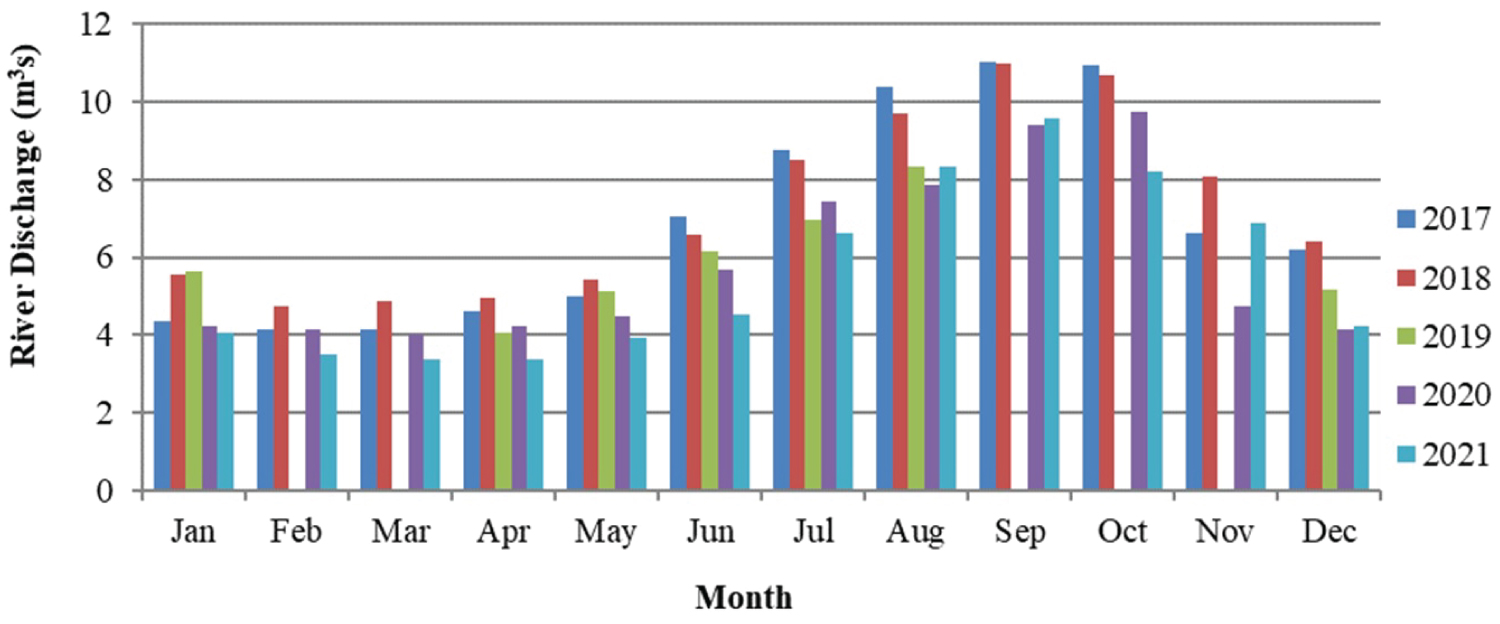
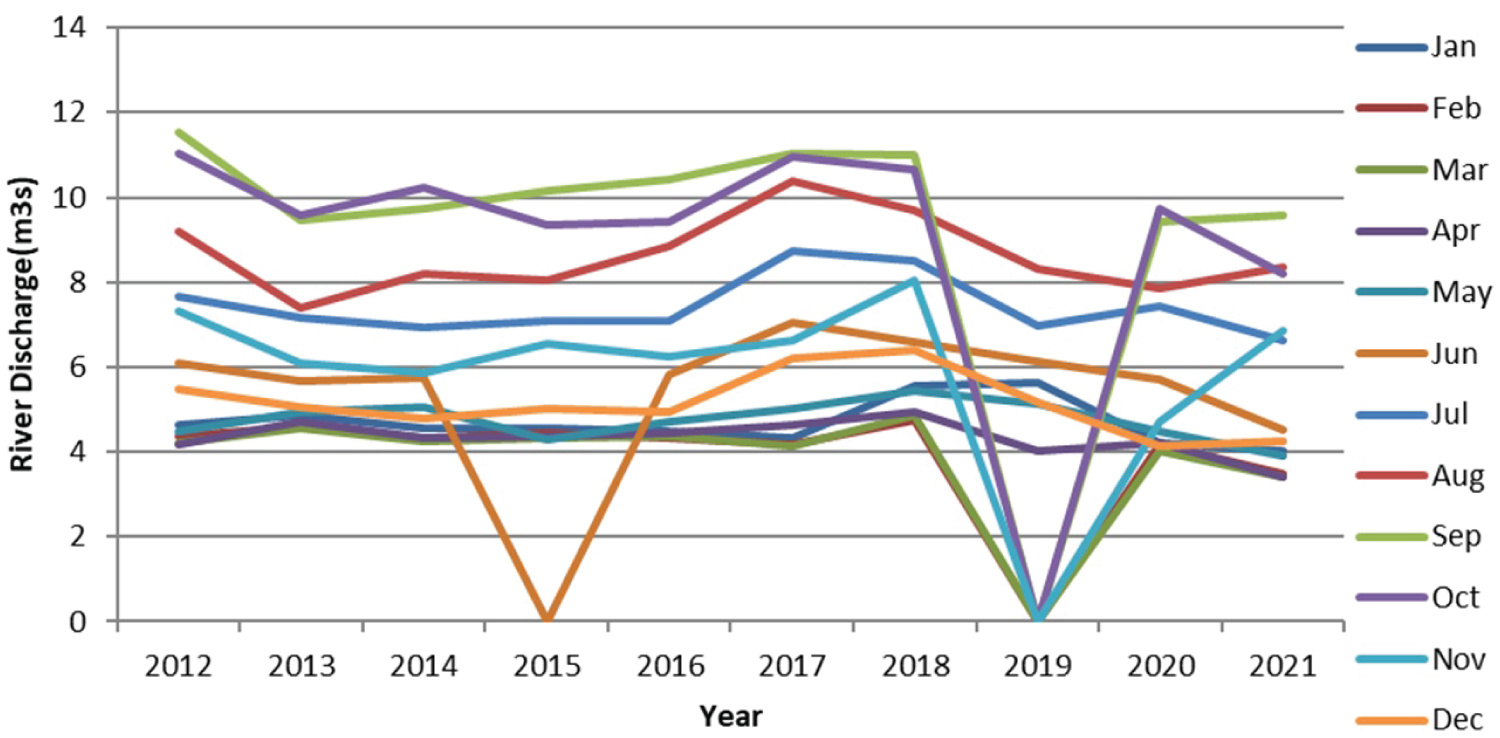
In the fifth five years of study (2012 to 2016), the river discharge was below 5 m 3 s in the months from January to May and in December. However, in the months of June to November, discharges vary between 5 m 3 s and below 12 m 3 s with the highest rates experienced in months of September and October (Figure 24). In the last five years of study (2017 to 2021), the river discharge in the months of January varied between 4 m 3 s and 5.8 m 3 s, also vary between 3.6 m 3 s and 5.8 m 3 s in the months between February and May. It also fluctuated between 4 and 11 m 3 s in the months between June and December (Figure 25).
Decadal trends of river discharge in Makurdi
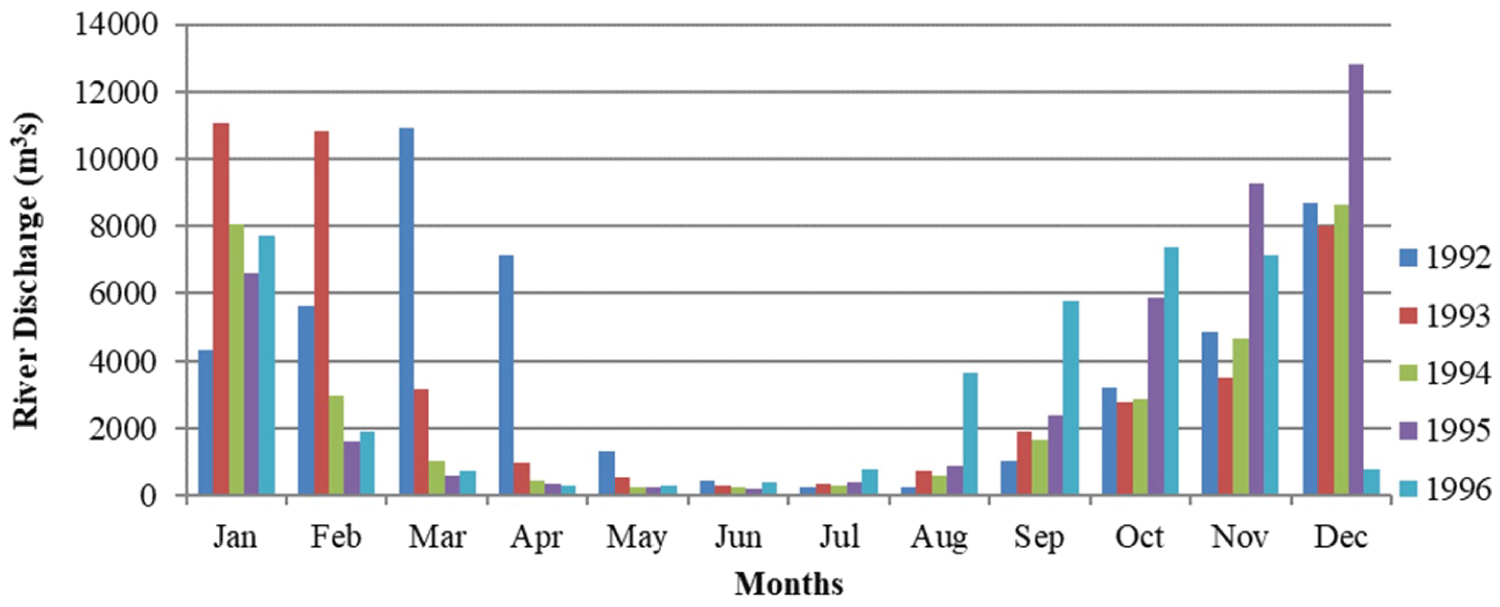
In the first decade of study (1992 to 2001), the lowest discharge rates that varied between 3.3 m 3 s and 6 m 3 s were in the months of April of 1992 to 2001; May of 1992 to 2001; June 1992 to 2001; November 1992 to 2001; December 1992 to 2001. Months that experienced river discharges of between 6 m 3 s and 8 m 3 s included July of 1993 to 2001; August of 1992 to 1994, 1996 to 1998, 2000 to 2001; October 1994 while discharge of above 8 m 3 s occurred in months such as; September of 1992 to 2001;October of 1992 to 1993 and 1995 to 2001(Figure 26).
In the second decade of study (2002 to 2011), the months of April, May, June and December of 2002 to 2011 as well as the months of July of 2007, 2009; November 2005, 2008, 2009 and 2011experienced River discharges that vary between 3.3 m 3 s and 6 m 3 s. The months of July of 2002 to 2006, 2008 to 2010; August 2003 to 2006, 2011 and November 2002, 2005, 2006, 2007 and 2010 experienced discharges that vary between before 6 m 3 s and 8 m 3 s. Furthermore, months such as September of 2002 to 2011; October 2002 to 2011; November 2003 and 2004 discharges that were above 8 m 3 s (Figure 27).
In the third decade of study (2012 to 2021), the months with river discharges were; April of 2012 to 2021; May 2012 to 2021; June 2012 to 2016, 2020, 2021 and December 2012 to 2017, 2019 to 2021. The months that experienced discharges between above 6 m 3 s to 8 m 3 s were July of 2012 to 2017, 2019 to 2021; August 2013, 2014, 2020 and November of 2012 to 2019, 2021. The months with highest rates of discharge at above 8 m 3 s were; August of 2012, 2015 to 2019, 2021; September of 2012 to 2018 and October of 2012 to 2018 (Figure 28).
Significant variations and correlation amongst rainfall, water level and discharge
Monthly variations: The results of One-Way ANOVA reveal that there were significant monthly variations in rainfall (F (11, 347) = 88.822, P < 0.001) and water level (F (11, 342) = 317.409, P < 0.001). There was no significant monthly variation of river discharge (F (11, 342) = 1.27, P = 0.240) in Makurdi (Table 1).
Yearly variations: There were no significant yearly variations of rainfall (F (29, 330) = 0.370, P = 0.999) water level (F (29, 324) = 0.504, P = 0.986), and river discharge (F (29, 324) = 0.607, P = 0.947) in Makurdi (Table 2).
Decadal variations: Similarly, there was no significant decadal variations in rainfall (F (2, 27) = 1.474 P = 0.247) water level (F (2, 27) = 0.414, P = 0.665), and river discharge (F (2, 27) = 2.502, P = 0.101) in Makurdi (Table 3).
The result reveals that rainfall does not significantly correlate with water level ( r = -0.161, n = 30, p = 0.395) and river discharge ( r = -0.069, n = 30, p = 0.715). Also, there was no significant correlation between water level and river discharge ( r = 0.329, n = 30, p < 0.076) (Table 4).
Implications of rainfall amount, river water level and discharge variability on flooding in parts of Makurdi Metropolis
This study shows rainfall amounts in months that can be categorized into four. The first category include months with amount that ranges between 200 mm and 350 mm as above (for all categories) occurred mostly in some or all of the months of July, August, September and probably October. This heavy rainfall at this particular period may result in the inundation of flood plains close to the River valley and onto several areas of the metropolis. This situation may indicate the likelihood that the magnitude, scope and depth of the flood water during this period may be above the seasonal average. The high amount of rainfall also during this period usually results in the increase in water level and the rate of discharge being very high above the seasonal average. This high amount of rainfall and the accompanying high water level and discharge usually have devastating implications for human beings and the environment and human activities in the study areas of the metropolis [2]. This situation in association with other factors such as topography during this period determine the duration of floods. During the entire period of study, the three variables evaluated rainfall amount; water level and discharge vary from one month to another that dovetailed into their variations during other study periods such as five years and decades. This persistent variation suggests the need for continual studies about these attributes of floods in order to be able to combat floods and its attendant implications.
Conclusion
This study evaluated the most important factors affecting flood events in Makurdi which includes: rainfall amount and patterns, river water level and discharge. The study observed a clear variation of these variables over months, periods, season and decades. The study observed an increase in extremes rain events especially in the months of August, September and October which triggers floods of high magnitude in the region. This suggests serious implications for the extent, intensity, duration and depth of floods in Makurdi Metropolis. The rates of these attributes of flood although may be high and possibly contributed to its occurrence, however historical records of floods indicates that these attributes may not be the only factors responsible. This highlights the need for evaluation of other factors such as urban planning and other anthropogenic factors in coming up with a better solution and mitigation strategies for this persistent flood problem in Makurdi metropolis.
Acknowledgement
We acknowledge the Tetfund, Abuja for providing funding, Nimet and Nigeria inland water ways for providing meteorological and river discharge data respectively. We thank also the reviewers whose extensive review and edits greatly improved the paper.