Application of Aeromagnetic Data Analysis and Interpretations to Investigate Solid Mineral Potential in Part of Northwest Nigeria

International Journal of Earth Science and Geophysics
(ISSN: 2631-5033)
Volume 8, Issue 1
Research Article
DOI: 10.35840/2631-5033/7557

Article Formats
Application of Aeromagnetic Data Analysis and Interpretations to Investigate Solid Mineral Potential in Part of Northwest Nigeria
Table of Content
Figures
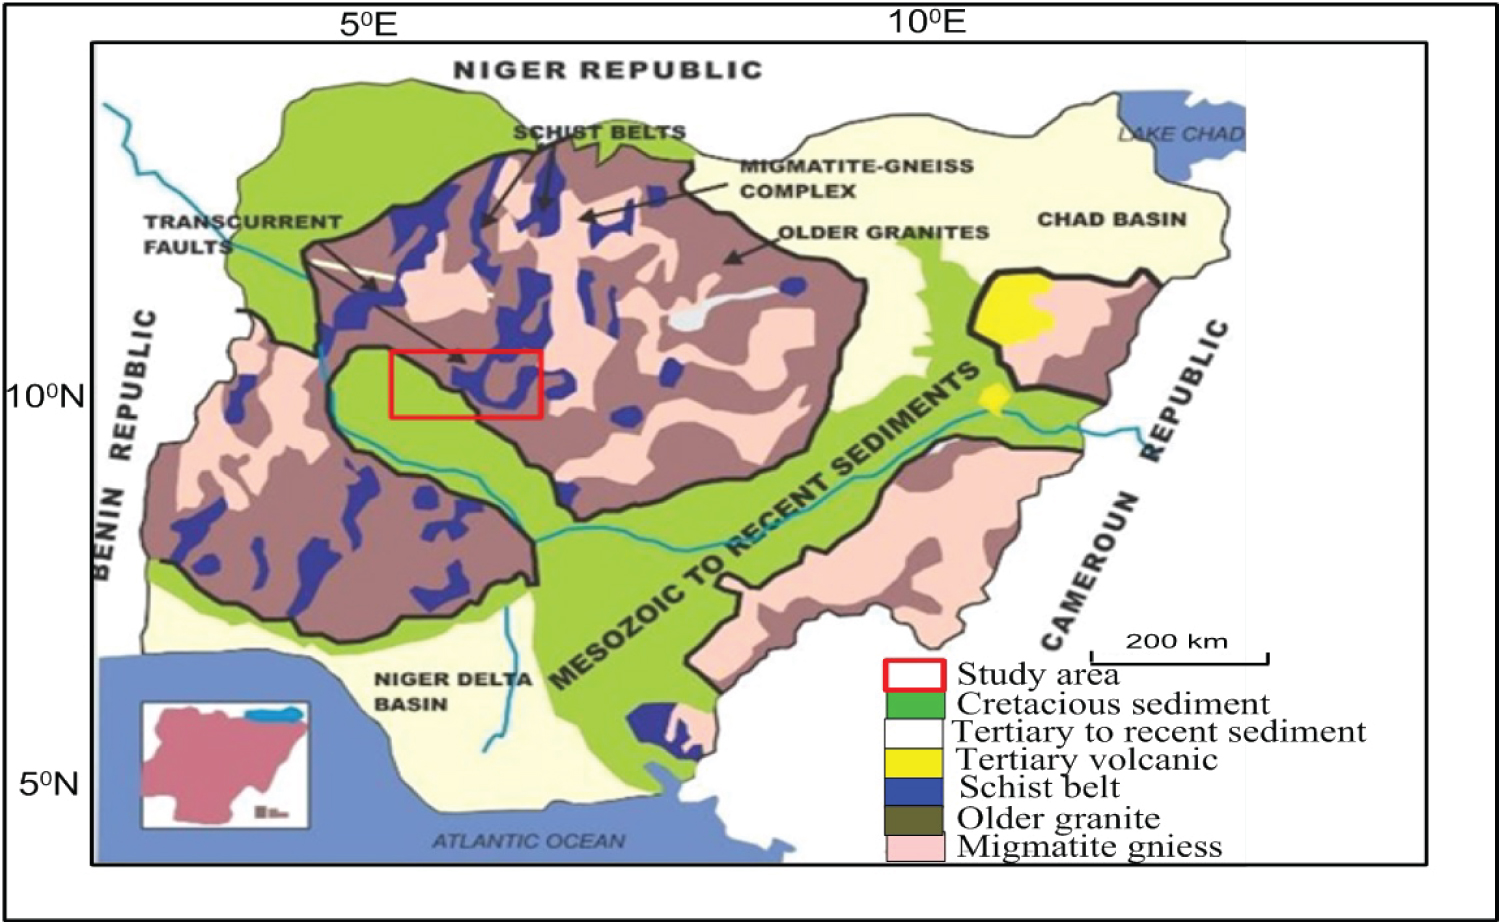
Figure 1: Geologic map of Nigeria Showing...
Geologic map of Nigeria Showing the Schist belt and location of the study area [7].
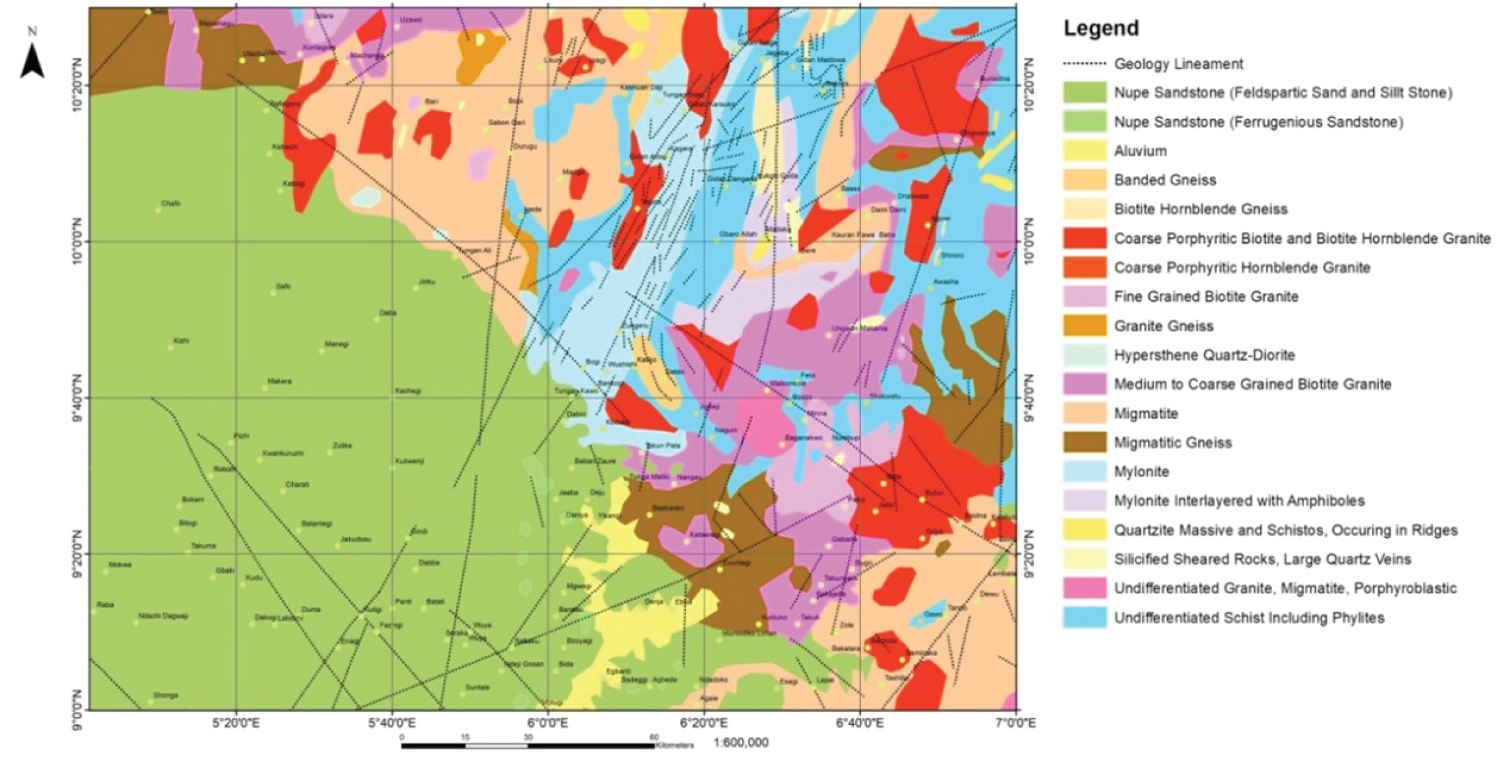
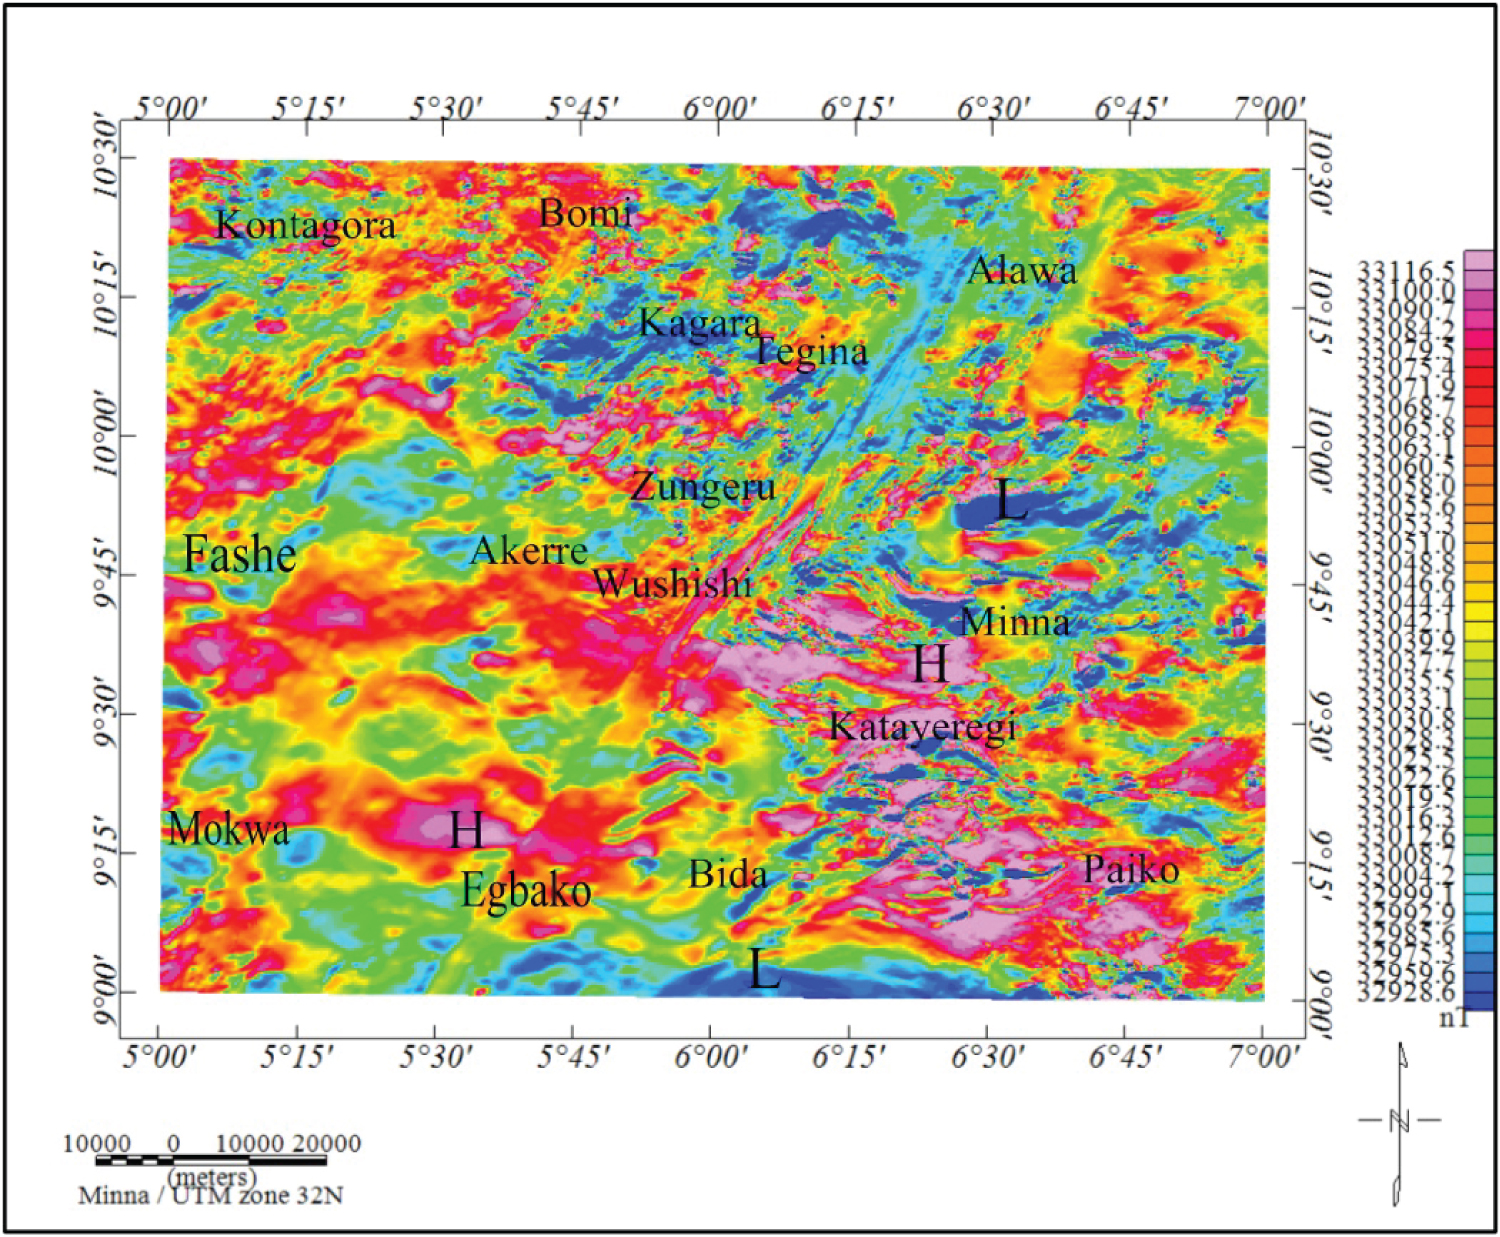
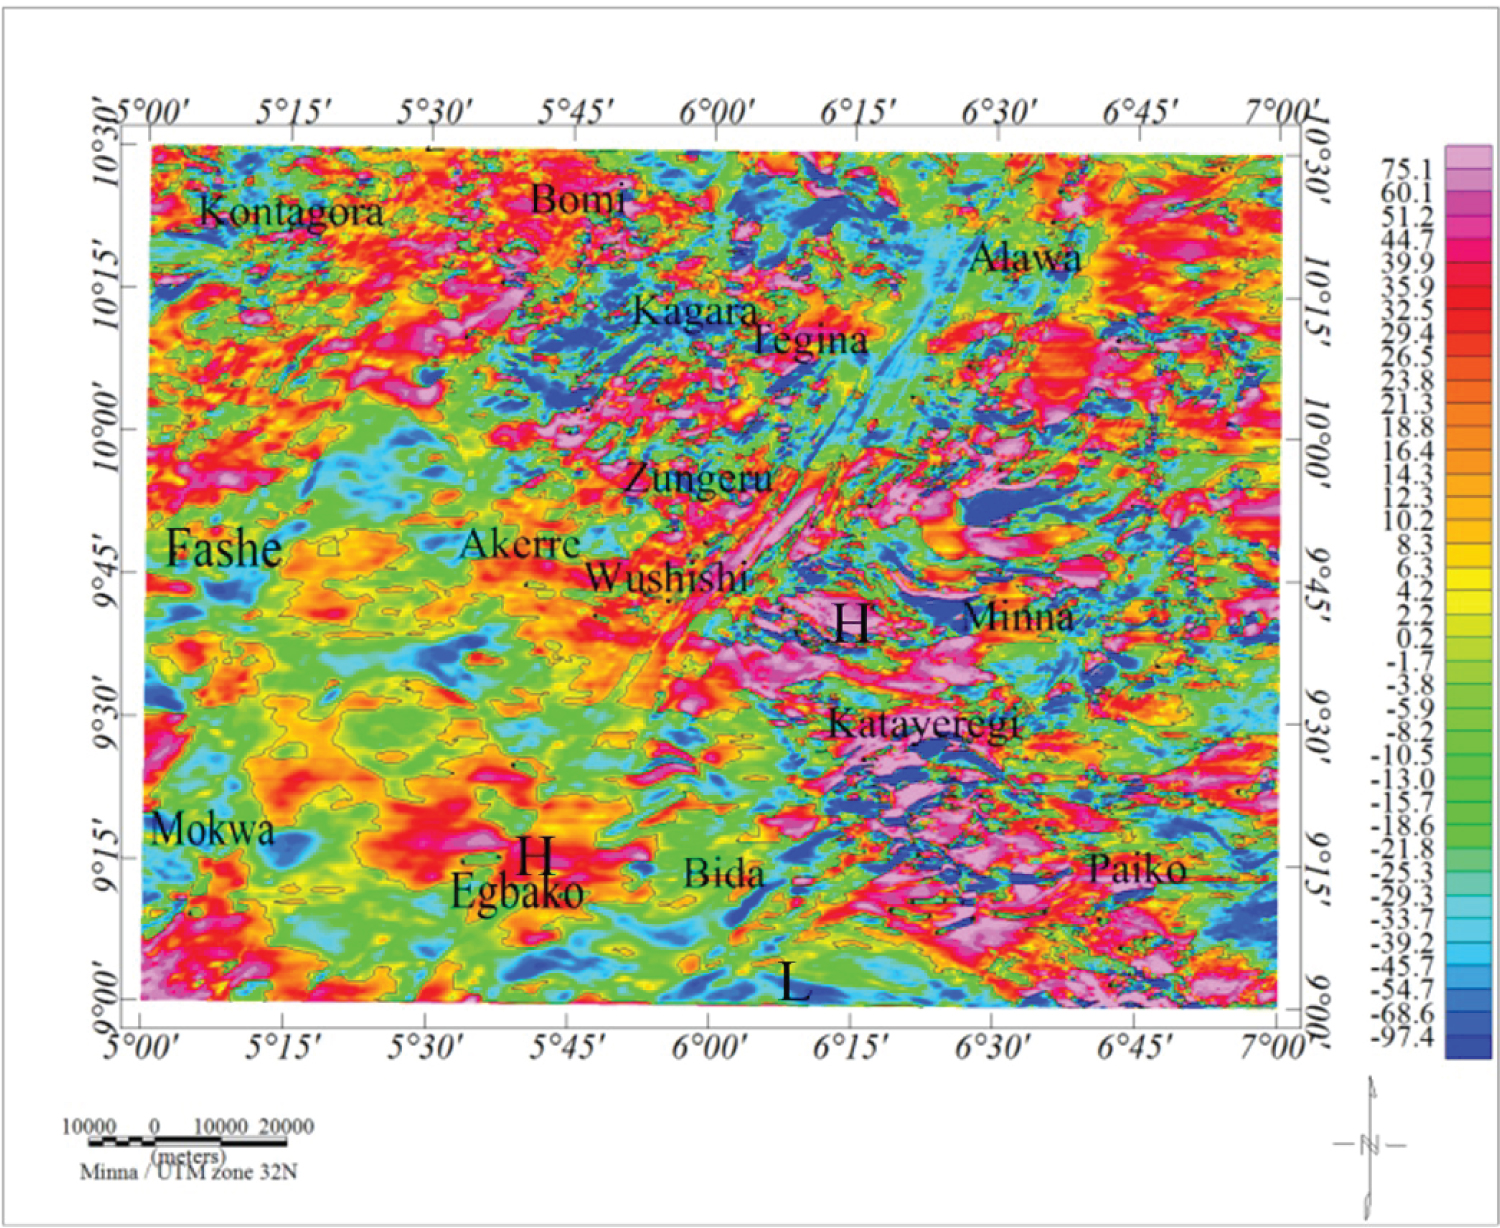
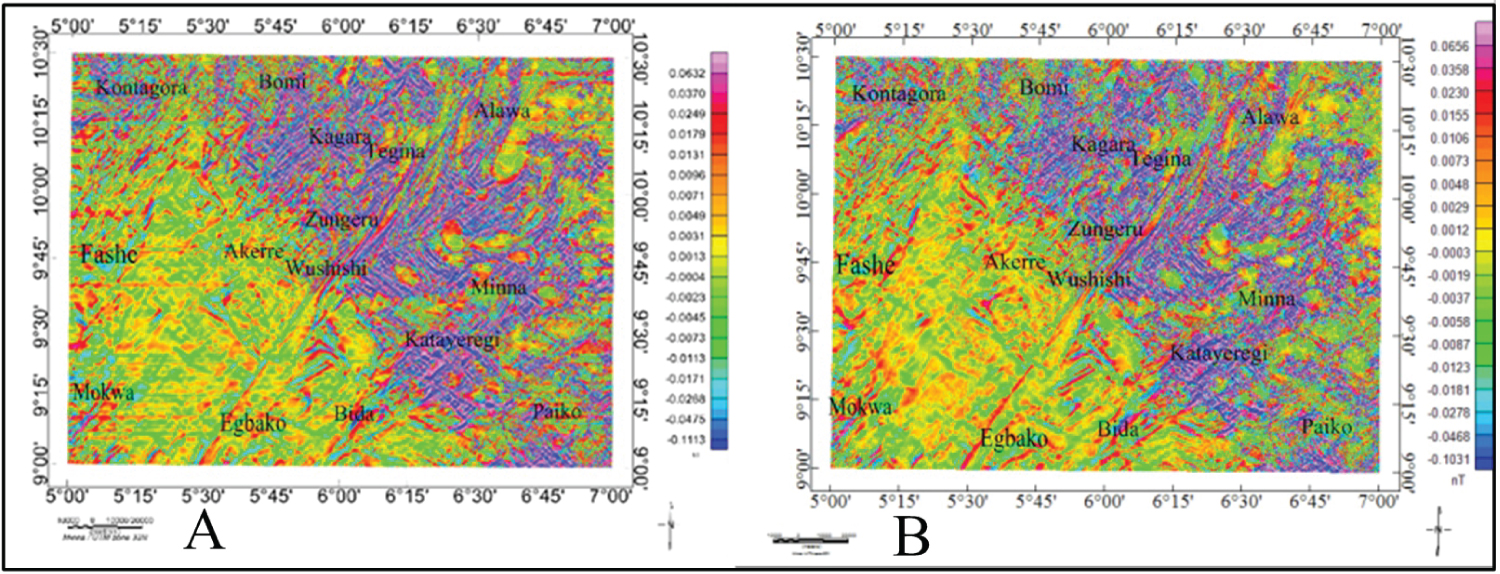
Figure 5: A) First vertical derivative....
A) First vertical derivative m and B) Horizontal derivative map of the study area.
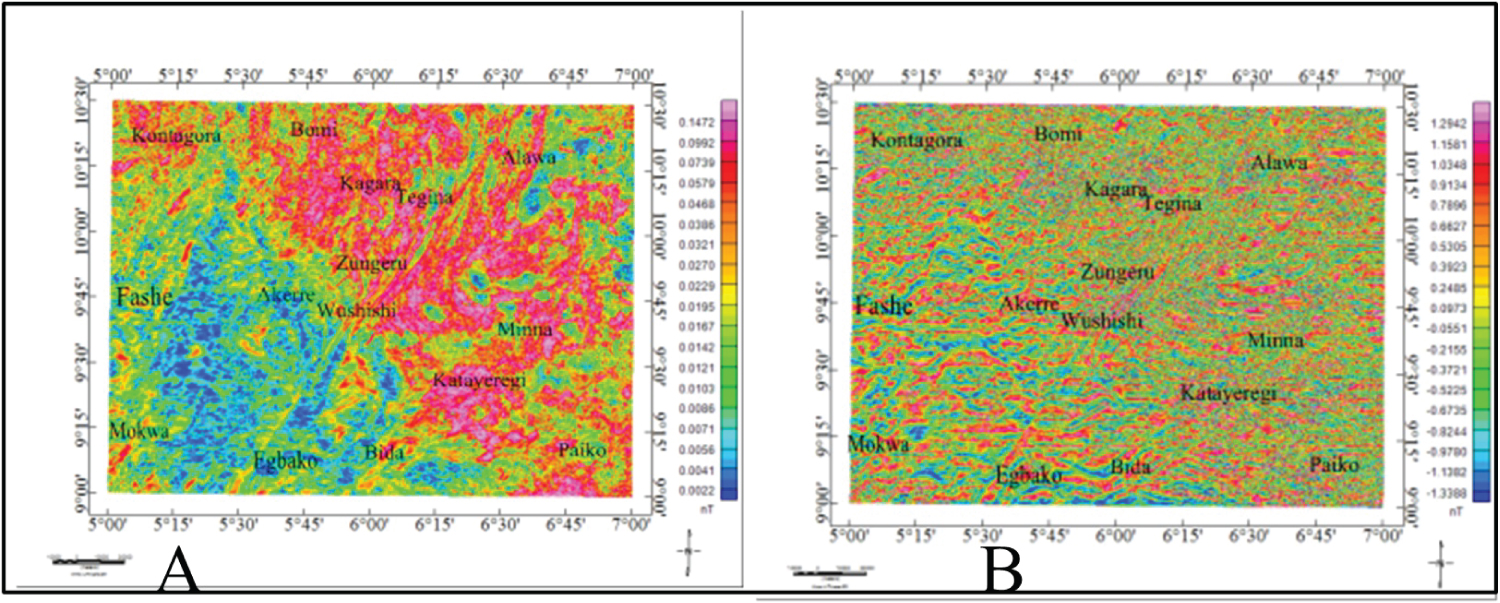
Figure 6: A) Analytic signal map and....
A) Analytic signal map and B) Tilt derivative map of the study area.
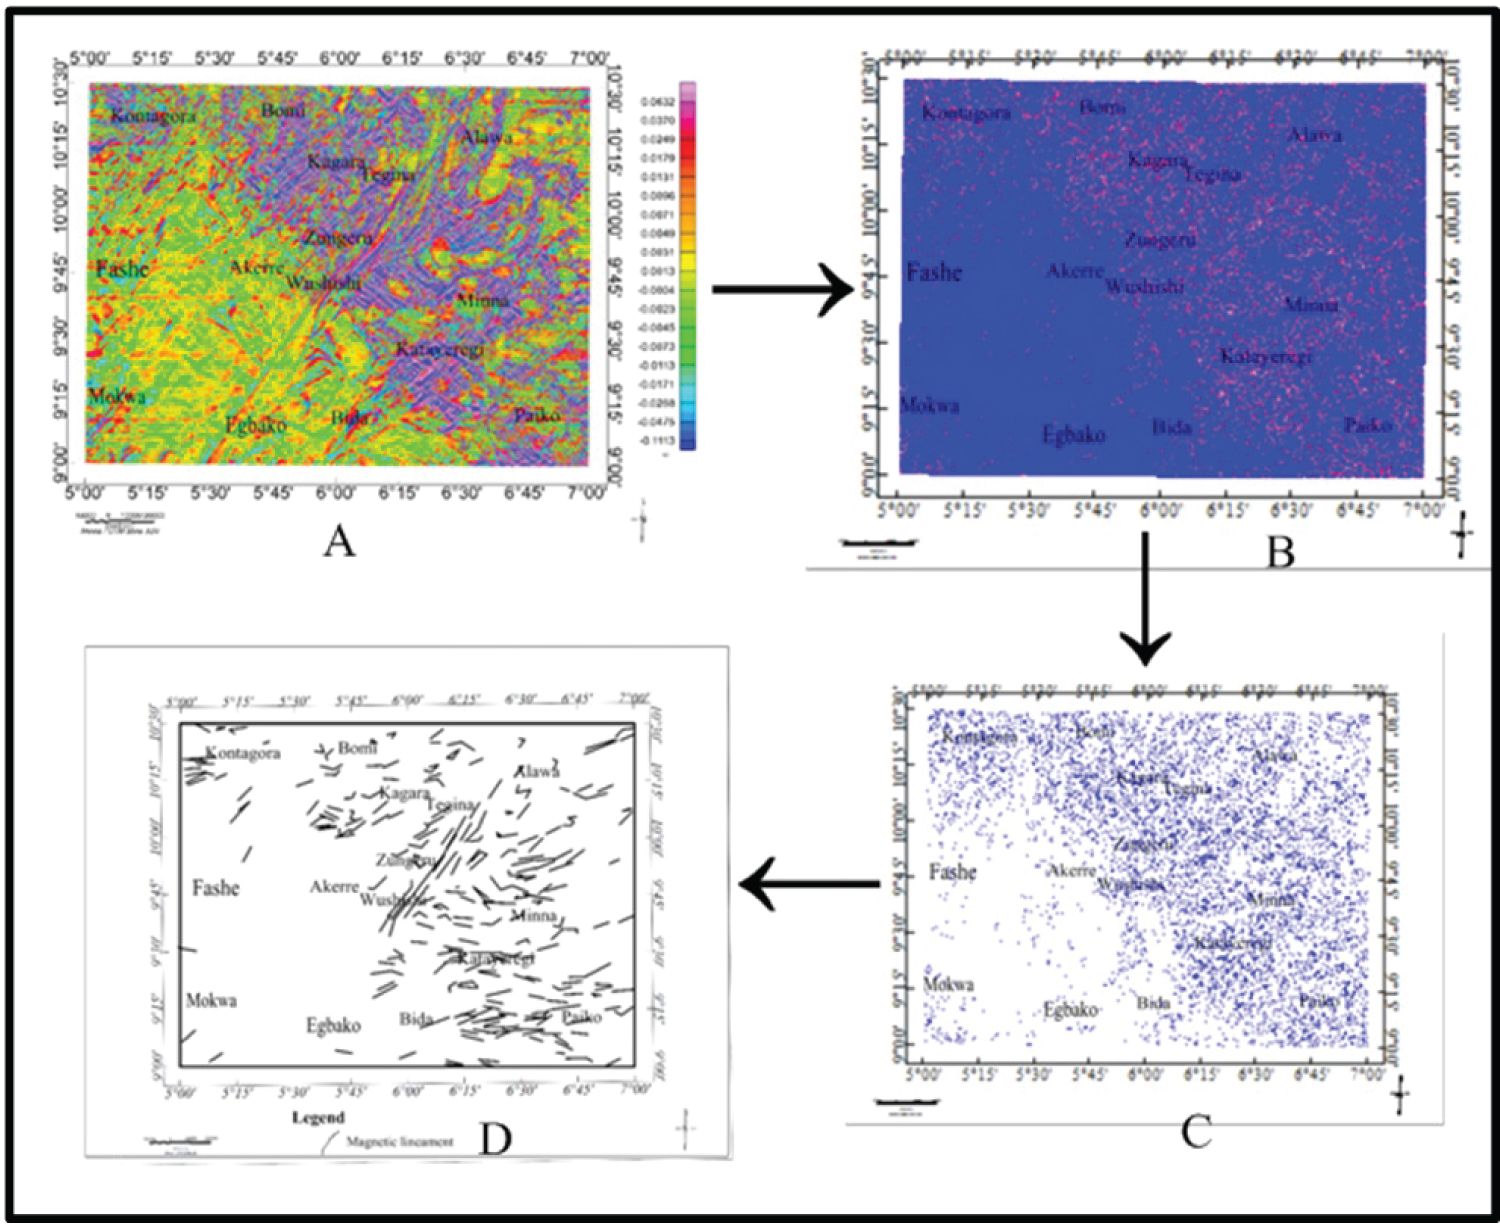
Figure 7: Brief stages among CET anlysis....
Brief stages among CET anlysis. A) FVD grid; B) Phase congruency; C) amplitude threshold and D) CET result (magnetic structures from FVD).
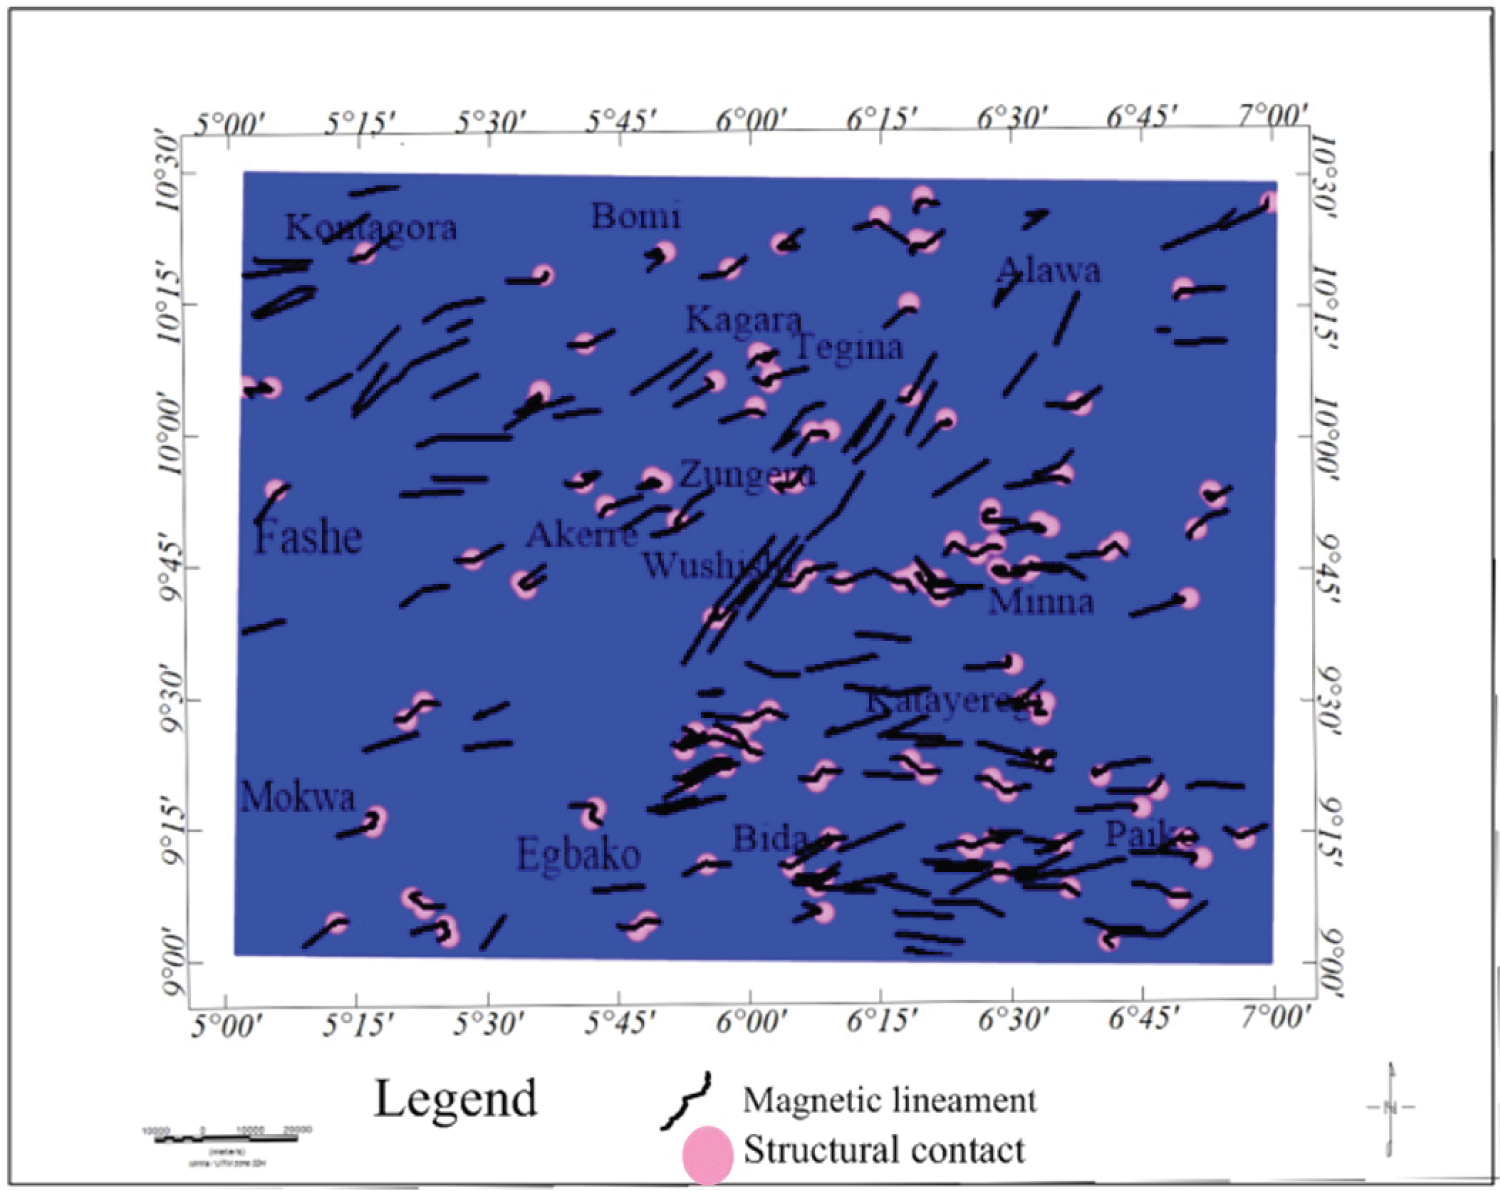
Figure 8: Structural contact map from....
Structural contact map from tilt derivative of the study area.

Figure 9: Composite structural map showing...
Composite structural map showing the active and potential areas of mineralization within the study area.
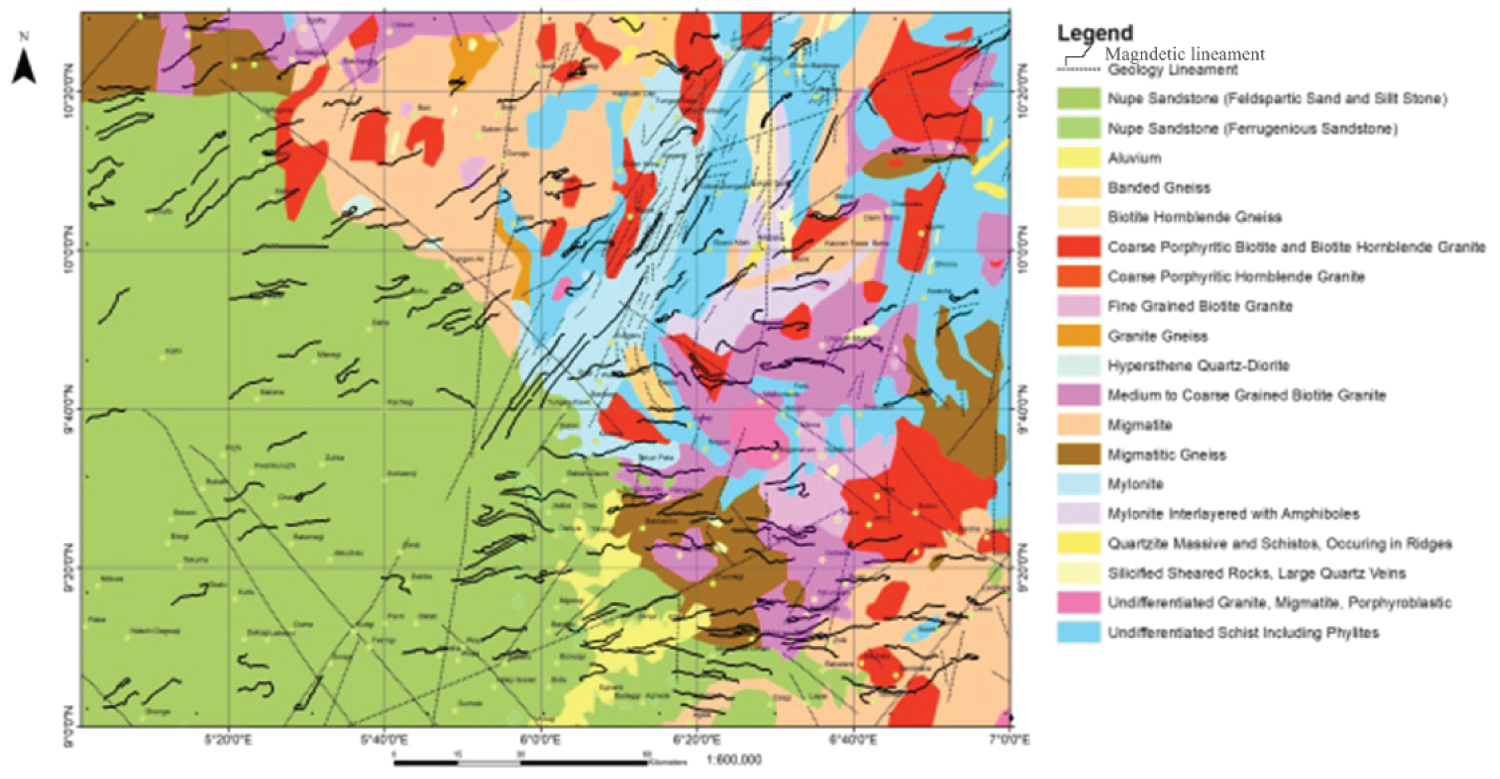
Figure 10: Structural map superimposed...
Structural map superimposed on the geologic map of the study area.
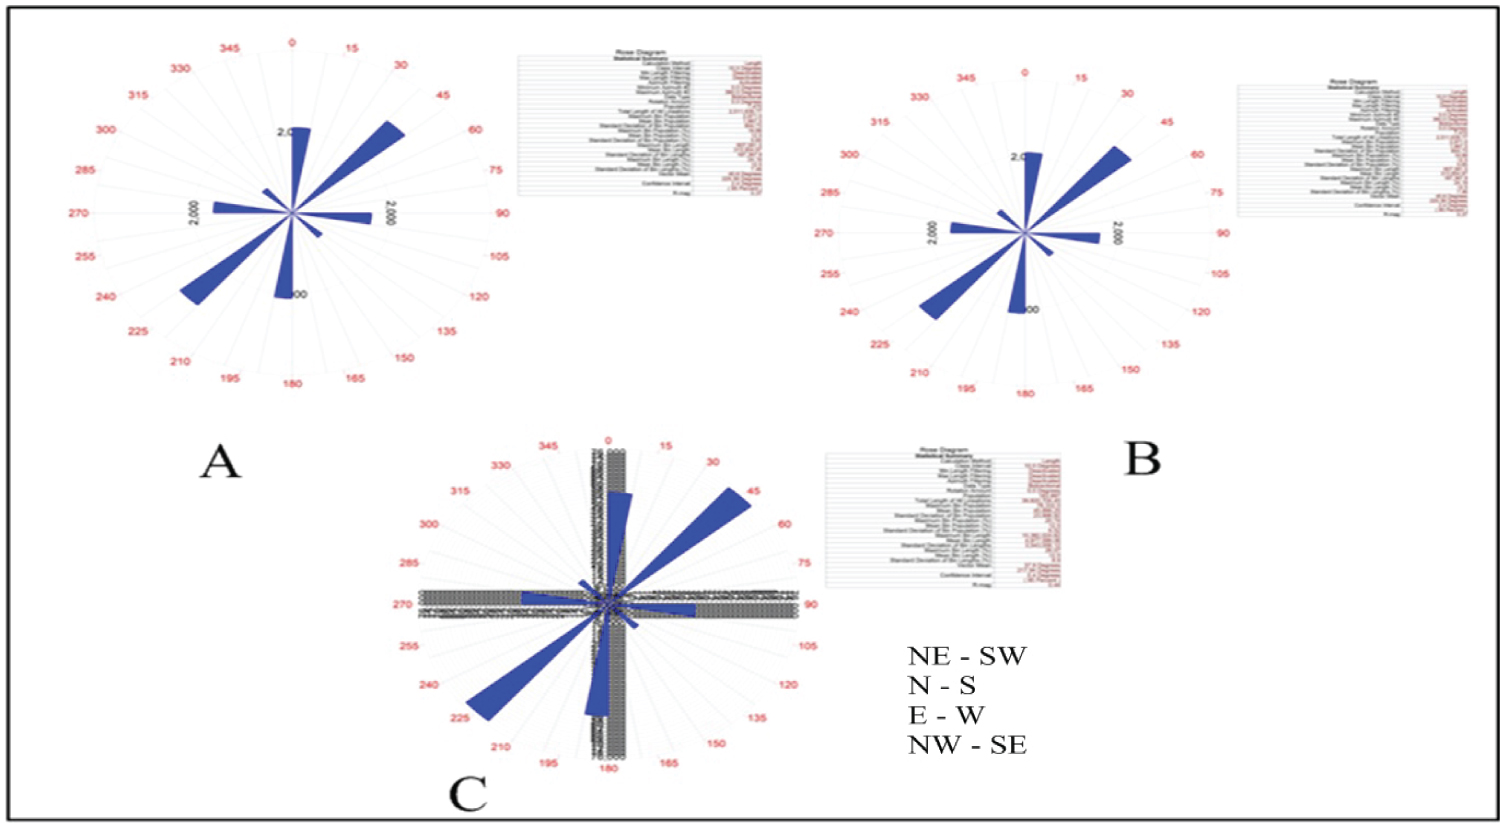
Figure 11: A) Polar plot for the first...
A) Polar plot for the first vertical derivative; B) Horizontal derivative and C) Tilt derivative magnetic structures.
References
- Ekwueme BN, Matheis G (1995) Geochemistry and economic value of pegmatites in the Precambrian basement of southeastern Nigeria. Oxford & IBH Publishing Company, New Delhi, India.
- Solomon T (2004) Genesis of the shear zone-related gold vein mineralization of the Lega Dembi gold deposit, Adola gold field, Southern Ethiopia. Gondwana Research 7: 481-488.
- Usman AO, Ezeh CC, Chinwuko IA (2018) Integration of aeromagnetic interpretation and induced polarization methods in delineating mineral deposits and basement configuration within Southern Bida Basin, North-West Nigeria. J Geol Geophys 7: 1-13.
- Tawey MD, Alhassan DU, Adetona AA, Salako KA, Rafiu AA, et al. (2020) Application of aeromagnetic data to assess the structures and solid mineral potentials in part of North Central Nigeria. Journal of Geography, Environment and Earth Science International 24: 11-29.
- Ho SE, Groves DI (1987) Recent advances in understanding Precambrian Gold Deposits. Geology Department and University Extension, University of Western, Australia Publication.
- Sanusi YA, Dahiru D (2017) Analysis of surface and magnetic lineament in and around Wase area, Northen Nigeria. Journal of Applied Geology and Geophysics 5: 52-62.
- Obaje NG (2009) Geology and mineral resources of Nigeria. Springer publishers, Germany, 1- 203.
- Ministry for Mines and Steel Development (2017) Nigeria mining week report.
- Salau SL, Danbatta UA, Agunleti YS (2016) The Interpretation of aeromagnetic and satellite imagery for structures in coincident with Gold mineralization in Anka Schist Belt, Northwestern Nigeria. Journal of Applied Geology and Geophysics 4: 29-34.
- Akame JM, Assembe SP, Zoo ZP, Owana S, Ndougsa MI, et al. (2019) The Sangmelima granite-greenstone belts (South Cameroon): Integration of remote sensing and aeromagnetic data for structural interpretation. The Egyptian Journal of Remote Sensing and Space Sciences 22: 37-47.
- Li X (2006) Understanding 3D analytic signal amplitude. Geophysics 71: B13-B16.
- Muzaffeer OA, Unal D (2013) Edge detection of magnetic source, using enhanced total horizontal derivative of the tilt angle. Bulletin of the Earth Science Application and Research Center of Hacettepe University 34: 73-82.
- Eun-Jung H, Kovesi P, Dentith M, Wedge D, Wong JC, et al. (2010) Detection of regions of structural complexity within aeromagnetic data using image analysis. Twenty Fifth International Conference of Image and Vision Computing, IEEE, New Zealand.
- Udensi EE, Osazuwa IB (2002) Two and half dimensional modelling of the major structures underlying the Nupe Basin, Nigeria using aeromagnetic data. Nigeria Journal of Physics 14: 55-61.
- Maigwara JU, Udensi EE (2014) Lineament study using aeromagnetic data overparts of southern Bida Basin, Nigeria and the surrounding basement rocks. International Journal of Basic and Applied Sciences 2: 115-124.
- Haruna IV, Ahmed HA, Ahmed AS (2012) Uranium favourability study in an area around Pantishawa, Adamawa Massif, northeast. Nigeria. International Journal of Scientific Research 2: 125-131.
- Ajibade AC (1980) Geotectonic evolution of the Zungeru region. Ph.D Thesis, University College of Wales, Unpublished.
- Udensi EE, Ojo SB, Ajakaiye DE (1986) A-three dimensional interpretation of the bouguer anomalies over the minna batholith in central Nigeria. Precambrin Res 32: 1-15.
- Ajibade AC, Fitches WR (1988) The Nigerian Precambrian and the Pan-African Orogeny. Precambrian Geology of Nigeria 45-53.
- Udensi EE, Osazuwa IB, Daniyan MA (2003) Trend analysis of the total magnetic field over the Bida Basin, Nigeria. Nigerian Journal of Physics 15: 143-151.
- Kerrich R, Wyman D (1990) Geodynamic setting of mesothermal gold deposits: An association with tectonic regimes. Geology 18: 882-885.
- Kuster D (1990) Rare metal pegmatites of Wamba, Central Nigeria-their formation in relation to late, Pan-African granites. Mineral Deposita 25: 25-33.
- Nigeria Geological Survey Agency (2010) Index map of airborne survey blocks flown between 2003-2010 by Fugro Airborne services.
- Grauch VJS, Bauser PW, Kelson KI (2004) Preliminery interpretation of high resolution aeromagnetic data collected near Taos, New Mexico. New Mexico Geological Society Guide book, Field Conference, Geology of the Taos Reg, 244-256.
- Omowumi A (2017) Aeromagnetic characterization of parts of Ondo and Ekiti States, Southwestern Nigeria. Journal of Environmental and Earth Sciences 4: 66-75.
- Dobrin (1976) Introduction to geophysical prospecting. (3rd edn), McGraw - hill book Company. New York, USA.
- Telford NW, Geldart LP, Sheriff RS, Keys DA (1990) Applied geophysics. (2nd edn), Cambridge University Press, Cambridge, USA, 55-57.
- Hsu NC, Herman JR, Bhartia PK, Seftor CJ, Torres O, et al. (1996) Detection of biomass burning smoke from TOMS measurements. Geophysics Research Letters 23: 745-748.
- Blakely RJ (1995) Potential Field theory in gravity and magnetic applications. Cambridge University Press, USA, 441.
- Cordel L, Grauch VJS (1985) Mapping basement magnetization zones from aeromagnetic data in the San Juan basin, New Mexico. The Utility of Regional Gravity and Magnetic Anomaly Maps.
- Nabighian MN (1972) The analytic signal of two dimensional magnetic bodies with polygonal cross-section. Its properties and use for automated anomaly interpretation. Geophysics 37: 507-517.
- Roest WR, Verhoef J, Pilkington M (1992) Magnetic interpretation using the 3-D analytic signal. Geophysics 57: 116-125.
- Peter K (1991) Image features from phase congruency. Videre: Journal of Computer Vision Research, MIT Press.
- Okunlola OA (2008) Deformation and mineralization in the basement of Nigeria. Geology of African development strategies for Mining sectors of African countries. Proceedings Paper at International Geological Congress-Oslo.
- Biswas A, Mandal A, Sharma SP, Mohanty WK (2014) Integrating apparent conductance in resistivity sounding to constrain 2D gravity modeling for subsurface structure associated with uranium mineralization across South Perulia Shear zone. International Journal of Geophysics 2014: 1- 8.
- Kankara IA, Darma MR (2016) A review of gold metallurgeny in Nigeria. IJRCMCE 3 293-299.
- Nigeria Geological Survey Agency (2006) Geology map of the study area.
Author Details
Abubakar Nda'asabe Dzukogi*, Yusuf Abubakar Sanusi, Sabiu Bala Mohammad and Abubakar Roko
Usmanu Danfodiyo University Sokoto, Nigeria
Corresponding author
Abubakar Nda'asabe Dzukogi, Usmanu Danfodiyo University Sokoto, Nigeria.
Accepted: March 03, 2022 | Published Online: March 05, 2022
Citation: Dzukogi AN, Sanusi YA, Mohammad SB, Roko A (2022) Application of Aeromagnetic Data Analysis and Interpretations to Investigate Solid Mineral Potential in Part of Northwest Nigeria. Int J Earth Sci Geophys 8:057.
Copyright: © 2022 Dzukogi AN, et al. This This is an open-access article distributed under the terms of the Creative Commons Attribution License, which permits unrestricted use, distribution, and reproduction in any medium, provided the original author and source are credited.
Abstract
Investigation of structures was carryout to identify and delineate potential areas for mineralization within part of northwest Nigeria. Aeromagnetic data covering this area were analyzed and interpreted using different methods for mineralized geologic structures. The total magnetic field data covering this area was reduced to magnetic equator after which several methods and interpretation including, first vertical derivative; horizontal derivative; tilt derivative; analytic signal and center for exploration targeting were applied to the aeromagnetic data. The maxima from FVD, THD and TDR anomalies were used to delineate the magnetic geologic structures using center for exploration analysis technique. The geologic structures with maxima ASA in the SE, Central region and NW parts were the mineralized structures in the study area. These regions correspond with structural contact areas and were identified as structural contact from first vertical, horizontal and tilt derivatives analyses. These magnetic structures and structural contacts were integrated to produce structural map of the study. The structural contacts were predominant at the SE, central region, NW and NE part of the study area. The trend of these structures were in the NE-SW, N-S, E-W and NW-SE made up during Pre-Pan African and Pan African event. Key words: Geologic; structures; mineralization; veins; enhancement; intrusion
Introduction
Solid minerals such as Gold, Tantalite, Saphaire, Silver, Iron, and Quartz are formed from the intrusion and crystallization of hydrothermal fluid within the joints, fracture and fault in the basement rocks. During crystallization, the interaction of magmatic fluids with suitable wall rocks or structures causes solid mineral deposition. Thus, these minerals are associated with basement rocks of Nigeria [1-4]. Basement rock consists of different types of rocks hosting solid minerals, these rocks are Gneise, schists, phyllites, quartzite, amphibolite and granitic intrusions. This imply that the regional and local mineralization are mainly structural, made up of a system of faults and other structures of Pan African age [5,6].
There are many solid mineral deposits in the northwest and central Nigeria, specifically in Niger state [7,8]. Several studies [3,9] have been conducted to delineate the potential areas of mineral deposits using magnetic methods in the surrounding parts of this research area [3,9]. 37 used four aeromagnetic data sheets to delineate potential areas of solid mineral deposits in southern part of Bida basin using high resolution aeromagnetic and induced polarization methods. Variations in magnetic values (anomalies) from magnetic methods were used to delineate potential areas of mineral deposits. The high magnetic values of some rocks and areas of low sedimentary thickness in his research suggest the presence of oolitic iron ore mineral. Other potential areas of solid minerals such as Gold, Tantalite, Enraraid, Saphaire, and Silver do not occur or associated in southern part of Bida basin. While 29 used aeromagnetic data interpretation and satellite imagery to delineate structures in coincident with Gold mineralization in Anka schist belt of northwestern Nigeria. Specifically, the magnetic method was derivatives and analytic signal to delineate anomaly zone in relation to Gold occurrence in the schist belt of northwestern Nigeria. These methods only identify magnetic anomaly zones but do not delineate exploration targeting point and magnetic mineral veins which are important regions for mineral deposit.
Reduction to magnetic pole, upward continuation filters, analytic signal, first vertical derivative, horizontal derivative and tilt derivatives methods are useful in identifying different magnetic minerals associated with basement rocks in part of north central Nigeria [4]. Magnetic zones with high amplitudes are associated with later magmatic intrusions into the host rocks with fracture, faults and joints [3,4]. Magnetic methods are useful in mapping new possible small greenstone belt and structural features like lineaments from the derivatives interpreted as fracture and fault zones in Sangmelina granite-greenstone belt, South Cameroon [10]. The major strike - slip fault identified were trending northeast - southwest, east - west, northwest - southeast respectively. The observed mafic dykes trending in these directions and the field evidence suggest an intrusion into the pre-existing structures [3,4,10]. Many fractures and faults have been originated during previous deformation phases and were only reactivated during Pan-African events [10].
Therefore, this study used 12 aeromagnetic data sheets with total area of 36,300 km2 to delineate substantial amount of potential areas of solid mineral deposits in part of Niger state, using several methods on magnetic data. Specifically, derivatives, analytic signal methods and center for exploration targeting (CET) analysis were applied to magnetic data covering the study area to identify exploration point, update the existing mineral veins and identify new mineralized zones and potential areas of solid mineral. This will guide further mining and exploration studies in the area. The delineation of potential areas for solid minerals serves as an update on the identified mineral map of Nigeria. It will also serve as a template for mining program and reduce the cost effect of direct exploration in the research area by knowing the potential areas for mineral deposit. The result of this research serve as information for further research work by providing updates on the solid mineral deposit and geology of the study area.
The aim of this research study is to use several methods in magnetic to delineate potential areas of solid mineral deposit. This was achieved through the following objectives: Update and identify new potential areas of solid mineral deposit through enhancement of shallow and deep seated anomalies using derivative methods. Identify mineral zones through analytic signal methods. Identify exploration point (mineral veins/lineaments). Infer an integrated structural map of the study area.
Magnetic data mostly analyzed and processed using reduction to equator (RTE) filter to obtained RTE data which was further separated using polynomial method to obtain regional and residual magnetic data. The residual magnetic data was further analyzed using first vertical derivative to identify shallow geologic structures. The horizontal derivative produced lateral shallow and deep geologic structures. The analytic signal combines the vertical and horizontal derivatives to produce susceptibility contrast of magnetic structures. The Analytic signal peaks directly over the source anomaly and it is independent of the direction of magnetization [11]. The tilt derivative responds well to both shallow and deep seated magnetic structures [12]. Center for exploration targeting (CET) analysis was used to produce linear magnetic structures (mineral veins) and structural contacts [13]. The structural map of the study area was produced by integration of geologic magnetic structures and their structural contacts (mineralization zones) in the study area.
The result discussion and interpretation of the magnetic data were based on the observations made from the analysis to improve the description of the structural configuration of rocks on the ground that give rise to the subtle magnetic anomalies. Lineaments of exposed, poorly exposed and unexposed areas were described, including their limit to location, and areal extent was interpreted. These geologic structures caused the subtle magnetic anomaly.
Geologic Setting of the Study Area
The study area, fall within the central part of the Northwest Nigeria bounded by longitude 5° 00′ E - 7° 00′ E and latitude 9° 00′ N - 10° 30′ N (Figure 1 and Figure 2). These area can be viewed in terms of two principal lithologic units, the oldest unit consists of Precambrian Basement rocks at the north-east, south-east, and Northwestern part of the study area and the second unit consists of Cretaceous to recent sedimentary rocks (sandstone, silt and clay) of Bida basin which overlie the Precambrian basement unconformable at the southwestern part of the study area (Figure 2). The Cretaceous sediment was dipping to the southwest reaching a thickness of 1.72 km and 3.24 km [3,14,15]. The Cretaceous to recent sediment of the study area consist of Sakpe iron stone formation, Enagi silt stone, Batati iron stone and Bida formation.
The schist belt (metasediment and metavolcanic) that overlie the basement rocks of Nigeria were predominant in the northeast and few in the northwest and central part of the study area. The schist belt was intruded by fine to coarse grain granite rocks (Figure 2). The schist belts boundaries have been described as metamorphic fronts, Mylonite and rift bounding faults [16]. These basement rocks were characterized by granite to granodiorite and amphibolite rocks [17,18]. The basement complex of north central Nigeria has heterogeneous assemblage, these include migmatites, gneisses, schists and series of basic to ultrabasic metamorphosed rocks. Granitic rocks and gneisses cut across one another and are characterized with coarse texture. Geometrically they occur as dykes, sill lenses and phenocryst [17]. The deep seated fault in the basement complex resulted from the thermotectonic deformational event, mostly of the Eburnean and pan-African orogeny [19].
The major structural trend in the basement is essentially northeast - southwest, north - south, east - west and northwest - southeast follows the tectonic grain of the schist belt [20]. The study area is bounded at the southwest and south east by the Cretaceous sediment of Nupe Basin. The regional fault systems have been suggested to be Pan African crustal structures [21]. Such fault systems are characteristic of geothermal Gold deposit worldwide [1]. Geothermal Gold deposits are spatially related to regional lineaments [22].
Minerals are combination of one or more earth element, although some minerals for example Gold has single element in composition such minerals are known as native element/minerals. During the formation of a mineral, the element needed to make a particular mineral must be present in the appropriate proportions, the physical and chemical conditions must also be favorable, and there must be sufficient time for the atoms to be arranged. Mineralization in the basement such as iron ore, gold vein emplacements are generally confined within the north - south, NE - SW, NNE - SSW brittle structures. 25 observed that the principal fracture directions in the basement complex of Nigeria are N - S, NNE - SSW, NNW - SSE, NW - SE and to a lesser extent east - west where the north - south fractures are marked by considerable shearing.
Materials and Methods
Materials
Aeromagnetic data covering the study area were obtained from Nigeria Geological Survey Agency [23]. The data were acquired by Fugro airborne services on behalf of Federal Government of Nigeria between 2003 and 2010. The data were flown at mean terrain clearance of 80 meters, aero profile spacing of 500 meters along NW - SE flight lines across specified trend of the regional structures in the area. Other materials used in this study include: Oasis montaj version 8.3, Geomatic, Arc GIS, Geomatica, Rock work, Global Positioning Satellite (GPS) and Surfer 11.
Method
Reduction to Equator (RTE): Reduction to equator (RTE) filter is applied to magnetic data to align the peaks of magnetic anomalies with the center of magnetic sources. The RTE filter is mathematically expressed as [24,25]:
RTE = sin I + icos I sin (D - θ)2
Where I is the geomagnetic inclination, D geomagnetic declination, sin I is the amplitude component, and icos I sin (D - θ)2 is the phase component.
In this study, total magnetic field data were converted to RTE anomaly data using the inclination of -4.234° and declination of -2.102° determined at the midpoint of the study area.
Regional Residual separation: The total magnetic intensity (TMI) field comprises of the regional and residual magnetic anomaly fields. The regional magnetic field reflects the magnetic effects of the core while the residual magnetic anomaly field reflects the magnetic effect of the crustal rocks. The regional and residual magnetic field components need to be separated for effective analysis of magnetic data emanating from the crustal rocks. The regional field in this study was modeled as a plane surface, using polynomial fitting method, and removed from TMI values to obtain the residual magnetic anomaly field data [26,27]. The residual magnetic field data obtained were used for further analysis and interpretations of the magnetic data.
First vertical derivative: First vertical derivative (FVD) is often applied on the residual magnetic data to sharpen and enhanced shallow magnetic anomalies [28]. Therefore, the FVD map tends to give a sharper image than the residual magnetic field map. The FVD filter is expressed as [28]
Where, T is the potential field anomaly.
Computing FVD values involves fast Fourier transformation (FFT) of the residual magnetic field intensity values into frequency domain, using FFT method. The fast Fourier transformed data were then multiplied with a first vertical derivative filter (Kn) [29], where k is the wave number in the frequency domain, and n is the order of the filter which is unity for FVD [29]. The product obtained is transformed back to the space domain to obtain the FVD values.
Total Horizontal Derivative (THD): The total horizontal derivative (THD) is often applied in locating the edges of the magnetic sources [30]. The main advantage of this method is that it is relatively less sensitive to noise in the magnetic dataset since it involves calculation of only first-order horizontal derivatives of the magnetic field [30]. The THD filter which is used to detect the edges of subtle shallow and deep vertical magnetic contacts in this study can be expressed as [30].
Where T is the potential field anomaly
Computing THD values involves FFT of the residual magnetic field values into frequency domain, using (FFT) method. The fast Fourier transformed data are then multiplied with the THD filter equation (2) in the frequency domain. The product obtained is transformed back to the space domain to obtain the THD values [29].
Analytic signal: The analytic signal of magnetic anomalies is defined as a complex field deriving from a complex potential [31]. The analytic signal amplitude (ASA) highlights the susceptibility contrast of the subsurface rocks [32]. The main advantage of this method is that, its amplitude peaks directly over the source and it is independent of the direction of magnetization for 2D cases and largely independent for 3-D bodies [11,32]. The 3D analytical signal amplitude can be computed from gradients along x, y and z directions using the relation [32].
Computing the ASA values involves FFT of the residual magnetic field values into frequency domain, using FFT method. The fast Fourier transformed data are multiplied with the ASA filter equation (3) in the frequency domain. The product obtained is transformed back to the space domain to obtain the ASA values, the resulting sum is always positive [32].
Tilt derivative: The tilt derivative is often applied on the residual data to observe deep seated geologic features/structures in the area. The tilt angle function like an automatic gain control filter and therefore respond equally well to shallow and deep sources [12]. The Tilt angle is defined as the ratio of the vertical derivative to the absolute value of the horizontal derivative of the magnetic field and is expressed as [12]:
The tilt angle is always within the range of -π/2 ˂ Tilt > π/2.
The tilt derivative (TDR) value is computed by FFT of the residual magnetic field values into frequency domain, using FFT method. The fast Fourier transformed data are then multiplied with a TDR filter equation (4). The product obtained is transformed back to the space domain to obtain the TDR values.
Centre for exploration targeting (CET) analysis: The centre for exploration targeting (CET) analysis contains tools that were often applied on the FVD, THD and TDR data. These tools include texture analysis, lineation detection, lineation vectorization and structural complexity in identifying subtle magnetic structures [13,33].
Texture analysis provides an estimate of the local variation in the RTE data at each location in the area. Features of significance often exhibit high variability with respect to the background signal. The lineation detection, utilize the phase-based techniques that provide contrast-invariant magnetic feature detection which enhances the appearance of linear features. The phase congruency finds the discontinuity (edges) of linear features.
Skeletonization is a morphological operation that takes a binary (black and white) of analyzed data and skeleton each foreground object by iteratively eroding away its boundary cells until the objects are only 1 cell [13].
Discussions of Results
Total magnetic intensity
The total magnetic intensity (TMI) map (Figure 3), represents all the magnetic effect in the area. These magnetic effects were due to different magnetic intensity of the core and crustal rocks. The TMI values in the area shows intensity varying from 33116.5 nT to 32928.6 nT. The regions with high magnetic intensity denoted with H have shown to be predominant in the S and NW, and less predominant in the extreme NE of the study area. Regions with low magnetic intensity values denoted with L have shown to be predominant in the NE and less predominant in extreme NW and southern part of the study area (Figure 3). These magnetic effects are due to the magnetic strength and magnetic susceptibilities of different rock types ranging from amphibolites, granite, gneiss, schist and sedimentary rocks (ferruginous sand stone and silt stone). The southwestern part with less predominant with low magnetic response at Fashe, Mokwa, Egbako and Bida suggest being sedimentary rocks. However the high magnetic effect in these areas could be the presence of ollitic iron ore or intra-sedimentary intrusions at upper part of Egbako and southern part of Fashe (Figure 3). 37 suggested based on the prevalent high magnetic effect of the geologic structures, there is possibility of solid minerals in part of Bida basin.
For effective interpretation of aeromagnetic data, the reduction to equator was performed on the TMI data. In doing these, the magnetic anomalies were center over their sources; this makes the data easier to interpret while not losing any geophysical meaning. However, high magnetic intensity (anomaly) regions were not significant displaced over their causative sources. The reduced to equator data was subjected to the first order polynomial method to obtained residual field data of the study area. The residual field data was used for further analysis and interpretations.
The residual magnetic field
The residual magnetic field intensity (TMI) values in the area varying from 75.1 nT to -75.4 nT (Figure 4). These represent the magnetic intensity of the crustal rocks within the area [27]. The high positive magnetic intensity values represented in pink and red colours were predominant in the SE, central area and less predominant in the extreme NE, NW and SW part of the study area.
However, the low to very low negative (L) magnetic values represented in yellow, green and blue colurs were predominant in the SW and distributed all around the study area. The low magnetic regions could suggest the occurrence of felsic rocks such as schist and sedimentary rock as country rocks in the area. The high magnetic regions (H) suggest the occurrence of mafic to ultramafic rocks containing substantial amount of Iron ore and other metallic mineral deposit which are usually concealed in the mineral veins (dyke), intruded the country rocks in the region [1,34]. The SW part with predominant low magnetic intensity corresponds to the sedimentary region of the study area while the high positive magnetic intensity in the SE, central area and NE, NW correspond to the basement rock in the re (Figure 2 and Figure 4). However the high magnetic response areas observed in the SW part of the study area could suggest the presence of oolitic iron ore or probably an intrusion of igneous rock into the sedimentary rock 37. 5 generally believe there would always be a susceptibility contrast across a fracture and fault zones due to oxidation of magnetite to hematite, or infilling of fractured rocks by dyke like bodies (intrusion) whose magnetic susceptibilities are different from their host rocks.
First vertical derivative
The first vertical derivative (FVD) values of the area (Figure 5A) were obtained using the residual magnetic intensity data of the area. The FVD values range from -0.1113 nT to 0.0632 nT. Regions with positive magnetic values represented in pink and red colours highlights areas with high magnetic intensity (anomaly) which could suggest the subtle mgnetic structures (mineralized fractures and faults) that were conceled with Iron ore and other metallic mineral deposit as dyke [1,34]. These structures were prominent and correspond with residual anomaly regions in the SE, central part, extreem NW and NE around Kontagora, Wushishi, Zungeru, Tegina, Katayeregi and Paiko (Figure 5A) with high structural density at the NW, NE and SE part of the study area. These magnetic anomalies were visually observed trending NE - SW, N - S, E - W and NW -SE respectively.
Horizontal derivative
Figure 5B shows the total horizontal derivative (THD) values obtained from residual magnetic intensity data of the area. The THD values range from 0.0027 nT to 0.383 nT. Regions with high magnetic values represented in pink and red colours highlights areas with high magnetic intensity (anomaly) suggesting mineralized zones in the area.Mineralizedzones are hosted by the geologic structures (joint, fault and fractures) that control mineralization in the basement rocks [2]. These mineralized zones correspond with the basement rocks which could suggest Iron ore and other metallic mineral deposit in the SE, central part, NE and NW part of the area which is usually concealed in the basement rocks [1,4]. The low magnetic region represented in green and blue colours suggest very low to nonmagnetic structures which could suggest sedimentary rocks in the area and were predominant in the SW corresponding to the geology of the region. The pockets of very low magnetic structures in the SE, NE and NW could be interpreted as schist and felsic rocks (country rocks) hosting high magnetic anomalies (magnetic structures). However, the pockets of high magnetic values in SW suggest the intrusion of magnetic minerals or oxidized iron ore during the Pan-African orogeny [19]. These structures were prominent and consistant with FVD and residual anomaly regions in the SE and central part of the study area. The THD result has better resolution (sharper image) of the magnetic anomalies than the FVD (Figure 6).
Analytic signal
The analytic signal amplitude (ASA) of the study area (Figure 6A) was obtained from residual magnetic data. The ASA shows the susceptibility contrast of the crustal rocks and structures varying from 0.0022 nT/m to 0.1472 nT/m. Regions with pink and red colours in ASA map highlight high amplitude suggesting geologic structures with high susceptibility contrast, interpreted as mineralized zones containing substantial amount of iron ore, gold ore, zinc lead and other metallic minerals in the study area.
Regions in green and blues colours highlight low amplitude suggesting geologic structures with low susceptibility contrast interpreted as nonmetallic mineral zones [4,34]. These regions were predominant in the SW suggesting sedimentary part of the study area and the high amplitude regions suggesting basement region of the study area [3,35]. These amplitude regions correspond with FVD and THD anomaly zones, and the geology of the study area (Figure 2).
Tilt derivative method
The tilt-derivative (TDR) obtained from residual data range from 0.0005 rad to 0.0085 rad (Figure 6B). The pink and red colours highlight high magnetic content in the rocks (geologic structures); the green and blue colours highlight low magnetic content in the rocks [27]. The high intensity anomalies were predominant in the NE, NW and SE part of the study area. The distribution of high anomalies within the low magnetic intensity areas in the SW, suggest deep underlying basement rocks [12]. These anomalies were corresponding with the FVD, THD and ASA respectively.
Center for exploration targeting
Center for explortion targeting (CET) analysis was performed on the derivative anomaly data.Subtle geologic strutures are considered very important in geophysicl explortion as they serve as host to minerals and hydrocarbons [19,27]. The lineaments with FVD magnitude greater than 0.0370 nT Figure 5A, were automatically extracted as thin straight magnetic geologic structuress (Figure 7), which can be reflected as magnetic peaks in the study area [13,33]. The TDR magnitude greater thn 0.0070 rad show the same magnetic geologic structures as magnetic peaks Figure 8 in the study area. These magnetic peaks were automatically extracted using center for exploration targeting (CET) analysis to inferr the exploration point as black linear, curve linear and structural contact [13,33]. However, the magnetic structures from TDR were sparsely distributed which infer the occurrence of deep seated magnetic structures (basement) in the study area (Figure 8).
The composite subtle magnetic structural map of the study area was produced by integrating all the magnetic structures in the study area (Figure 9). The curve linear structures and structural contact (lineament intersection) are important regions that concealed solid mineral deposits. There areas correspond to the ASA peaks greeter than 0.099 nT/m, suggest the true location of magnetic source. The curve linear and intersection of magnetic structures were predominant in the SE, NW and central region (Figure 8 and Figure 9) which are possible locations of mineral deposit in the study area. However the red colour represent active Gold mine site while blue colour suggests potential areas for solid mineral deposit (Figure 9). The regional and local control of mineralization are mainly structural, made up of a system of fracture, fault, joints and other structures of Pan African age [2,4-6,34].
Figure 10 shows the lineament superimposed on the geologic map of the study area. The magnetic structures in the area were predominant in basement part and less predominant in the sedimentary part of the study area. This highlight the deep seated underlying basement rocks in the sedimentary part of the area. The magnetic structural features within the schist rock and it surrounding basement rocks complement the possible intrusions within the area which could suggests the mineralization of for Gold, Quartz, silver iron ore, lead, cupper and other important industrial minerals in the NE, SE and NW parts of the study area [1,2,36].
Structural trend
Figure 11 shows the polar plot in the study area obtined from FVD, THD and TDR using Rock work soft ware for polar plot. These plots shows the direction/orientation of subtle magnetic structures. Quantitative interpretation of tthe structural trend were in decreasing order of predominant from the NE -SW, N - S, E -W and NW - SE respectively. The E - W structures were Pre-Pan African while the NE -SW, N - S and NW - SE structures were Pan African [15,19,36]. The Pre-Pan African are the paleo structures which were later reworked during the Pan African event [19,36]. This event changes most of the E -W structures to NE -SW, N - S and NW - SE structures. The polar plot infer the propergation of tectonic activties during the tectonic event [15,19,36]. These structural trend analysis correspond to [15] inferred lineaments trending NE - SW , N - S, E - W, NW - SE in part of southern Bida Basin and are attributed to the inward extension of the Chain and Romanche fracture zone from the Atlantic Ocean.
Conclusion
Aeromagnetic data covering the study area was analyzed and interpreted using different methods for mineralized geologic structures.
• Magnetic anomalies (linear geologic structures) observed from first vertical derivative; horizontal derivative; tilt derivative maps were predominant in the SE, central and NW part of the study area.
• The anomaly regions with magnitude greater than 0.0992 nT/m were mineralized structures.
• These regions correspond with structural contacts in the area.
• Thus mineralized region were structurally controlled, made of Pan African structures.
• The mineralized structures were predominant in the SE, central and NW part of the study area. The low and very low magnetic structures were sparsely distributed as shown on the structural map of the area.
• The general trend of these magnetic geologic structures is NE - SW, N - S, E - W and NW SE respectively.
• This imply that the regional and local control of Gold mineralization are mainly structural, made up of a system of faults and other structures of Pan African age.