Underlying Variations of Atmospheric CO2 Concentrations in Urban Environs of Owerri: Comparison with Rural Areas and Need for Urban Greening

International Journal of Earth Science and Geophysics
(ISSN: 2631-5033)
Volume 8, Issue 1
Research Article
DOI: 10.35840/2631-5033/7558

Article Formats
Underlying Variations of Atmospheric CO2 Concentrations in Urban Environs of Owerri: Comparison with Rural Areas and Need for Urban Greening
Table of Content
Figures
Tables
Table 1: Owerri statistical results over Carbon dioxide, temperature and wind speed.
Table 2: Uratta statistical results over Carbon dioxide, temperature and wind speed.
References
- Houghton RA, Hackler JL (1999) Emissions of carbon from forestry and land-use change in tropical Asia. Global Change Biology 5: 481-492.
- Seekell D (2016) Passing the point of no return. Science 354: 1109.
- Houghton RA, Skole DL, Nobre CA, Hackler JL, Lawerence KT, et al. (2000) Annual fluxes of carbon from deforestation and regrowth in the Brazilian Amazon. Nature 403: 301-304.
- Houghton RA, Ramakrishna K (1999) A review of national emissions inventories from select non-annex I countries: Implications for counting sources and sinks of carbon. Annu Rev Energy Environ 24: 571-605.
- Sharkey TD (2016) What gas exchange data can tell us about photosynthesis. Plant cell Environ 39: 1161-1163.
- Rogers, et al. (2017) A roadmap for improving the representation of atmospheric capacity and CO2 assimilation in the Arctic. New Phytol 26: 705.
- Buchmann N, Schulze ED (1999) Net CO2 and H2O fluxes of terrestrial ecosystems. Global Biogeochemical Cycles 13: 751-760.
- Ishitani H, Johansson TB, Al-Khouli S (1996) Energy supply mitigation options. In: Climate Change 1995. Impacts, adaptations and mitigation of climate change: Scientific-technical analyses. Contribution of Working Group II to the Second Assessment Report of the Intergovernmental Panel on Climate Change. Cambridge University Press, Cambridge, 587-648.
- Houghton RA, Hackler JL, Lawrence KT (1999) The US carbon budget: Contributions from land-use change. Science 285: 574-578.
- Arrhenius S (1896) On the influence of carbonic acid in the air upon the temperature of the ground. The London, Edinburgh, and Dublin Philosophical Magazine and Journal of Science (fifth series) 41: 237-275.
- Elena P, Gloor M, Schultz U, Haensel F, Seifert T, et al. (2007) Monitoring atmospheric greenhouse gases, results from continental tall tower measurement. European Geosciences Union 14-21.
- Kort E, Frankenberg C, Miller C (2012) Space-based observations of megacity carbon dioxde. Geophysical Res Lett 39.
- Tans PP, Conway TJ, Nakazawa T (1989) Latitudinal distribution of the sources and sinks of atmospheric carbon-dioxide derived from surface observations and an atmospheric transport model. Journal of Geophysical Research-Atmospheres 94: 5151-5172.
- Tans PP (1991) Uncertainties in the global carbon-cycle. Pure and Applied Chemistry 63: 766-768.
- Gloor M, Bakwin P, Hurst D, Lock L, Draxler R, et al. (2001) What is the concentration footprint of a tall tower? Journal of Geophysical Research-Atmospheres 106: 17831-17840.
- Gloor M, Fan SM, Pacala S, Sarmiento J (2000) Optimal sampling of the atmosphere for purpose of inverse modeling: A model study. Global Biogeochemical Cycles 14: 407-428.
- Rigby M, Toumi R, Fisher R, Lowry D, Nisbet EG (2008) First continuous measurements of CO2 mixing ratio in central London using a compact diffusion probe. Atmospheric Environment 42: 8943-8953.
- Turnbull JC, Karion A, Fischer ML, Faloona I, Guilderson T, et al. (2011) Assessment of fossil fuel carbon dioxide and other anthropogenic trace gas emissions from airborne measurements over Sacramento, California in spring 2009. Atmos Chem Phys 11: 705-721.
- McKain K, Wofsy SC, Nehrkorn T, Eluszkiewicz J, Ehleringer R, et al. (2012) Assessment of ground-based atmospheric observations for verification of greenhouse gas emissions from an urban region. Proc Nat Acad Sci USA 109: 8423-8428.
- Battle M, Bender ML, Tans PP, White JWC, Ellis JT, et al. (2000) Global carbon sinks and their variability inferred from atmospheric O2 and dC13. Science 287: 2467-2470.
- Rayner PJ, Enting IG, Francey RJ, Langenfelds R (1999) Reconstructing the recent carbon cycle from atmospheric CO2, delta C13 and O2/N2 observations. Tellus 51: 213-232.
- Le Quere C, Aumont O, Bopp L, Bousquet P, Ciais P, et al. (2003) Two decades of ocean CO2 sink and variability. Tellus 55: 649-656.
- Manning AC, Keeling RF (2006) Global oceanic and land biotic carbon sinks from the Scripps atmospheric oxygen flask sampling network. Tellus 58: 95-116.
- Grimmond CSB, King TS, Cropley FD, Nowak DJ, Souch C (2002) Local-scale fluxes of carbon dioxide in urban environments: Methodological challenges and results from Chicago. Environmental Pollution 116: S243-S254.
- Nemitz E, Hargreaves KJ, McDonald AG, Dorsey JR (2002) Micrometeorological measurements of the urban heat budget and CO2 emissions on a city scale. Environ Sci Technol 36: 3139-3146.
- Soegaard H, Moller-Jensen L (2003) Towards a spatial CO2 budget of a metropolitan region based on textural image classification and flux measurements. Remote Sensing of Environment 87: 283-294.
- Moriwaki R, Kanda M (2004) Seasonal and diurnal fluxes of radiation, heat, water vapor and CO2 over a suburban area. Journal of Applied Meteorology 41: 792-810.
- Vogt R, Christen A, Rotach MW, Roth M, Satyanarayana ANV (2004) Fluxes and profiles of CO2 in the urban roughness sublayer. Theoretical and Applied Climatology 96: 257-291.
- Keeling CD, Whorf TP (2005) Atmospheric CO 2 records from sites in the SIO air sampling network. In: Trends: A compendium of data on global change. Carbon Dioxide Information Analysis Center, Oak Ridge National Laboratory, U.S. Department of Energy, Oak Ridge, Tenn., USA.
- Henninger S (2008) Analysis of near surface CO2 variability within the urban area of Essen, Germany. Meteorologische Zeitschrift 17: 19-27.
- Conway TJ, Tans PP, Waterman LS, Thoning KW, Masarie KA, et al. (1988) Atmospheric carbon dioxide measurements in the remote global troposphere, 1981-1984. Tellus 40b: 81-115.
- Conway TJ, Tans PP, Waterman LS, Thoning KW (1994) Evidence for interannual variability of the carbon cycle from the national oceanic and atmospheric administration/climate monitoring and diagnostics laboratory global air sampling network. Journal of Geophysical Research-Atmospheres 99: 22831-22855.
- Peters W, Krol MC, van der Werf GR, Houweling S, Jones CD, et al. (2010) Seven years of recent European net terrestrial carbon dioxide exchange constrained by atmospheric observations. Global Change Biology 16: 1317-1337.
- Rodenbeck C, Houweling M, Gloor M, Heimann (2003) CO2 flux history 1982-2001 inferred from atmospheric data using a global inversion of atmospheric transport. Atmos Chem Phys 3: 1919-1964.
- Ramonet MP, Ciais T, Aalto C, Aulagnier F, Chevallier D, et al. (2010) A recent build-up of atmospheric CO2 over Europe. Part 1: Observed signals and possible explanations. Tellus 62B: 1-13.
- Trusilova K, Rodenbeck C, Gerbig C, Heimann M (2010) Technical note: A new coupled system for global to regional downscaling of CO2 concentration estimation. Atmos Chem Phys 10: 3205-3213.
- Geels C, Gloor M, Ciais P, Bousquet P, Peylin P, et al. (2007) Measuring system for the long-term monitoring of biosphere/atmosphere exchange of carbon dixide. Journal of Geophysical Research 106: 3461-3479.
- Miao Y, Liu S, Zheng Y, Wang S, Liu Z, et al. (2015) Numerical study of the effects of planetary boundary layer structure on the pollutant dispersion within built-up areas. Journal of Environmental Science 32: 168-179.
- Chree C (1913) III. Some phenomena of sunspots and of terrestrial magnetism magnetism at Kew Observatory. Philosophical Transactions Royal Society London Series A 213-245.
- Piao S, Ciais P, Lomas M, Beer C, Liu H, et al. (2011) Contribution of climate change and rising CO2 to terrestrial carbon balance in East Asia: A multi-model analysis. Global and Planetary Change 75: 133-142.
- Levin I, Karstens U (2007) High-resolution fossil fuel CO2 records at continental sites for combined CO2 C-14 and CO observation. Tellus 59B: 245-250.
- Fenger J (2009) Air pollution in the last 50 years - from local to global. Atmospheric Environment 43: 13-22.
- Ahmadov R, Gerbig C, Kretschmer RS, Korner C, Rodenbeck P, et al. (2009) Comparing high resolution WRF-VPRM simulations and two global CO2 transport models with coastal tower measurements of CO2. Biogeosciences 6: 807-817.
- Cheng Y, An X, Yun F (2013) Simulation of CO2 variations at Chinese background atmospheric monitoring stations between 2000 and 2009: Applying a CarbonTracker model. Chin Sci Bull 58: 3986-3993.
- Krol M, Houweling S, Bregman B, van den Broek M, Segers A, et al. (2005) The two-way nested global chemistry-transport zoom model TM5: Algorithm and applications. Atmos Chem Phys 5: 417-432.
- Ferrarese S, Apadula F, Bertiglia F, Cassardo C, Ferrero A, et al. (2015) Inspection of high-concentration CO2 events at the Plateau Rosa Alpine station. Atmos Pollution Research 6: 415-427.
- Singh YP, Badruddin (2006) Statistical considerations in superposed epoch analysis and its applications in space research. Journal of Atmospheric and Solar-Terrestrial Physics 68: 803-813.
- Ballav S (2012) Simulation of CO2 concentration over East Asia using the regional transport model WRF- CO2. J Meteor Soc Japan 90: 959-976.
- Watson RT, Zinyowera MC, Moss RH, Dokken DJ (1996) Climate Change (1995): The IPCC Second Assessment Report. Scientific-technical analyses, Impacts, adaptations and mitigation of climate change. Contribution of working group II to the second assessment report of the intergovernmental panel on climate change. Cambridge University Press, Cambridge, UK.
Author Details
CM Anoruo* and TC Chineke
Atmospheric Physics Group, Imo State University, Owerri, Nigeria
Corresponding author
CM Anoruo, Atmospheric Physics Group, Imo State University, Owerri, Nigeria, Tel: +2347032404289.
Accepted: March 03, 2022 | Published Online: March 05, 2022
Citation: Anoruo CM, Chineke TC (2022) Underlying Variations of Atmospheric CO2 Concentrations in Urban Environs of Owerri: Comparison with Rural Areas and Need for Urban Greening. Int J Earth Sci Geophys 8:058.
Copyright: © 2022 Anoruo CM, et al. This This is an open-access article distributed under the terms of the Creative Commons Attribution License, which permits unrestricted use, distribution, and reproduction in any medium, provided the original author and source are credited.
Abstract
Photosynthesis has been the major phenomena of removing accumulated carbon dioxide from the atmosphere due to the presence of green plants. Deforestation has always served as an obstacle towards carbon dioxide sink. Analytical experiment of diurnal carbon dioxide measurement was conducted over some selected areas of Owerri metropolis that has no green plants, and was compared by a ground measurement at Uratta in Owerri North. Statistical analysis of variance and mean was carried out on the obtained data, and it was observed that Uratta has moderate temperature than Owerri. Owerri recorded a twelve months carbon dioxide, temperature and wind speed mean values of 583.42 ppm, 33.69 ℃, and 1.31 m/s, while Uratta recorded mean values of 471.47 ppm, 23.67 ℃ and 2.21 m/s. From the experimental method, it can be deduced that the amount of heat energy added to the regions depends on the concentration of greenhouse gases in the atmosphere. However, urbanization reduces terrestrial sink. This activity introduce heat wave to the corresponding environments. The result of this study suggests need for urban greening for a good photosynthetic uptake.
Keywords
Deforestation, Vegetated surroundings, Seasonal variation, Photosynthesis, Urbanization
Introduction
Mostly 90% significant estimation of carbon dioxide emissions as a result of anthropogenic contributions since 1850 has been attributed to deforestation [1]. This accumulation as reported by [2] is also as a result of 20% reduction of forested areas. This adequately suggested that deforestation has been on an increase and mostly in tropical countries [3]. [4] reported that this accumulation has been on a decrease in Europe and North America as the result of reforestation. Typically, several physiological limitations on the photosynthetic uptake of trees have been observed [5] including the biophysical limitations [6]. This is observed towards the stomatal photo-conductance of regenerated trees. This generally showed that regenerated forested area stores less carbon dioxide. Also, regenerated trees show to have rapid carbon dioxide absorption, but have found to be at a lower percentage towards maturity and hence, can't adequately serve as a good sink [7]. A good use of biomass energy could also reduce the rate of atmospheric CO2 increase [8]. In order to achieve proper carbon dioxide sink, harvested wood and/or trees must be turned into a long lived product or used as biomass energy in order to avoid excessive fossil fuel emissions [9]. Climate change is constantly posing heating of the atmosphere and the composition of heating experienced in any particular region is as the result of greenhouse gas concentration emitted at that region. Due to this, [10] reported that the Earth would experience a temperature increase of approximately 6 ℃ as a result of carbon dioxide (CO2) concentration replication. The greenhouse effect as a natural phenomenon causes the warming observed at the lower troposphere, as a result of greenhouse gases trapped and/or absorbed by the Earth's surface through the long wave infrared radiation. This phenomenon was discovered by J. Fourier in 1827 and first quantified by S. Arrhenius in 1896. These greenhouse gases are responsible for the Earth's surface warming in order of 33 ℃ and they include carbon dioxide (CO2), water vapor, nitrous oxide (N2O), methane (CH4) and tropospheric ozone (O3) [9].
The atmosphere as dynamic system hosts large number of physical and/or chemical processes. Adequate understanding of atmospheric dynamics as well as the transport of pollutants could be achieved using atmospheric models. This atmospheric model simulates various processes occurring in atmosphere and their interactions. In order to make clear knowledge of this global warming and its trend is to engage on the direct measurement of these atmospheric greenhouse gas compositions and their effects. Though, there could be other forms of measurements like that of high tower measurement found in [11], satellite measurement found in [12]. In short, direct measurement adopted in this research is adequate method and has potential of measuring direct ambient CO2 concentration of any region and describing its spatial distribution across cities. This is because spatiotemporal variation of atmospheric gas concentration found in any region indicates (i) The spatial composition, as well as flux intensity of that region (ii) The factors contributing towards this distribution and its time variations (iii) The interactions and feedbacks of different processes and variables.
In order to estimate the strength of emission factor, adequate knowledge of atmospheric transport is needed through atmospheric concentration measurement. This method, which is referred to "atmospheric inversion" has been in practice over two decades now [13].
[14] suggested better approach to address continental atmospheric gas measurements and adequate step to overcome problem associated with them through CO2 and other gas measurements from tall towers. In order to deduce regional fluxes, it is advisible to take measurement close to surface, where proximity to sources and sinks results in large signals with high temporal resolution. However, measuring atmospheric gases at a good height, which is a few hundred meters, the resolution will indicate a good flux footprint of order 500-1000 km [15]. Hence, sampling from a different height continuously above the ground permits a clear result which separates the local from regional fluxes [16]. A considerable CO2 measurement in urban environments has been carried out, with the aim which focuses on the diurnal variation of CO2 and its relationship with the planetary boundary layer and emissions [17]. A recent example has started to attempt, which specifically attributes emissions [18] and performs trend detection over the time [19]. These studies suggested that acknowledgment and trend detection with atmospheric observations are possible, and need to consider planting green plants for Carbon dioxide mitigation. Though, effect of extensive deforestation, changes in land use, as well as urban development has attributed too much storing of carbon dioxide into the atmosphere, that could lead to temporal increase of CO2 concentration globally.
Carbon dioxide is a greenhouse gas that accounts presently in the atmosphere due to anthropogenic contributions. Its concentration is closely related to the biogeochemical carbon cycle that involves a direct exchange with the terrestrial biosphere, ocean, as well as the marine biosphere. An estimation using different method have shown that, over the decades, carbon dioxide released into the atmosphere has been absorbed by the biosphere and oceans in a comparable proportion [20-23]. In a longer point of view, urban measurement made on continuous basis can provide useful information that could be used in monitoring changes in carbon emission in response to local, national, as well as globally. With a great objective aimed towards reduction of greenhouse gas emission from anthropogenic sources.
A few research study in order to quantify the influence of carbon dioxide has been done at urban sites, including a suburb area of Chicago [24], central Edinburgh [25] and Marseille, France [24], and suburban areas of Copenhagen [26], Tokyo [27], and Basel [28]. Long-term field project comparison of carbon dioxide and temperature is currently underway in Baltimore [24], but there are relatively few such studies. Therefore, we have observed in this study, urban and rural areas of Owerri and Uratta region to estimate concentration of carbon dioxide and contribution of greening.
Urbanization influence and diffusion
The influence of urbanization tends to make low the sink of atmospheric carbon dioxide gas emission. Additionally, introduces major CO2 sources through combustion of fossil fuels. Without adequate knowledge of urban CO2 fluxes and controls, significant carbon budget scenario will be lacking.
Recognizing potential global climate change problem, World Meteorological Organization (WMO) as well as the United Nations Environment Programme (UNEP) established in 1988 the Intergovernmental Panel on Climate Change (IPCC) with the mission to assess the scientific, technical and socio- economic information that is relevant for the understanding of climate change, its potential impact and option for adaptation and mitigation [19].
In order to create a reliable and complete data network of CO2 and other greenhouse gas concentrations, the World Meteorological Organization (WMO) established the Global Atmosphere Watch (GAW) program in 1991, which actually involves about 80 countries. As part of the GAW program, the World Data Centre for Greenhouse Gases (WDCGG), hosted by the Japanese Meteorological Agency, collects and distributes greenhouse gas concentration data. The GAW program has the aim of providing data and information on the chemical composition of the atmosphere, as well as improving the understanding of the changes in concentration of natural and anthropogenic gases and the mutual interactions between atmosphere, oceans and biosphere.
Monitoring of the atmospheric concentration of CO2 was started in 1958 by C.D Keeling from the Scripps Institution of Oceanography (SIO) at Mauna Loa observatory Hawaii, which is in the present the longest and continuous atmospheric CO2 record [29]. The greatest concentrations of CO2 are measured during the night and in the morning. An early morning maximum is associated with the morning rush hour. Measurements in Essen, Germany determined that 71% of the near surface CO2 is affected most by traffic density and atmospheric stability [30]. Different weekend effects are observed with lesser concentrations during the weekend in Baltimore but the greatest concentrations in Mexico City are observed on Saturday, which also corresponds to the selected locations of Owerri metropolis.
The original aim of monitoring CO2 was to evaluate its global background concentration and rate of increase [31,32]. Recently, CO2 datasets have also been used for other purposes, such as the study of net ecosystem exchanges [33], and of the latitudinal and seasonal patterns of sources and sinks and their magnitudes [13,34]. The long term CO2 record has been used to evaluate interannual and decadal changes in the atmospheric CO2 concentration gradient in Europe [35] and to validate atmospheric greenhouse gas models [36] and inverse source receptor models [37].
The mathematical description of carbon dioxide concentration profile from different chemical compounds in the atmosphere is one of the applications of atmospheric models [38,39]. The description used in this research detects trends in carbon dioxide emission from localized source region, like that of [40]. Also, there are other models like high resolution transport model REMO, coarser resolution model LMDZ, which resolves the spatial gradients caused by carbon dioxide emissions [41]. The problem which the description tackles is to calculate the spatial and temporal concentration of air pollutants under specific emission conditions. As might be expected, in order to solve this problem, it is necessary to have a detailed description of the pollutant emissions, the land topography, the reactivity of the pollutants and the transport conditions in the atmosphere [42].
Data and Model
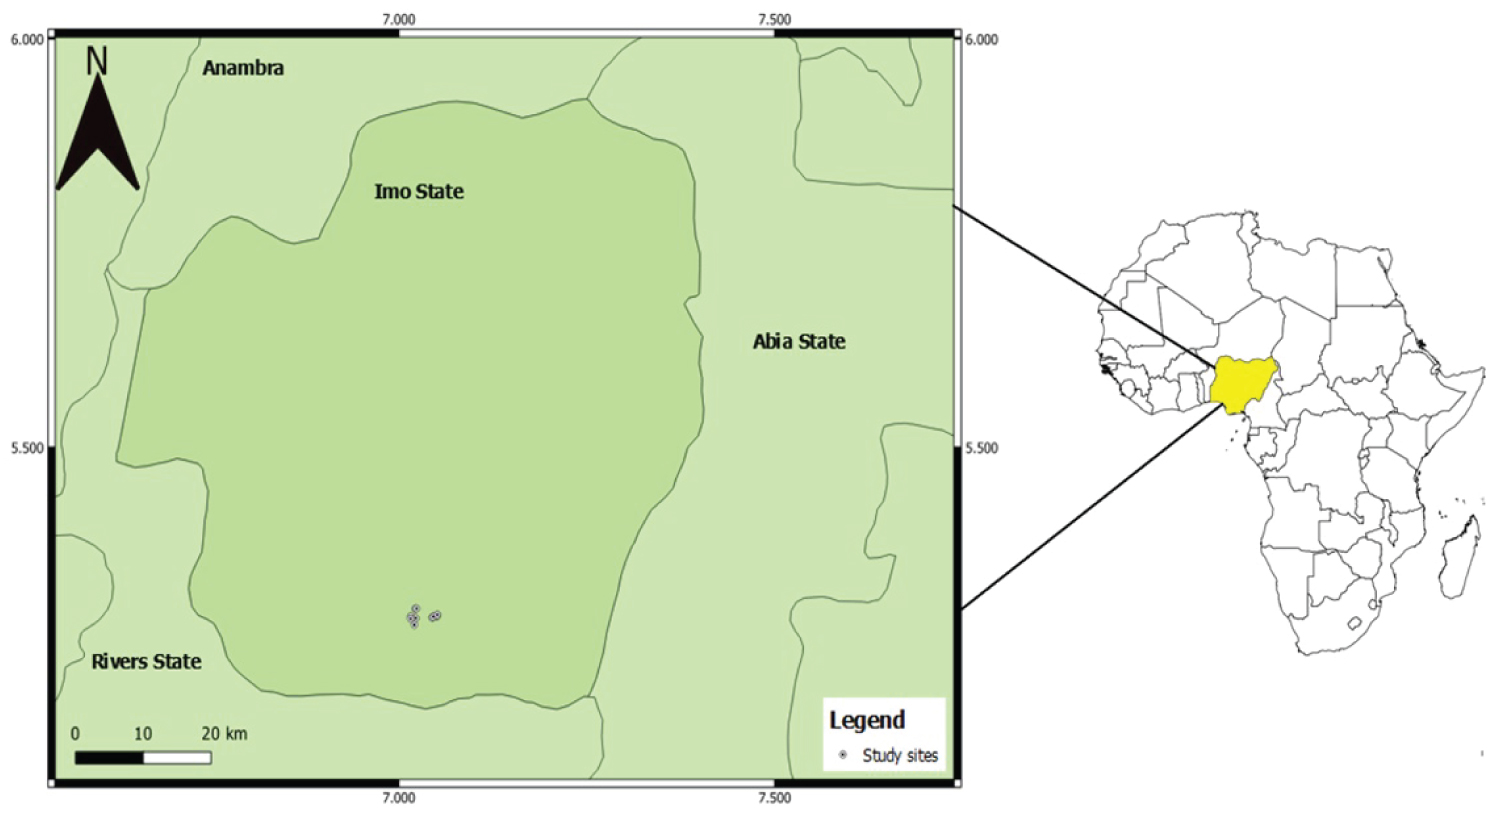
Twelve months ground based measurements of Carbon dioxide, Temperature, and wind speed made at Owerri metropolis were compared by a measurement made at Uratta Owerri North. These meteorological in-situ measurements exhibit large diurnal (Morning and Evening) period of January to December 2016. The aim of the measurement is to compare carbon dioxide sink in urban areas that does not support city greening and rural areas that has green plants. Nigeria is located in West Africa on the Gulf of Guinea and has a total covering area of 923, 768 Km2. The far south Eastern region, which lies Owerri (lat 5.48 N, long 7.03 E), Imo State is defined by its tropical rainforest climate, where annual rainfall is 1524 to 2032 mm per year. The map (Figure 1) shows the location of the state.
A corresponding model adopted from [38] was used to study the diffusion pattern of the study area Eqs. (1-3). [43] coupled Weather Research and Forecasting Model (WRFC) with Vegetation Photosynthesis and Respiration Model (VPRM) in order to understand the full effect of transport over atmospheric CO2 distributions. Also, Carbon Tracker model (CT) which describes the variation relationship of CO2 concentration with spatial coverage [44], and TM5 (Tracer model version 5) developed by National Oceanic and Atmospheric Administration [45]. The prevailing wind speed and pattern that was responsible for the advection and diffusion of pollutants were analyzed and depicted. The data set used in this model was collected on a ground based maintaining a diurnal pattern. The station recorded high concentration of CO2 peaks. These peaks can originate from local effects and/or from synoptic scale transport [46].
In Eq. (3) the advective equation of the transport was generated by considering C, which is the pollutant concentration and S as the emission source, is the ith velocity component then and are the effective kinematic viscosity and diffusion coefficient. It is observed from the analysis that the diffusion coefficient is on the increase.
In order to address the issue of how local CO2 concentrations are affected by human activities in arid, urban environment, this experimental research focuses on conducting a carbon source study evaluating anthropogenic carbon sources and action of wind contribution. There is no globally definition of "urban" as each country has its own definition.
The accurate determination of the factors which control the concentration of pollutants in the ambient air such as the emission sources, the pollutant transport and the surface topography define how realistic is the solution of the problem. Several categories of models have been used such as deterministic, statistical and stochastic for the solution of problems for pollutant dispersion in the atmosphere [13]. Numerical and analytical methods have been applied to deterministic model, by evaluating the obtained data in order to check the concentration rate of carbon dioxide emissions between Owerri and Uratta in a continuous range of twelve months. Numerical solutions in terms of using the data have been used widely, but require extensive input data and computational time.
Data Analysis
Statistical analyses of Carbon dioxide, temperature and wind speed obtained through measured area of Owerri and Uratta were subjected to Epoch analysis. Epoch analysis is an essential tool in running analysis and to solve atmospheric physics problems. It has been fast procedure to determine statistical impact of experimental results [39]. Before evaluating the significance of meteorological data sets obtained from the measurement, procedures for data transformations were obtained without affecting the sample average by using the filtering epoch sample mean. We calculated weekly epoch and this was adopted from [47] Let bth measurement of ath population is denoted by Xab. Z being the number of observations in each sample and I being the number of populations (epochs); the meteorological total data consist of IZ observation .
Where
The average is given by
The variance of the in situ sample mean of the measurement is
Results and Discussion
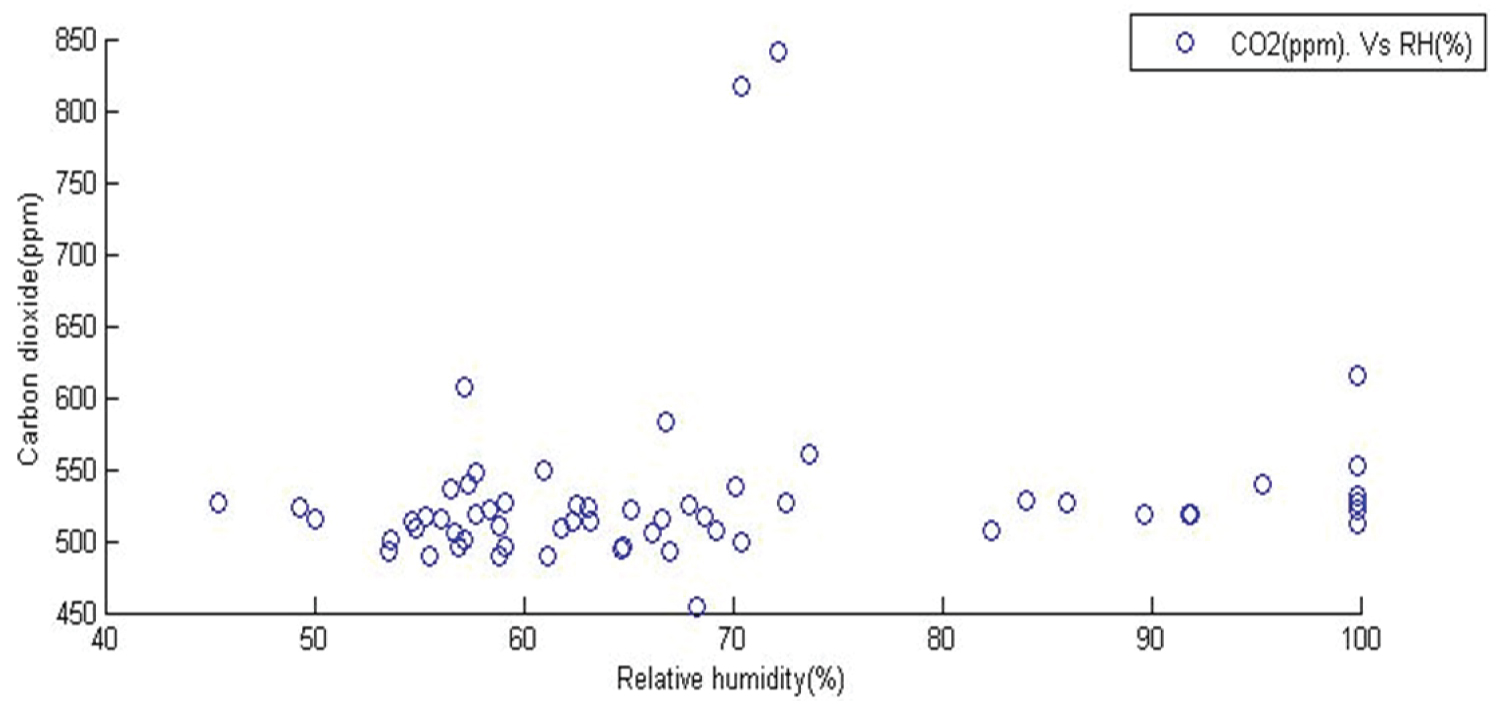
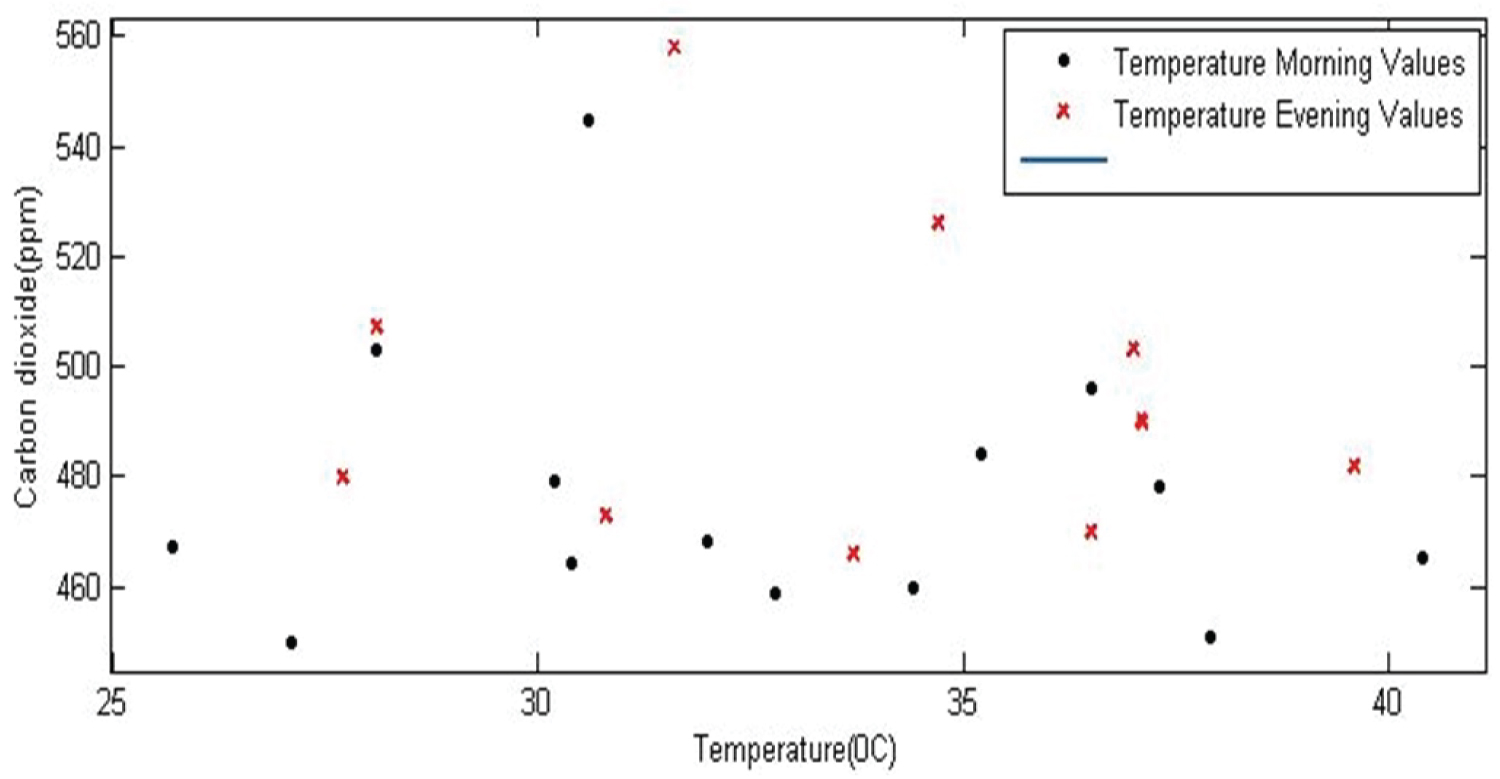
Results obtained in this research indicated the implication of not practicing urban greening towards the urban region. In Table 1, statistical results depict characteristics of carbon dioxide emissions over Owerri and Uratta. From the analyses results, different result is observed in Table 2. Results of carbon dioxide, temperature and wind speed measured in parts per million (ppm), degree celcius (℃) and meter-per-seconds (m/s) using epoch as described in Eqn 4 to Eqn 6 shows clear variations. In the rural area of Uratta, the measuring environment has trees all over the surroundings which enable low retrievals of carbon dioxide despite the traffic at Toronto Junction. The result highlights important actions of greening residential areas to mitigate local CO2 emissions, particularly in cities, to maintain high photosynthetic rate. As urban areas expand, urban planners needs to consider importance of greening to offset urban CO2 emissions. While this study suggests favoring evergreen vegetation, additional work should be maintained to quantify photosynthetic CO2 utilization potential of individual tree species. This will give routine in plant species selection for urban greening programs aimed at climate change mitigation. Also, the research result indicated that surface distributions and wind directions are the leading controls for CO2 variations [48]. This is because an environmental consequence of unplanned urban growth poses traffic congestion, air and water pollution, as well as improper solid waste disposal. Social consequences of unplanned urban settlement poses urban poverty, poor working conditions as well as low wages in the urban informal sector. However, conditions within cities or town often differ from one place to another, and where the poorest conditions occur in the informal sector, they are extremely difficult to measure. In Figure 2, measurements of carbon dioxide in 27 Casmir show low concentrations in this region. Unlike the results obtained at the measurement sites done at urban environs, this is the fact that patterns of human activities like deforestation raise concerns about imbalances in the carbon cycle and their implications. The drift depicted confirms the month as dry seasonal month, and also more carbon sink due to the presence of green plants. Figure 3 Depicts temperature trends observed in 1 Casmir. The thick black spot is values obtained during the morning measurements, while the star spot is evening retrievals. The thick black spot confirms the area as a temperate zone because more values range from 27.5 ℃ to 32.5 ℃. This confirms the need for urban greening.
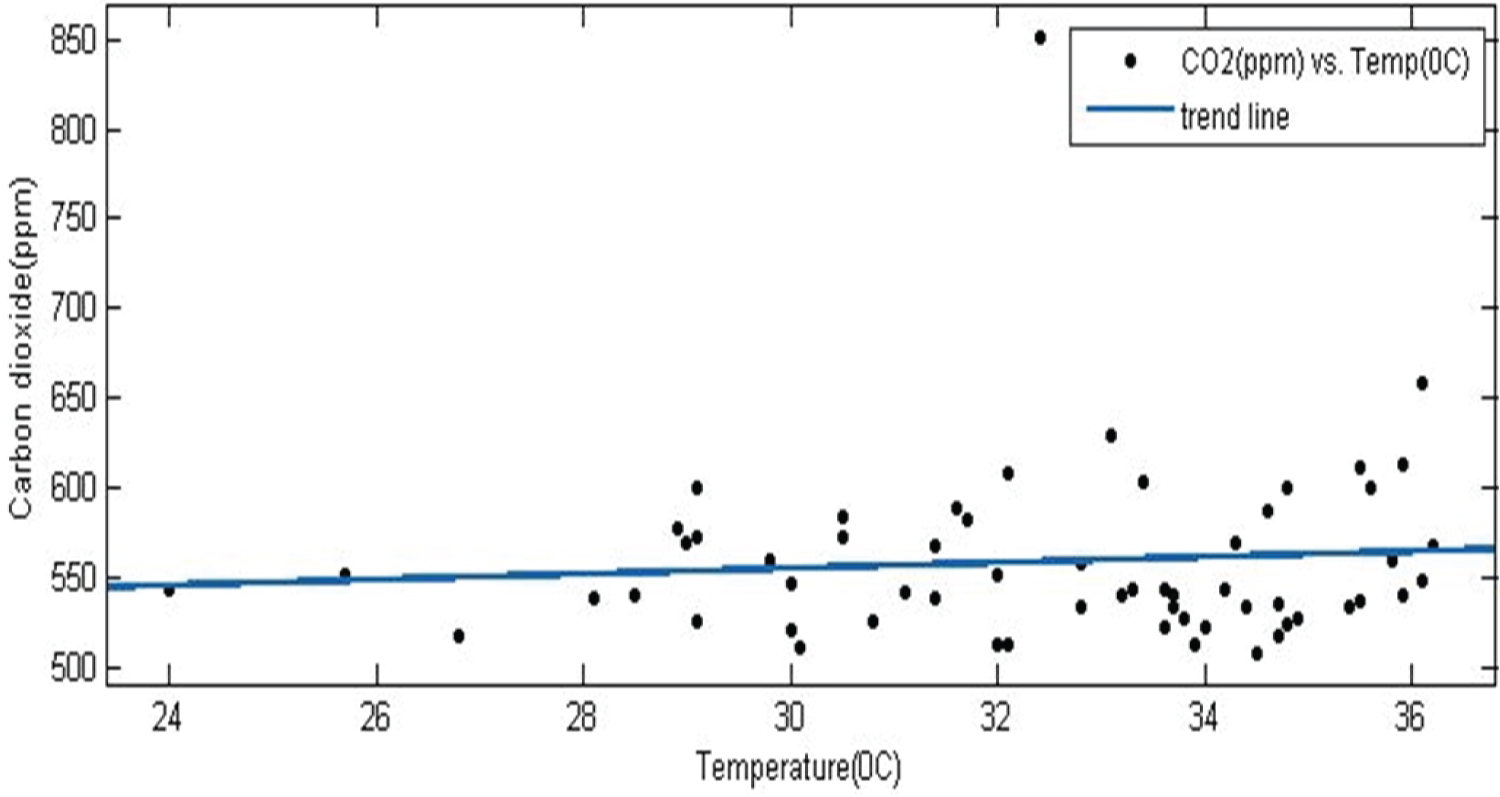
In Figure 4, shows temperature variation over location. The factory is still under construction, and a generator set been mounted outside. The trend depicts a clear linearity between carbon emissions with temperature. As already discussed in the literature, in order to obtain a good and accurate temperature measurement of any particular area, daily temperature variation of that particular area will not be accurate if observed at higher elevations. Therefore, the daily temperature variation is one of the main characteristics for the determination of the planetary boundary layer which happens to be the lower part of the atmosphere. The twelve months diurnal measurements were made at 5 m distance apart. From the statistical mean results, it is observed that the site recorded 471.47 ppm of carbon dioxide from the statistical result in Table 2. This shows the benefits of greening if the results are being compared with that of Mechanic new road and at urban sites. This is due to the fact that rising concentrations of atmospheric carbon dioxide and other greenhouse gases alters the earth's radiant energy balance. The global concentration of heat, as well as the temperature and precipitation that we experience as weather and/or climate is as the result of the earth's energy budget.
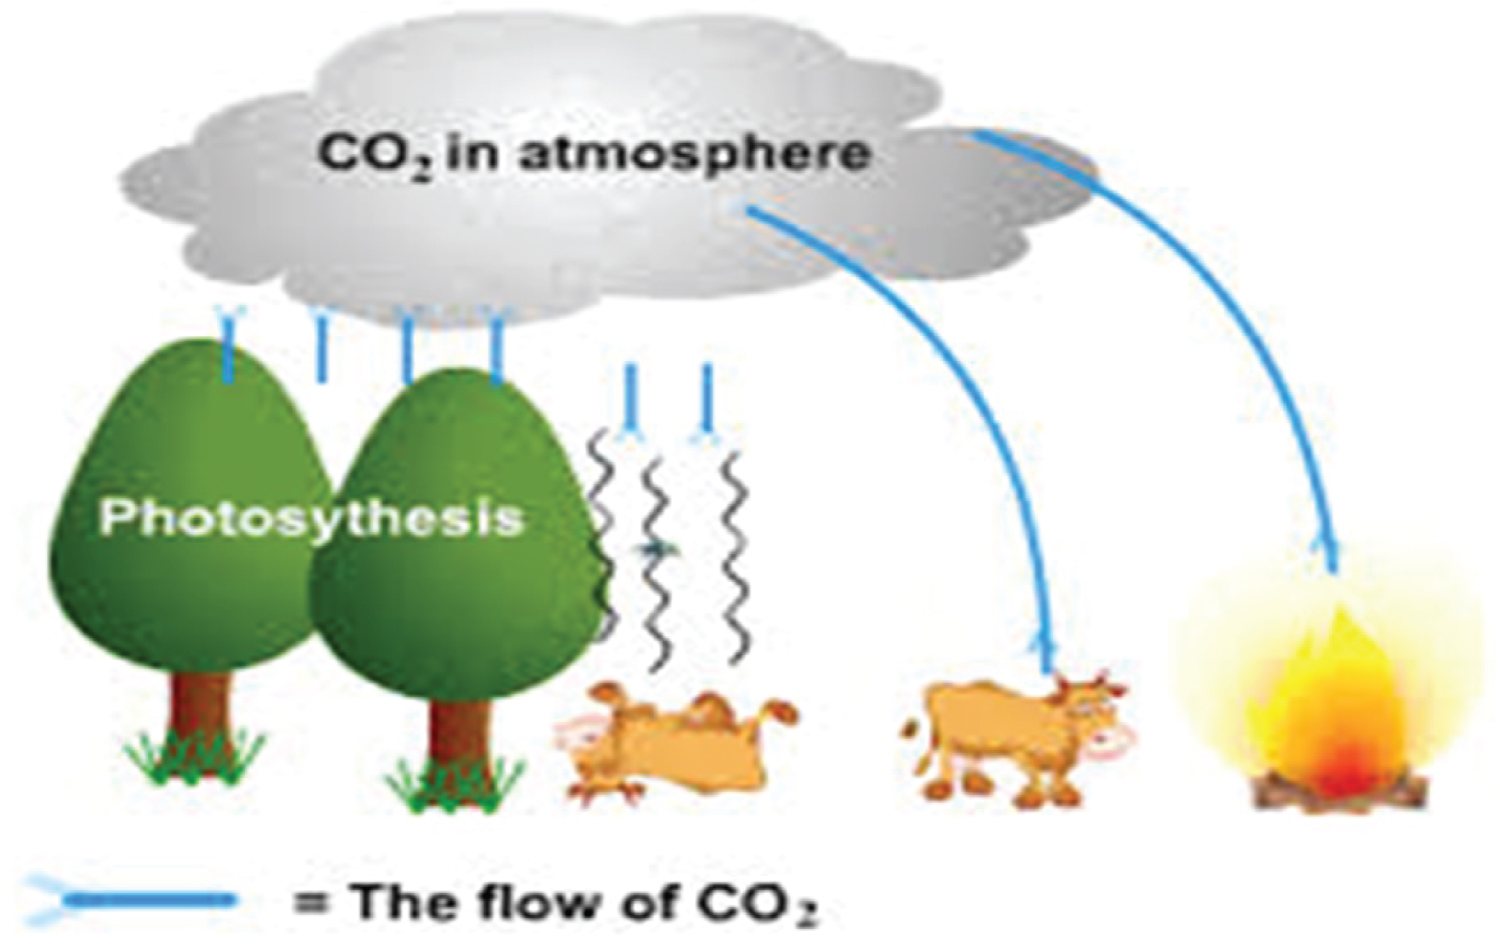
The basic carbon cycle, which will enhance photosynthesis, drives through:
1. Plants converting the accumulated atmospheric carbon dioxide to carbohydrates by photosynthesis, which will serve as carbon sink.
2. Animals as well as microorganisms consume and oxidize these carbohydrates.
3. Carbon dioxide is captured and stored in soils, oceans and rocks.
Figure 5 depicts the absorption of carbon dioxide by green plants.
Conclusion
In this experimental research, an adequate understanding of the temporal variations of atmospheric CO2 pollution effect over heat island was investigated by applying a comprehensive and consecutive Field Measurement Method (FMM) of Carbon dioxide, temperature and wind speed. Anthropogenic contribution to regulating the distribution and seasonal patterns of the carbon dioxide load was addressed. From the statistical results depicted in Table 1 and Table 2, Owerri recorded a twelve months carbon dioxide, temperature and wind speed mean values of 583.42 ppm, 33.69 ℃, and 1.31 m/s. While Uratta recorded mean values of 471.47 ppm, 23.67 ℃ and 2.21 m/s.
In order to understand trends in the sources and sinks of atmospheric carbon dioxide emission, there should be an adequate knowledge of atmospheric dynamics and efforts to control climate change require the stabilization of atmospheric carbon dioxide concentrations. This is because the changes in the carbon dioxide sinks are highly uncertain, but they could have a significant influence on future atmospheric CO2 levels, it is therefore crucial to reduce the uncertainties.
The results obtained from the statistical values shows that Uratta have a moderate climate due to the presence of green plants when compared with Owerri. This research work supports the need for urban greening. While this study suggests favoring of green vegetation, further research is required to quantify the photosynthetic CO2 uptake potential of individual tree species. This could aid species selection for urban tree planting. One global need for research communities, both international and national are fully understanding of pollutant characterization and mapping of urban systems, settlement site in general. An integrated advance to urbanization could result in reduced air pollution and greenhouse gas emissions, thus improving human and ecosystem health and meeting urban challenges. This will improve environmental concern and contribute to develop a strategic approach to address some of the key challenges facing urban development.
Acknowledgments
I would like to thank my thesis committee, department of Physics, Imo State University Owerri. This work is in partial fulfillment for an award of degree from School of Postgraduate Studies, Imo State University Owerri, Nigeria.