Multi-Rate Production Logging in Two-Layered Environments: Production Problems Identification and Solution

International Journal of Earth Science and Geophysics
(ISSN: 2631-5033)
Volume 8, Issue 2
Research Article
DOI: 10.35840/2631-5033/7562

Article Formats
Multi-Rate Production Logging in Two-Layered Environments: Production Problems Identification and Solution
Table of Content
Figures


Tables
Table 1: Initial production data.
Table 2: Raw data (confidential, 20XX).
Table 3: Multi-rate production logging results.
Table 4: Percentage allocation of each reservoir.
References
- Guo B, Lyons WC, Ghalambor A (2007) Petroleum production engineering, a computer-assisted approach. E.S. Books.
- Economides M, Hill A, Ehlig-Economides C (1994) Petroleum production systems . Prentice Hall, New Jersey.
- Shad S, Jalilolghadr Ardabili R, Parhizgar M (2015) Production logging techniques and interpretation of resulted figure: A case study of a gas field Iran. The 4 th conference of Petroleum Engineers and the upstream industry . Teheran, Iran.
- Murkeji P (2013) Principles of production logging. Oilfield Review Autumn 3: 63-64.
- Schlumberger (1997) Introduction to production logging. Wireline and Testing 70-71.
- Jung S (2017) Integration of the production logging tool and production data for post-fracturing evaluation by the ensemble smoother. Energies 10: 1-12.
- Adam W (2016) Production-logging tools facilitate well testing in challenging environments. J Pet Technol 68: 79-80.
- Boudour Seif Eddine HS (2017) L’importance de PLT dans le programme de Water Shut-Off. Memoire, Alger.
- Song H-W, Yang G-f (2016) Multiple flow rate well testing with production logging in determining production formation dynamics parameter. Electronic Journal of Geotechnical Engineering 21: 7629-7639.
- Ilozobhie AJ, Ikechukwu ED (2018) Predicting the behaviors of multilayered reservoirs to cumulative production in a commingled zone. International Journal of Natural and Applied Sciences 92-107.
- Kaufman RL, Ahmed AS, Elsinger RJ (1990) Gas Chromatography as a development and production tool for fingerprinting oils from individual reservoirs: Applications in the Gulf of Mexico. 9 th Annual Research Conference of the Society of Economic Paleontologists and Mineralogists, New Orleans, 263-282.
- Pete H, Pelissier JC (1997) Production logging for reservoir testing. Oilfield Review 16-20.
- Economides MJ, Boney C (2000) Reservoir stimulation in petroleum production. Reservoir Stimulation, John Wiley & Sons LTD, Texas, Chinchester, USA.
- Oguamah I, Ogunkunle T, Oseh J (2015) Effect of matrix acidizing on the performance of selected Niger delta reservoirs. International Journal of Oil, Gas and Coal Engineering 3: 18-23.
Author Details
Ricardo Michael Kamga Ngankam1, Eric Donald Dongmo2, Madeleine Nitcheu3, Jules Metsebo4*, Gabriel Kuiatse1 and Sifeu Takougang Kingni5
1African Higher Institute of Managerial and Technological Education, Douala, Cameroon
2Department of Mechanical Engineering, College of Technology, University of Buea, Buea, Cameroon
3Department of Basic Scientific Teaching, School of geology and mining engineering, University of Ngaoundere, Cameroon
4Department of Hydraulics and Water Management, National Advanced School of Engineering, University of Maroua, Cameroon
5Department of Mechanical, Petroleum and Gas Engineering, Faculty of Mines and Petroleum Industries, University of Maroua, Cameroon
Corresponding author
Jules Metsebo, Department of Hydraulics and Water Management, National Advanced School of Engineering, University of Maroua, P.O Box 46 Maroua, Cameroon.
Accepted: December 15, 2022 | Published Online: December 17, 2022
Citation: Ngankam RMK, Dongmo ED, Nitcheu M, Metsebo J, Kuiatse G, et al. (2022) Multi-Rate Production Logging in Two-Layered Environments: Production Problems Identification and Solution. Int J Earth Sci Geophys 8:062.
Copyright: © 2022 Ngankam RMK. This This is an open-access article distributed under the terms of the Creative Commons Attribution License, which permits unrestricted use, distribution, and reproduction in any medium, provided the original author and source are credited.
Abstract
Multi-rate production logging tools (PLTs) are used in this paper to identify the reasons of decreased of the overall production found eight months after the beginning of production in the well “X” (crossing two reservoirs) located in the Rio del Rey basin. PLTs are developed to assist with allocation of production to different zones as well as diagnosing the production problems. This is a new method used to account the productivity of each zone in multilayered environment with a commingle production. This paper quantifies the production of each reservoir, to identify which R1 reservoir is producing less than R2 reservoir and finally to provide an accurate solution to enhance production. To achieve these goals, it is necessary to use raw data obtained from PLTs, two softwares (PIPESIM and EXCEL) and the multi-rate production logging technique. The results show that the upwards reservoir is producing less (contributing at 4% of overall production) than the downwards one. The performance analysis of this reservoir reveals a higher wellbore pressure and it is due to wellbore restrictions coming from fines migration, paraffin, scales or sand deposits. The recommended solution for these problems is a stimulation by a matrix acidizing treatment which will clear the wellbore damage zone.
Keywords
Production logging tools, Enhance production, Performance, Reservoirs, Wellbore restrictions, Matrix acidizing
Introduction
Petroleum production engineering is a part of petroleum engineering that attempts to maximize and optimize oil and gas production in a cost-effective manner [1]. To attain such a goal, production engineers have to understand the well, diagnose well problems, provide accurate solutions, monitor the fixes and evaluate the results [2]. These well problems tend to decrease the overall production. Reservoir management and well production enhancement rely on gathering accurate reservoir and well data. Such characterization can be done by means of different tools and methods. An example of such methods is the production logging technique [3]. Production logging is the continuous recording of one or more in-situ parameters that describe the behavior and nature of fluids around the wellbore during production. To properly optimize the production, it is preferable to identify where problems are and how to overcome them [4]. Although production logging techniques are used in diagnosing production problems (cross flow, channeling and casing leaks) they are also used to assist in predicting production allocation in multi-layered environments [5]. In multi-layered reservoirs, it could be difficult to identify parameters of each reservoir without using multi-rate production logging and pressure transient tests. This work deals with a two-layered production well where the overall production tends to decrease as quick as predicted. One of those layers is not producing as expected that why running production logging tools is essential to diagnose problems responsible of the low productivity in order to provide an accurate solution. Faced with this situation, many assumptions are made: The low productivity of well could be due to a channeling behind the casing. It may be due to a near wellbore damage (formation damage) or restrictions in wellbore (sand, scales and paraffin). An overestimation of reservoir pressure and permeability can also explain the low productivity of well. Main objectives of this work are: Quantify the liquid contribution and productivity index of each layer that will help to determine which layer is producing less than other. Determine the reasons of low production and provide a proper solution. These objectives will be achieved by recording pressure, temperature and down hole flow rate; analyzing and interpreting those data with EXCEL and PIPESIM softwares.
Use of production logging to determine water phases and the flow of oil and/or gas is fundamental to understand well production problems and to design remedial solutions. Most companies around the world are using it for tremendous reasons. Although production log are mostly used to identify down hole problems, there can also be used for post-fracturing evaluation. A post-fracturing evaluation is essential to optimize a fracturing design for a multi-stage fractured well located in unconventional reservoirs. To accomplish this task, a PLT can be utilized to provide the oil production rate of each fracturing stage [6]. The PLT can also facilitate well testing in challenging environments as shown in the Puguang gas field, the second-largest gas field in China. Well testing using production-logging tools has been introduced in this field and has been of tremendous benefit to the operator in identifying the inflow zones and in performing well test analysis [7]. In order to locate water entries in two wells at the Haoud Berkaoui field [8] shows the importance of PLT in the water shutoff program. It is well known in the literature that all production logging operations have their general purposes but in multi-layered environments the challenges and purposes become different. It must be noted that this work is not the sole piece of achievement on multi-rate production logging. For instance Song and Yang [9] worked on multiple flow rates well testing with production logging in determining production formation dynamics parameter. In order to quantify the liquid contribution and the productivity index (PI quantifies the potential or the ability of a layer to produce hydrocarbon at a profitable rate) of each layer, traditional running methodologies which tend to use production logging in well testing and for evaluation of a stimulation treatment are limited. That is why this subject deals with an uncommon methodology known as multi-rate production logging (repeated logging while flowing, at different rates).
This paper is structured as follows: Section two introduces the presentation of materials and methods used in this paper and section three provides results obtained and discussions section four deals with the conclusion.
Materials
To achieve the goals of this paper, it is necessary to use data (raw data of pressure, temperature and spinner value with time), tools (PIPESIM and EXCEL softwares) and methodologies (multi-rate production logging method, nodal analysis of the reservoir and selective inflow performance): The multi-rate production logging is a method in which production tools or sensors (flow meter, gradiomanometer, noise log, pressure and temperature logs) are running in hole simultaneously to quantify corresponding parameters at various production rates. These parameters are important to understand the behavior and the fluids profile during production in one hand and to identify some production problems. Nodal analysis is a well-known technique in the petroleum industry intends to determine the most reliable data of completion likely to influence the oil production. For some confidential reasons, the well (located in the Rio del Rey basin) on which this study is conducted is called “Well X” and production layers or reservoirs are named R1 (layer 1) and R2 (layer 2).
Data acquisition
The pressure data are accurately recorded by typically using pressure gauges (down hole manometer); temperature data was gathering through temperature sensors; down hole flow rates are acquired by spinner flow meter. Before running in hole PLS, all tools are examined and calibrated by making upward and downward passes at varying logging speeds. While running in hole with a constant velocity, every particular tool is recording its intended parameter at a specific time rate (every 5 seconds for this case study). This operation is conducted from 08:01:47 A.M. up to 08:38:32 P.M. the 08 April 20XX. The key objectives of gathering those data are to quantify the producing contribution of each reservoir; to gauge the static pressure per layer and finally to evaluate the PI of each layer in one hand and for the commingled layers in other hand.
Well data
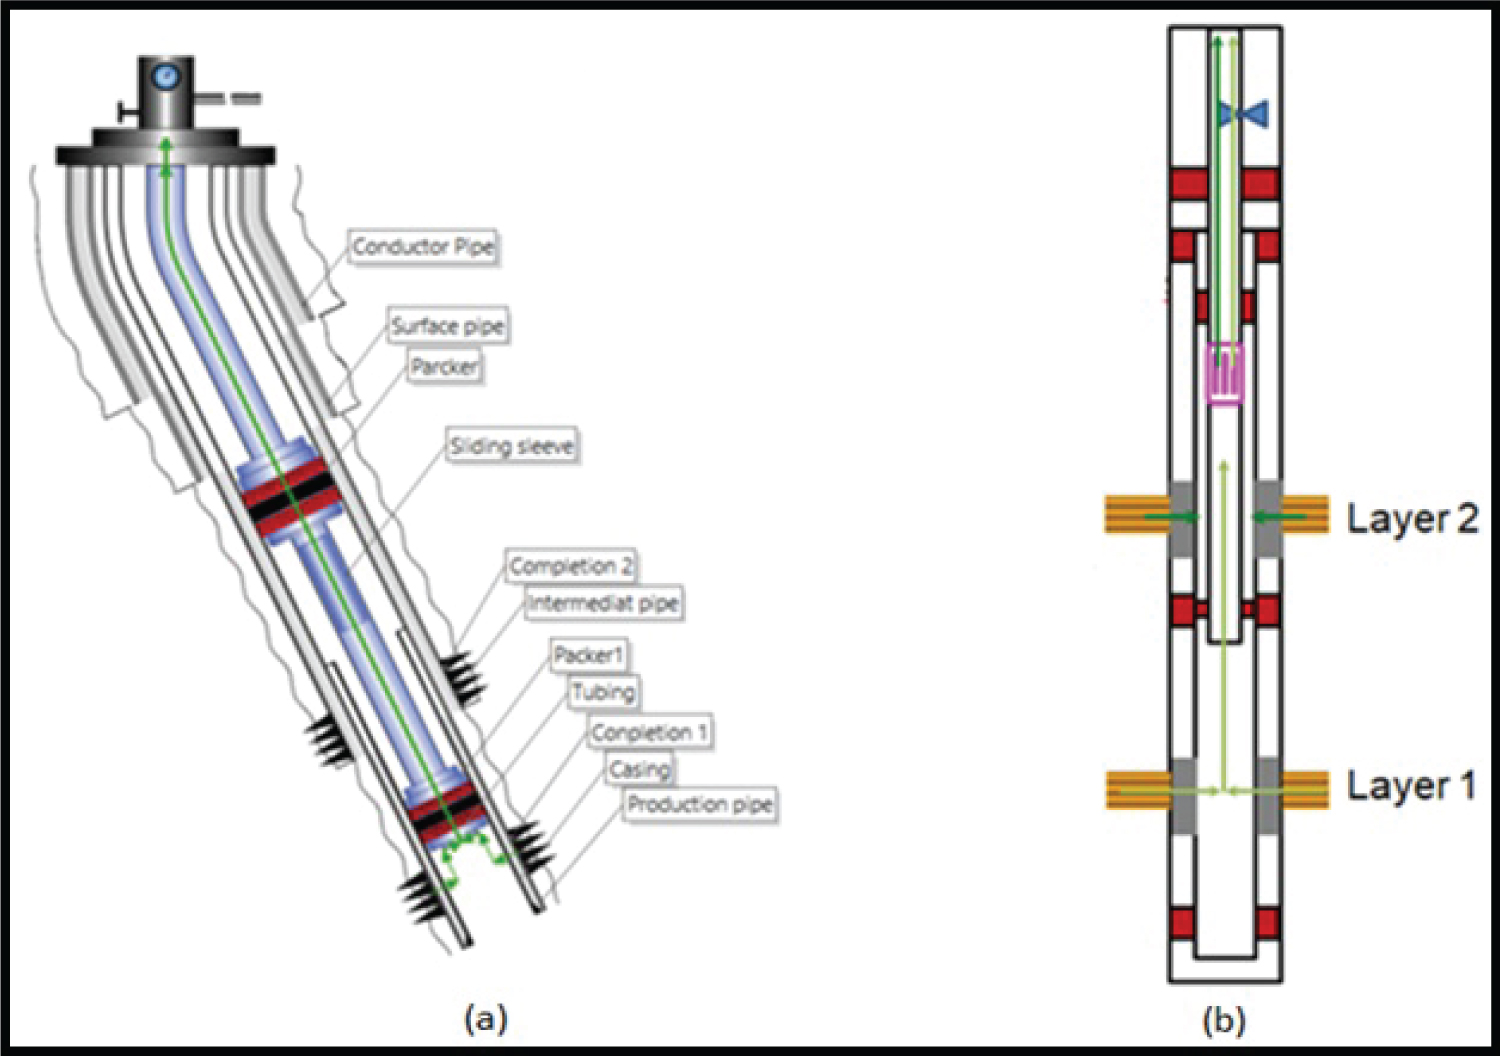
The well “X” is drilled in an offshore environment up to 2000 m true vertical depth subsea (TVDSS). Slightly deviated (50°) and equipped with a selective completion. The well architecture consists of conductor pipe, surface casing, intermediate casing, production casing and production tubing. Two packers are set before and after the sliding sleeve door (SSD) to isolate each zone from cross flow. A subsurface safety valve is also installed to complete the well in case of emergency. A well head (not seen on the well profile) with its diverse valves is set to control the well for any kind of operation. The well is producing oil from two numerous layers and commingled from SSD as seen on the well profile of Figure 1.
Production data
Well X started production in August and it is important to specify that the initial contribution of each layer was quantified during well testing and some data are succinctly summarized in Table 1. This operation of multi-rate production logging survey is carried out to accurately quantify the contribution of each reservoir during a commingle production, identify problems and provide corrective actions to enhance production if needed.
Raw data
The PLT started recording data at the extremely early running time from the top of the well up to the bottom hole. The pressure, temperature and spinner tools were run in hole, and raw data (about 17300) have been recorded and the most important section of data collection is presented in Table 2. It should be noted that section from 08:02:02 A.M. up to 01:30:37 P.M. is not presented because it is time of devices calibration. It is capital to know that calibration process is carried out to set thresholds of each recorded parameters.
Results and Discussions
The purpose of this section is firstly to present the results obtained from the data, tools and methodologies used in this paper. Secondly, discussions of the obtained results are presented.
Results
To properly quantify the contribution of each reservoir, the spinner flowmeter is run at two different crucial positions (positions 1 and 2) as shown in Figure 2.
In Figure 2, the position 1 (below SSD) is to quantify production of R1 and position 2 (above SSD) for the production of commingled reservoirs. These two positions are preferred because they will bear accurate results for this study. If position 1 was barely down from selected one, values of pressure, temperature and spinner would be higher than those obtained (this is because of pressure and temperature gradients). If position 2 was too upward from the effective position, it would not offer response of fluid barely commingled. Spinner is combined with temperature log to identify which kind of fluid is coming from each layer.
The notable results of the study encompass the liquid contribution per layer, the productivity index of each layer and problem identification as well as its solution.
Liquid contribution per layer: Quality check (QC) of spinner response: As shown in Figure 3, the relationship between flow rate and revolution per second is linear whether above or below SSD.
Figure 3 confirms that the spinner experiences a usual response (the rotational speed of the blade in revolutions per second or RPS is linearly proportional to the flow rate in the barrel per day or bpd) and it will be employed for further analysis to correlate flow rate with RPS above and below SSD. Figure 4 shows responses of all run tools in function of time.
In Figure 4, every parameter change with time: Pressure and temperature are quite constant from 500 min up to 1050 min. At 800 and 920 min, pressure and spinner logs significantly increase and decrease (spinner) and decrease only (pressure). The response of the spinner itself (Figure 4b) is presented in function of the perforations of two reservoirs. Multi-rate production logging interpretation is faithfully depicted in Figure 5.
According to Figure 5, it appears that R1 is delivering almost the overall cumulative production. R2 contributes for a little percentage of the production. Indeed, for a surface flow rate of 3840 barrels per day (BPD) (red color) spinner flow meter below SSD has a significant value (41 RPS ≈ 3362 BPD) and above SSD (which is for two reservoirs) is about 46 RPS (this means R2 is contributing for 5 RPS ≈ 478 BPD). When surface flow rate is increasing up to 4460 BPD (green), the value of the spinner below SSD is 49 RPS (≈ 3864 BPD) and above SSD is 56 RPS (this means R2 is contributing for 7 RPS ≈ 596 BPD). Finally for a flow rate equals to 5180 BPD (blue), R1 contributed for 58 RPS (≈ 4520 BPD) whereas R2 contributed for 8RPS (≈ 660 BPD). Table 3 shows in details some values of pressure, spinner, temperature and surface flow rates obtained during multi-rate production logging operation.
The contribution of each layer is clearly outlined in Figure 6, obtained from initial analysis combined to PL data.
In Figure 6 obtained from spinner flow meter, it can be remarked that from the beginning of the well production in August, R1 contributed to 30% of overall production. Towards October it decreased to 20% and R2 assessed to 80%. The percentage of R1 tended to decrease up to about 4% of the total oil production. Table 4 illustrates the fluid percentage contribution of each reservoir during multi-rate production logging operation.
In Table 4, it is discovered that for a well flow rate of 3840 BPD, R2 is contributing at 12% of fluid. The analysis of performance (by using flow rates and pressures obtained from PL) of each layer can help to determine causes of such anomaly.
As shown from results above (especially Figure 5 and Figure 6), R2 has a problem that is why performance analysis will be focused on that layer. For an overall surface flow rate of 3840 BPD (R2 is contributing at 478 BPD). Figure 7 illustrates the inflow or IPR (representing what the reservoir can deliver in terms of oil/gas quantity) and outflow or VFP (representing what the well can deliver in terms of fluid quantity) relationship.
In Figure 7, the operating point (496 BPD) is the optimal flow rate (reservoir deliverability) this reservoir can supply. The intersection of outflow line with the vertical axis represents an approximation of the bottom hole pressure (3775 PSI). The more is the wellbore pressure, the less will be flow rate. The results of the productivity indexes will generate information about the most enormous quantity each layer can produce.
As it is possible to notice, the analysis of multi-rate production through spinner flow meter, pressure and temperature gauges showed the liquid contribution of each layer. The multi-rate production logging technique showed the productive contribution of each layer. It appeared that from the beginning of production in August, R2 was producing 30% of the combined production. And this value decreased with time up to 4% in April of the next year. There are other techniques to determine the individual contribution of the layer in a muti-layered environment. Ilozobhie and Ikechukwu [10] worked on the determination and prediction of individual contribution of layers to combined production in a well in the Niger Delta, Nigeria. They were dealing with five layered reservoirs in a same well and wanted to determine the lowest productive layer. To achieve this tedious task, they used MBAL software and obtained accurate performances as well as production predicting of each layer. But most of the production results like productivity indexes of each reservoir have not been obtained. Unlike the method employed in this work, the method used by Ilozobhie and Ikechukwu [10] required petrophysics and sedimentary data of 5 layers. Kaufman et al. [11] developed a geochemical method for allocating commingled production within single well from multiple pay zones. The method has been based on the assumption that oils from separate reservoirs or separate parts of a reservoir bear different chemical signatures or distinctive chemical fingerprints. This method has been achieved using multivariate statistical comparison of absolute concentrations of oil components or chromatogram fingerprints of oil from core or cuttings samples from the production well. This geochemical method for calculation of the contributions of the single layer has been used when conventional PLT techniques have not been suitable.
Liquid productivity index per layer: Figure 8 shows the PI of the two reservoirs (the ability to supply oil).
The PI of Figure 8 is obtained on the basis of three flow rates fixed early for multi-rate production logging operation. It appears on the red line that the maximum flow rate R2 can reach is 1000 BPD meanwhile R1 (green interrupted line) can deliver up to 4600 BPD. The commingle PI shows how much the well can deliver as fluids (water and oil).
A method called SIP has been performed to get productivity indexes of each layer. PI of two reservoirs confirmed the mediocre ability of R2 to produce oil (under 1000 BPD). Meantime, the PI of R1 showed that it can produce up to 4600 BPD. The commingle PI showed that the well X can deliver around 5200 BPD. Pete and Pelissier [12] developed two economical methods of using production logging tools to perform multilayered reservoir tests: Selective inflow performance and layered reservoir testing. As this work they put their well through a stepped production schedule with various surface flow rates, while production logging tools measure the bottom pressure and flow profile at the end of each steps. The main difference from their study and this work is they performed multilayered transient tests which provided additional information (wellbore storage effect, skin, permeability and each layer extent). Therefore, performing a transient test while measuring the contribution of each layer is more beneficial. Economides and Boney [13] revealed the link between productivity index and skin effect: Maximize the productivity index by reducing the skin effect. That is why it was significant to determine the PI of each layer to link it to skin effect which tremendously affects well production.
Problem identification and solution: The problem found from these obtained results and its solution is present in this subsection.
Problem identification: After all those above analysis, as it is possible to notice that R2 is the one having problems. Analysis of its performance has shown an abnormally high wellbore pressure. This significant value is linked to a restriction around the wellbore. Because restrictions around wellbore tend to increase the wellbore pressure. These restrictions increase the skin value and could be due to scales deposits, fines migration, and paraffin or sand deposits. These problems predominantly occur when the formation near the wellbore has been damaged by the drilling, completion process or when producing at a high drawdown (what causes the formation to crumble and jammed perforations). Figure 9 confirms these statements: Comparison between old and new IPR.
In Figure 9, it can be clearly observed that IPR of R2 decreased and this change mostly occurs when skin at the wellbore vicinity increases. A reliable solution is needed to overcome such problems in order to maximize the oil production.
Solution: Encountering this kind of problem, there are customarily two solutions known as well stimulation: Matrix acidizing and acid-fracturing treatments. The most recommended economical and suitable solution for this kind of problems is a matrix acidizing. Well stimulation is an intervention performed on a well in order to increase its productivity by improving the flow of hydrocarbons from the reservoir to the well through the wellbore device installed. This technique involves the injection of an acid solution (hydrofluoric and/or hydrochloric acids) into the formation in order to dissolve some of the minerals, paraffin, fines, scale deposits present, and hence recover or increase the permeability in the near-wellbore vicinity. In this case, a temporary plug will be set below SSD to isolate R1 before pumping acids in R2. It should be noted that such techniques are performed when the reservoir retains a considerable number of hydrocarbons to recover expenses. It should also be substantial to present a forecasting of the contribution of each reservoir after stimulation treatment. The lack of geological data has not allowed a simulation of acidizing treatment and furthermore to forecast the performance in R2 after the stimulation process.
The problem was identified from results obtained on reservoirs contribution and performance analysis of R2. As shown upwards, the problem for the well X is coming from R2. Reservoir performance analysis has shown that R2 has wellbore restrictions which are caused by scales, fines and sand or paraffin deposits. These deposits increase skin by reducing permeability at the wellbore vicinity. They jammed perforations and limited hydrocarbons to flow. The most recommended solution in this case is an acidizing treatment. Understanding stimulation requires understanding the fundamental issues of petroleum production and the position and applicability of the process. Economides and Boney [13] recommended like in this work to deal with skin with stimulation: Maximizing the production by reducing the skin effect constitutes the notion of stimulation. Oguamah, et al., [14] performed an acidizing on selected wells from the tertiary sandstone reservoirs in the Niger delta. The results showed that the matrix acidizing treatment is proven to be the best stimulation technique employed in recent years to remove near wellbore damages and invariably increase productivity. This is to show that acidizing treatment as this work proposed have been performed and yielded satisfactory results. Performing this operation requires a broad knowledge on mineralogy of the formation to be acidified.
Conclusion
The objectives of this paper were to quantify the production allocation of the two layers in well X, to quantify the ability of each layer to deliver oil and find out reasons of the problem as well as a suitable solution to enhance production. Production logging tools were used to determine production problems when anomalies occurred in the surface (suddenly drop of production, decrease/increase of flow rate). Pressure and temperature sensors were used to gauge the pressure and temperature at any point in a well. It is urgent to mention that PL tools have the advantage of being used both in distinct and multiple completions. As results, it was detected that layer 2 is producing less than the first one. And determination of productivity indexes corroborates that result. It was equally found that this problem is due to sand, paraffin and scales deposits or fines migration. It was recommended that the acidizing treatment is ideal to perform in such cases. Designing the program of the matrix acidizing of reservoir 2 should be an interesting topic of research.
Data Availability
Data used to support the findings of this study are included within the article.
Compliance with Ethical Standards
Conflict of interest on behalf of all the authors, the corresponding author declares that there is no conflict of interest in this research article.