Using IPSOM Technique to Electrofacies Analysis of Yamama Formation in Faihaa Oil Field

International Journal of Earth Science and Geophysics
(ISSN: 2631-5033)
Volume 9, Issue 1
Research Article
DOI: 10.35840/2631-5033/1865

Article Formats
Using IPSOM Technique to Electrofacies Analysis of Yamama Formation in Faihaa Oil Field
Table of Content
Figures
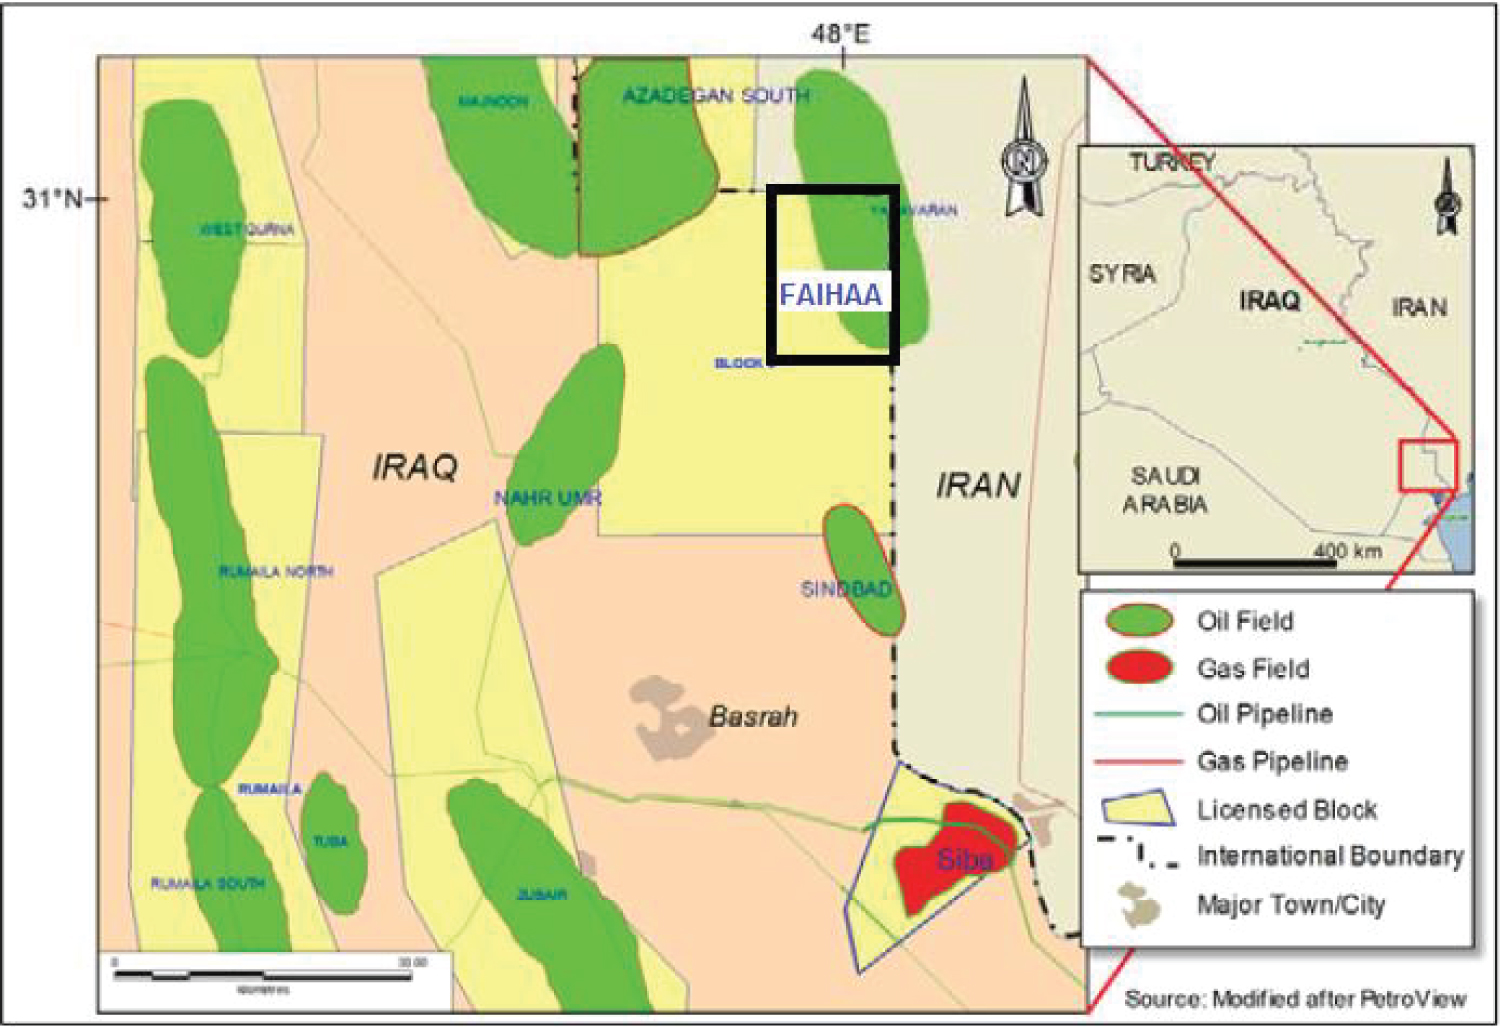
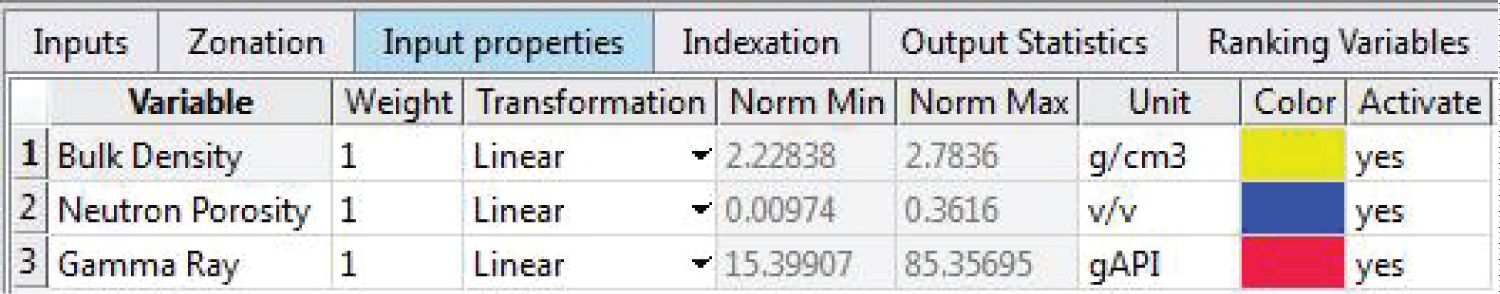
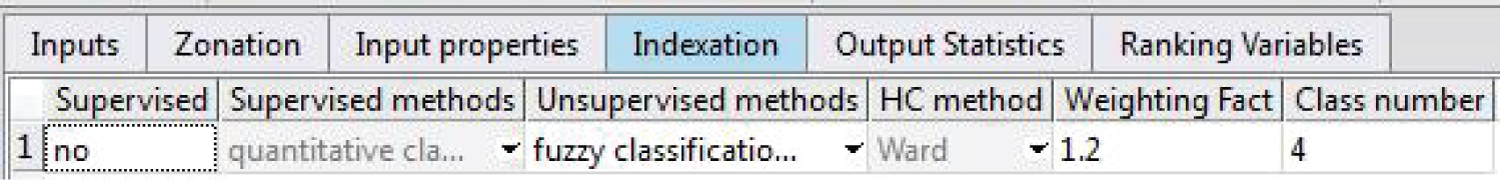
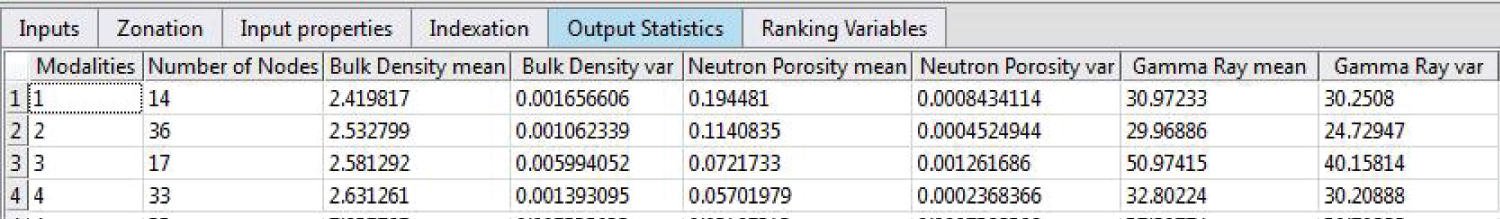
Figure 6: Electro-facies model for....
Electro-facies model for Yamama Formation by IPSOM technique.
Tables
Table 1: Overview of the electrofacies description.
References
- Sadooni FN (1993) Stratigraphie sequence, microfacies, and petroleum prospects of the Yamama formation, lower Cretaceous, Southern Iraq. AAPG Bulletin 77: 1971-1988.
- United Energy Group Limited (2018) Complete person's report on the oil, gas and condensate assets of Kuwait energy plc. Published report.
- Sharland PR, Archer R, Casey DM, Davies RB, Hall SH, et al. (2001) Arabian plate sequence stratigraphy. GeoArabia. Special Publication. 2, Gulf Petroleum Bahrain 374.
- Jassim SZ, Goff JC (2006) Geology of Iraq. Published by Dolin Canada sedimentary basin, AAPG Bulletin 79: 1698-1720.
- Serra O (1984) Fundamentals of well log interpretation. The Acquisition of logging data. Development in petroleum science, 15A, Elsevier, Amsterdam, 1: 440.
- Schlumberger (2007) Techlog tutorial, IPSOM-characterization of Core/Log data. Published Tutorial. 2-3.
Author Details
Zuhoor J Younis Al-Aani*
Department of Oil and Gas Engineering, College of Oil and Gas Engineering, Basra University of Oil and Gas, Basra, Iraq
Corresponding author
Zuhoor J Younis Al-Aani, Department of Oil and Gas Engineering, College of Oil and Gas Engineering, Basra University of Oil and Gas, Basra, Iraq.
Accepted: February 15, 2023 | Published Online: February 17, 2023
Citation: Al-Aani ZJY (2023) Using IPSOM Technique to Electrofacies Analysis of Yamama Formation in Faihaa Oil Field. Int J Earth Sci Geophys 9:065.
Copyright: © 2023 Al-Aani ZJY. This This is an open-access article distributed under the terms of the Creative Commons Attribution License, which permits unrestricted use, distribution, and reproduction in any medium, provided the original author and source are credited.
Abstract
Based on the analysis of well logs, Yamama Formation in Faihaa field was divided into four reservoir units (YA, YB, YC, and YD), in this study have been predicted and classification electrofacies of the Yamama Formation by using the IPSOM module of Techlog software into four facies: High porosity with high reservoir quality, Medium porosity with middle reservoir quality, low porosity with low reservoir quality, and poor porosity or cap rocks by training open well logs: Density, neutron porosity, and gamma-ray using a fuzzy classification method. The upper part of the Yamama formation represented by the YA unit is considered the best unit which contains a good reservoir quality and a good percentage from high porosity facies as compared with the rest of the formation units.
Keywords
IPSOM, Electrofacies, Yamama Formation, Faihaa Field, Techlog software
Introduction
The Yamama Formation, which was deposited during the Late Tithonian-Hauterivian sequence and is a component of the Thamama group, is regarded as one of the most significant lower cretaceous carbonate formations and the main productive reservoir in the south of Iraq [1]. According to the analysis of well logs, the Yamama Formation is composed of four main units (YA, YB, YC, and YD), which are separated by three main caps.
Study Area
Faihaa field is an anticline fold in the Zubair subzone in the southeastern part of the Mesopotamian basin. in the north-east of Block 9 north of Basra in southern Iraq, approximately 20 kilometers north of Basrah, adjacent and parallel to Iraqi and Iranian borders. Faihaa field borders with Majnon field in the north, Sindbad field borders the south, Nahr Omar field borders the west, and Iranian Hosseinieh field borders the east [2] as shown in the Figure 1.
Tectonic Setting and Stratigraphy
The Yamama Formation has been deposited in the Arabian plate as part of the late Tithonian-Turonian mega sequence (AP8) in a large new intra-shelf basin with a new phase from the ocean floor spreading in the southern Neo-Tethys [3]. When the Southern Neo-Tethys opened, a narrow microcontinent drifted away, a new passive margin was formed as along the northeastern edge of the Arabian plate. The Rutbah uplift formed the Mesopotamian basin's western margin, while a carbonate ridge formed in the northeast margin along the northern passive margin of the southern Neo-Tethys. The eastern margin was possibly formed by a carbonate ridge that bordered the continental margin along the southern Neo-Tethys [4]. The Yamama Formation in southern Iraq is a carbonate heterogeneous reservoir, which formed due to overall regressive cycles, with reservoir quality significantly improving at the top of the formation. The Yamama Formation is composed primarily of limestone, with some of the shale and dolomitic limestone, which deposited in environments of oolitic shoal (inner shelf) and deep shelf that probably dominated by highs structural in carbonate ramp. The Yamama Formation covered conformability by the Ratawi Formation in the top and Sulaiy Formation in the bottom, both of each composed mainly of limestone [4]. The Yamama Formation has three depositional cycles: the top cycle has oolitic grain stone inner ramp facies that pass down into finer-grained peloidal facies, the middle-ramp (bioclastic, coral, stromatoporoid) packstone-wackestone, and the outer ramp bases cycle has thick gray shale with chalky micrite stringers [1].
Aims of the Study
Build electrofacies model and evaluate reservoir equality of Yamama Formation at Faihaa oilfield using IPSOM in Techlog.
Materials and Methods
1. The data collected from the studied well are gamma ray, bulk density and neutron porosity logs were training within IPSOM technique to predict electrofacies in Yamama Formation.
2. Techlog software was used to evaluate reservoir equality using IPSOM technique.
Electrofacies Model using IPSOM Technique
The sedimentary units characterized and defined by wireline logs are referred to as electrofacies or logfacies [5]. Logfacies evaluation and analysis is the most essential tool in the oil and gas industry, studying the sedimentological and depositional environment of the bearing rock, especially when wireline logs are the only data available [5].
The model of electrofacies was built using IPSOM within Techlog. The IPSOM (self-organizing maps) module depends on a neural network model developed for geological interpretation in order to identify and classify facies from well logs [6]. The fuzzy classification method was chosen to build the electrofacies model in IPSOM after it was found to produce satisfactory results. The method starts after input and defining the variables bulk density (ρ), neutron porosity (N-PHI), and gamma ray (GR) logs that will be used for classification, as well as the number of groups or facies Then it enters a loop in which it calculates the barycenter of each group and then finds a probability value between each node with each group and as (Figure 2, Figure 3, Figure 4 and Figure 5) which clarify the input of variables with indexation variables of IPSOM module and statistics of groups. Table 1 interprets the depositional environment of facies from 1-4.
Results
The Yamama formation consists of facies unevenly, Figure 6 clarify facies distribution thought the Yamama units, each one of these units is characterized by different facies which were summarized below:
1. YA unit: The upper part of this unit consists mainly of shoal deposits (Facies 1) with porosity PHI is greater than 15 and GR is less than 30, while lower part consists mainly of outer ramp deposits (Facies 4) alternating with thin beds from restricted marine deposits (Facies 3).
2. YB unit: Outer ramp deposits (Facies 4) dominated unit when porosity PHI is less than 0.05 and GR is greater than 30 with thin beds from restricted marine deposits (Facies 3) and the upper part from this unit consists from of shoal deposits (Facies 1).
3. YC unit: It consists mainly from restricted marine deposits (Facies 3), when PHI from (0.06-0.09) and GR is greater than 40 with beds from Outer ramp deposits (Facies 4), thin beds of shoal deposits (Facies 1) and open marine deposits (facies 2) in top of unit.
4. YD unit: Open marine deposits (Facies 2) dominated unit when porosity PHI from (0.1-0.15) and GR is less than 30 with beds from Outer ramp deposits (Facies 4) and very thin from shoal deposits facies.
Conclusions
The upper unit of the formation represented by YA is considered the best unit with high reservoir quality which contains a high percentage of high porosity facies (facies 1), while the middle part of the formation YB & YC has a low reservoir quality because it contains a high percentage of low porosity (facies 3) with few from high porosity facies within the high part from YB unit, and the lower part of the formation which represents by YD unit which has a middle reservoir quality with containing a high percentage of middle porosity (facies 2). Caprock, represented by poor porosity facies (facies 4) spread throughout all parts of the formation, especially in the lower part of each unit.