
International Journal of Experimental Spectroscopic Techniques
(ISSN: 2631-505X)
Volume 2, Issue 1
Research Article
DOI: 10.35840/2631-505X/8512

Article Formats
Raman and Infrared Reflection Spectroscopic Study of Mineralogical Composition of Iron-Manganese Nodules (Pacific and Indian Oceans)
Table of Content
Figures
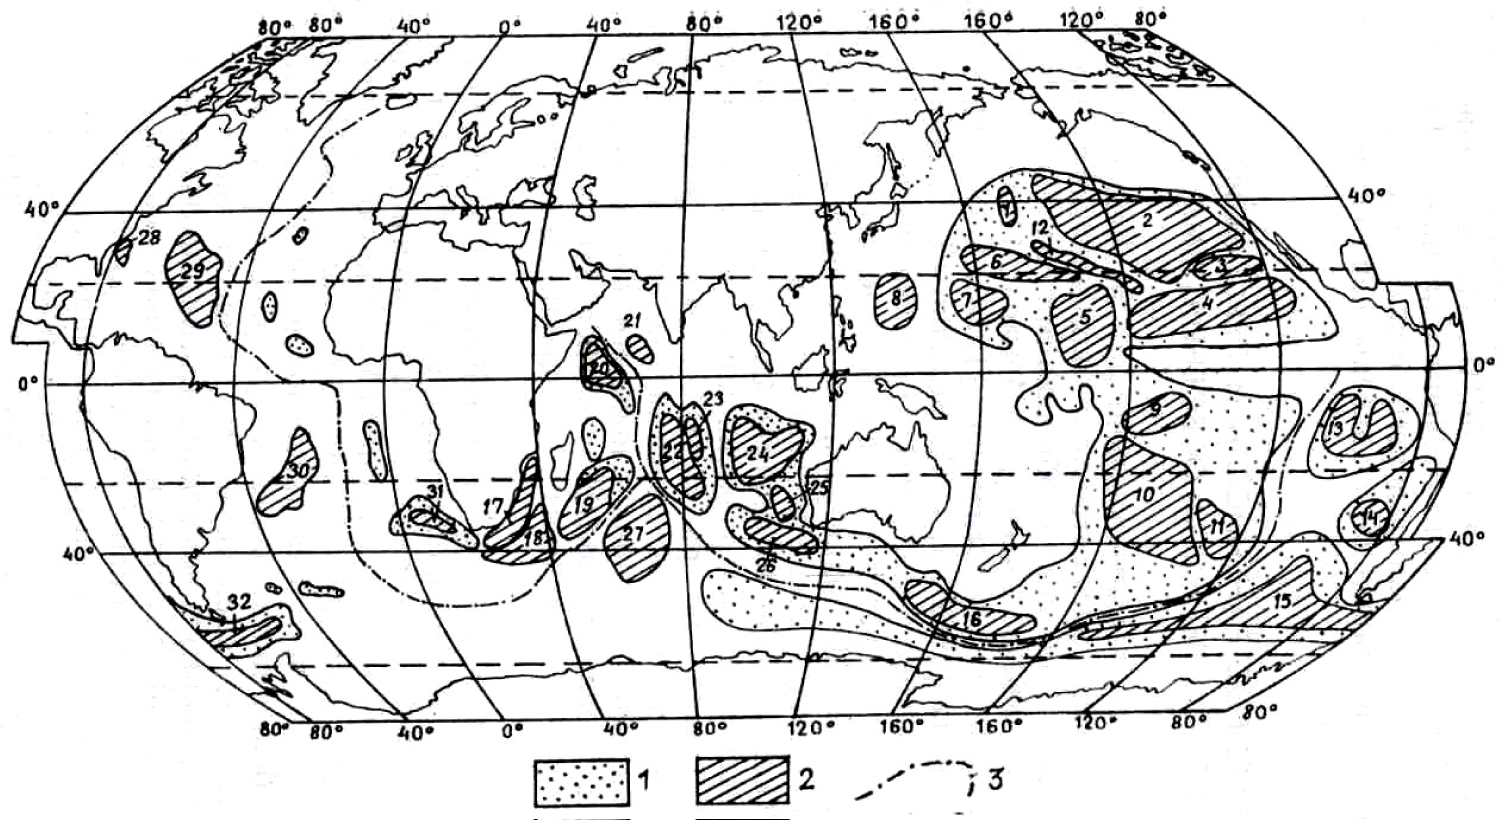
Figure 1: Distribution of the principal deposits and occurrence...
Distribution of the principal deposits and occurrence of Fe-Mn nodules in World Ocean (according to G. Baturin, 1986 with simplifications): 1) Area of extension of the Fe-Mn nodules; 2) Ore fields of the Fe-Mn concretions: 1-16 - Pacific Ocean (1- North Western, 2- North Eastern, 3- Californian, 4- Clarion-Clipperton, 5- Central Pacific, 6- Marcus-Nekker, 7- Eastern Marian and Marchal island, 8- Philippines, 9- Tuamotu, 10- South Pacific Basin, 11- South Eastern area of South Pacific Basin, 12- Hawaii, 13- Peru, 14- Chile, 15- Belinsgausen, 16- South Pacific uplift); 17-27- Indian Ocean (17- Agulias, 18- Mozambique, 19- Madagascar, 20- Somalia, 21- Arabian, 22- Central Indian Basin, 23- Osborn, 24- Western Australian, 25- Naturalista, 26- Amsterdam Basin, 27- Kroze); 28-32- Atlantic Ocean (28- Plateau Black, 29- Northern American Basin, 30- Cape Basin, 31- Brazil Basin, 32- Sea Scott Basin); 3) Axis of oceanic ridges.
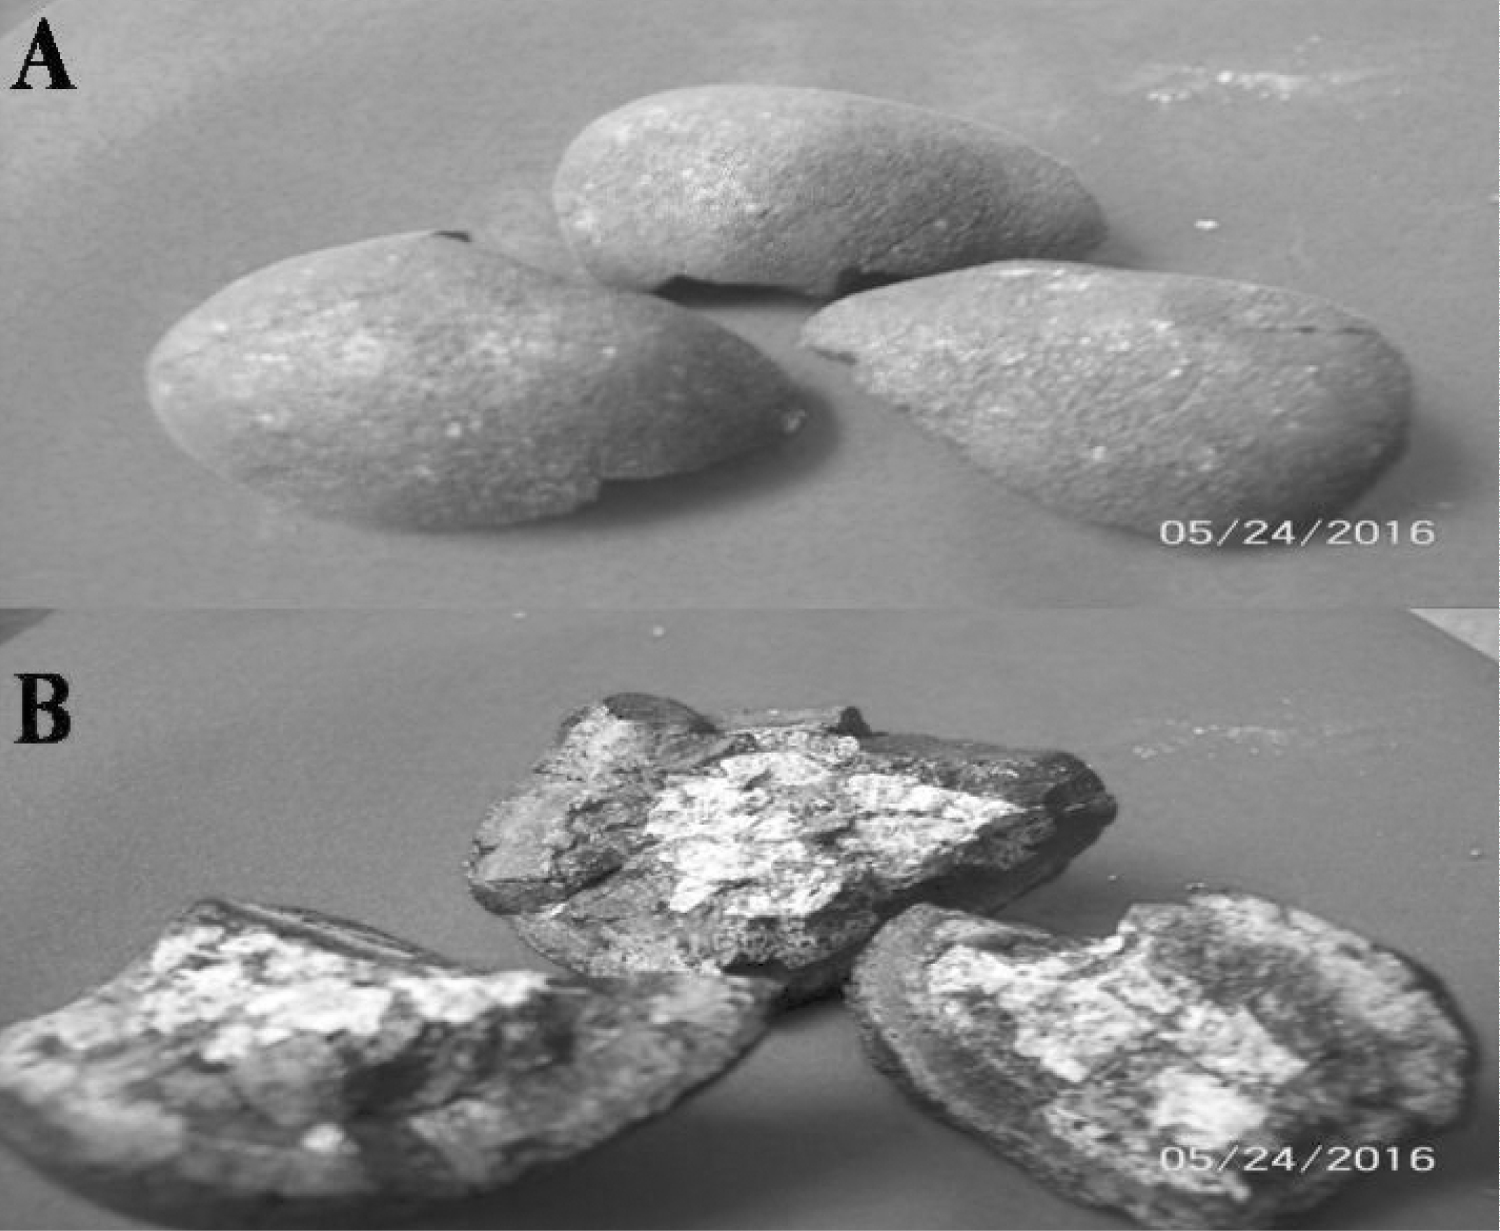
Figure 2: Typical Fe-Mn cocnretions without (A) and with (B)...
Typical Fe-Mn cocnretions without (A) and with (B) the non-metallic nuclei (Clarion-Clipperton Zone, Pacific Ocean; The approximate size of these nodule samples is 5.04 × 5.68 × 5.57 cm. Photo by M. Ostrooumov).
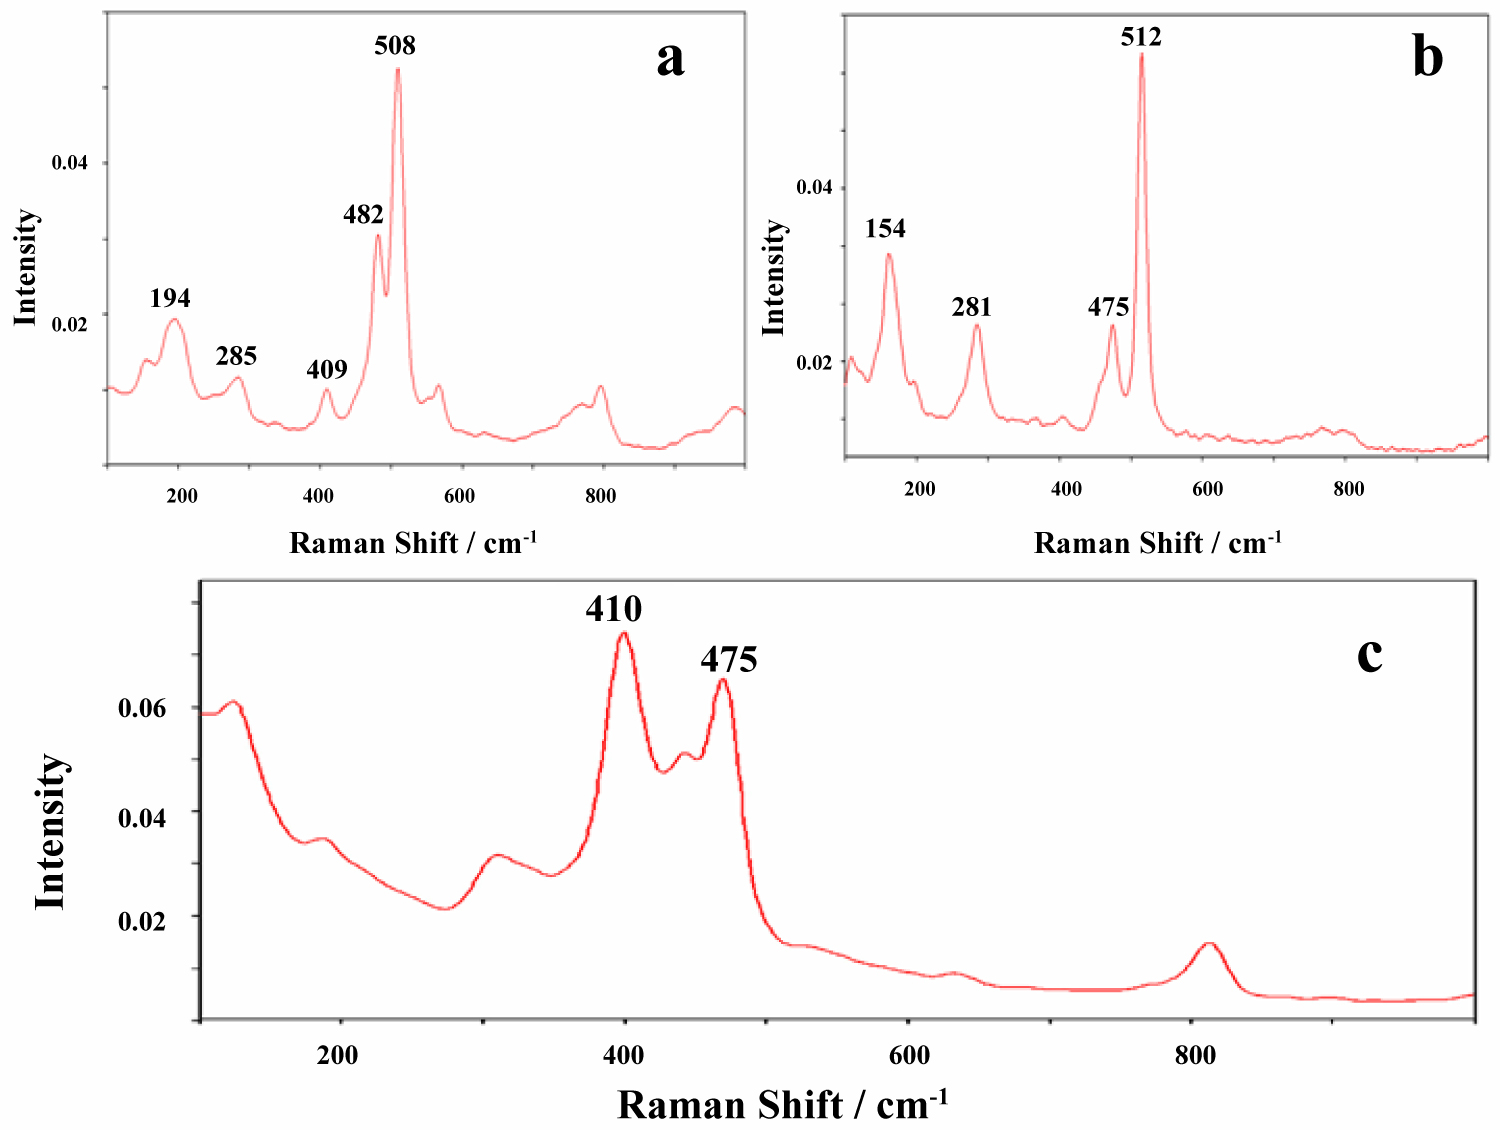
Figure 3: Raman spectra in the range 100-1000 cm-1...
Raman spectra in the range 100-1000 cm-1 of the non-metallic minerals from the non-metallic nuclei of the Fe-Mn nodules: a) Andesine-labradorite; b) Sanidine; c) Phillipsite.
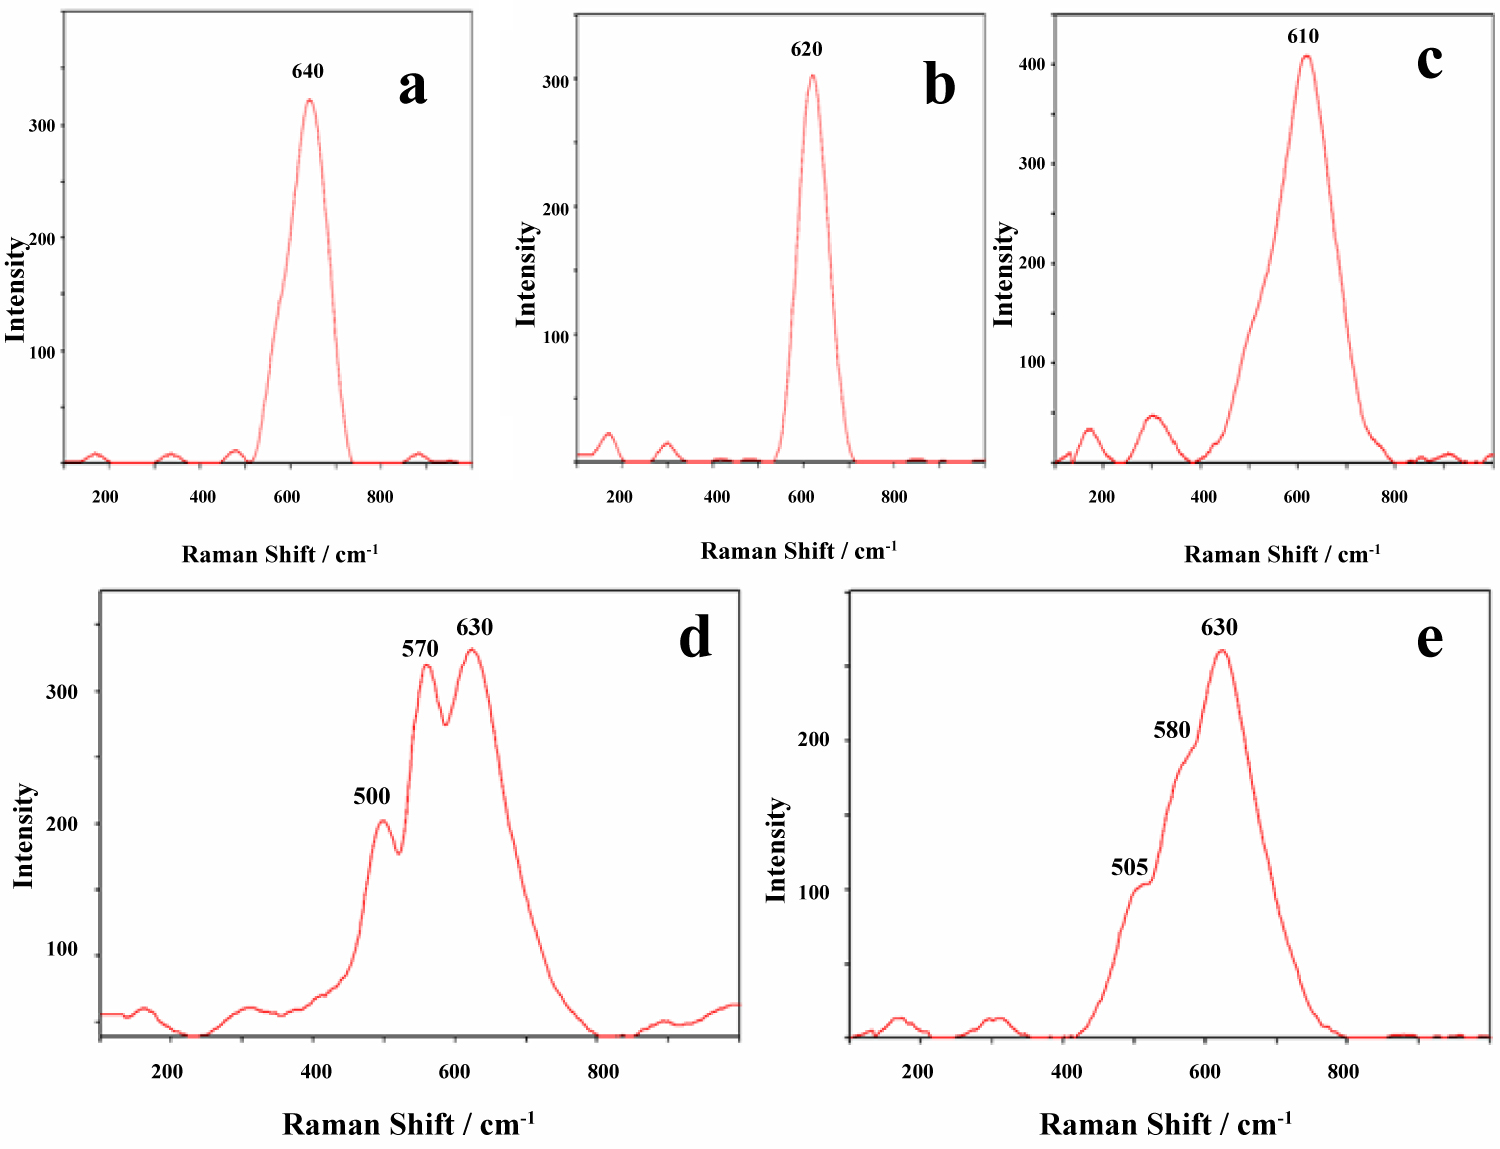
Figure 4: Raman spectra of ordered-disordered todorokite with...
Raman spectra of ordered-disordered todorokite with different degree of crystallinity (a-c) vernadite; d) and birnessite; e) Note that the band position for the ν2 mode shift towards low wavenumbers (640 to 610 cm-1) as a function of structural disorder; band broadening is caused by the low crystallinity of this mineral.
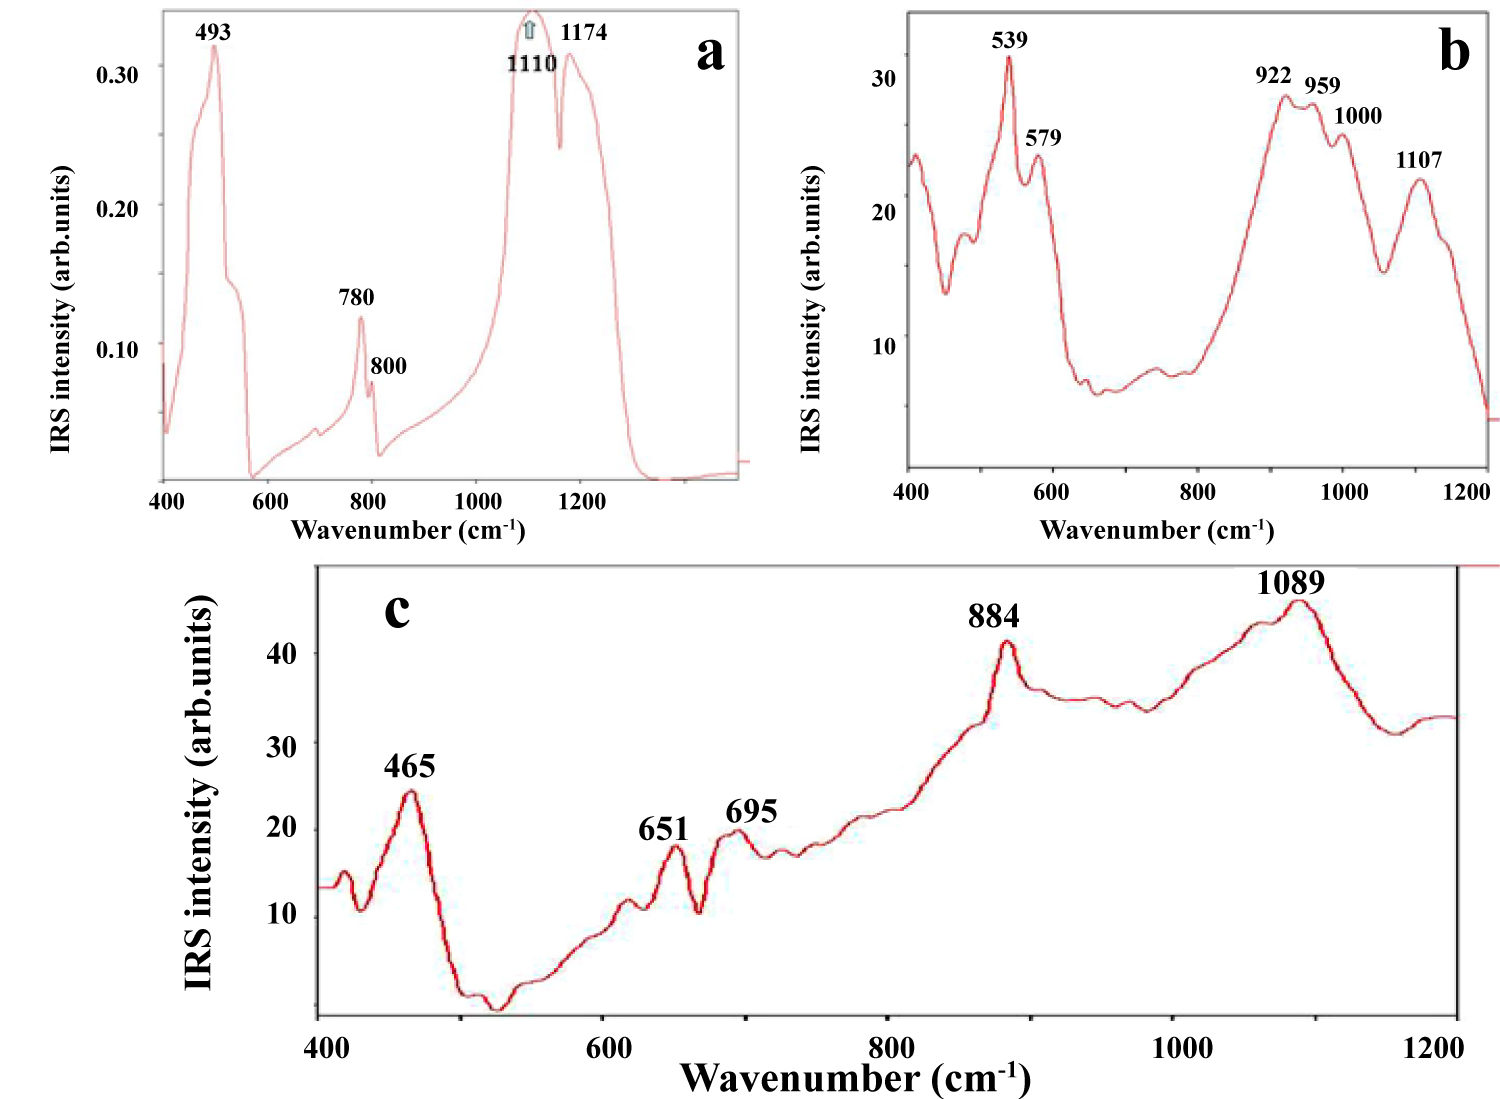
Figure 5: IRS in the range of 400-1200 cm-1 of the non-metallic...
IRS in the range of 400-1200 cm-1 of the non-metallic minerals that were found in the nuclei of nodules: a) Quartz; b) Andesine-labradorite; c) Phillipsite (Clarion Clipperton Zone, Pacific Ocean bottom).
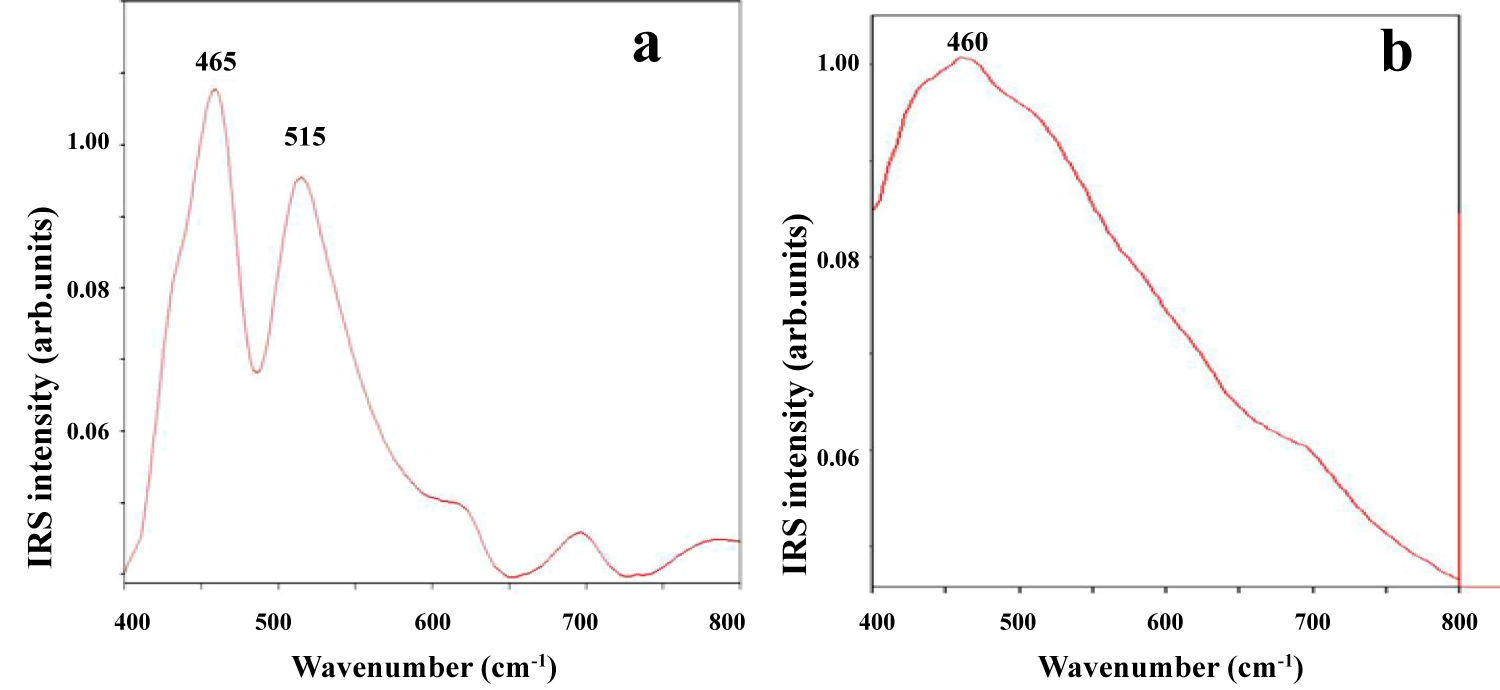
Figure 6: IRS of ordered a) and disordered; b) Variety of birnessite...
IRS of ordered a) and disordered; b) Variety of birnessite in the range 400-800 cm-1 from Fe-Mn nodules (Clarion Clipperton Zone, Pacific Ocean bottom).
Tables
Table 1: Raman peaks attribution (cm-1) for Fe-Mn concretion fragments (Pacific Ocean bottom) between 100 and 1000 cm-1.
Table 2: Raman peaks attribution (cm-1) for Fe-Mn concretion fragments (Indian Ocean bottom) between 100 and 1000 cm-1.
Table 3: IRS bands attribution (cm-1) for Fe-Mn concretion fragments (Pacific Ocean bottom) between 400 and 1200 cm-1.
Table 4: Position of Raman peak ν2 and half-width (widening - Γ) (cm-1) for well crystallized 1) Intermediate; 2) and disordered todorokite; 3) From Pacific Ocean bottom between 100 and 600 cm-1.
References
- Hein JR, Mizell K, Koschinsky A, Conrad TA (2013) Deep-ocean mineral deposits as a source of critical metals for high- and green-technology applications: Comparison with land-based deposits. Ore Geology Reviews 51: 1-14.
- Hein JR, Mizell K (2015) Ocean Minerals. In: Smith HD, Suarez de Vivero JL, Agardy T, The Earthscan Handbook of Ocean Resources and Management. Earthscan Publishers, UK, 25.
- Kato Y, Fujinaga K, Nakamura K, Takaya Y, Kitamura K, et al. (2011) Deep-sea mud in the Pacific Ocean as a potential resource for rare-earth elements. Nature Geoscience 4: 535-539.
- Hein JR, Koschinsky A (2014) Deep-ocean ferromanganese crusts and nodules. In: Holland HD, Turekian KK, Treatise on Geochemistry. (2nd edn), Oxford Elsevier, USA, 273.
- Cronan DS (2010) Manganese Nodules. In: Kart K, Turekian KK, Marine Chemistry and Geochemistry: Encyclopedia of ocean sciences. (2nd edn).
- Rona PA (2008) The changing vision of marine minerals. Ore Geology Reviews 33: 618-666.
- M Ostrooumov M (2009) Infrared Reflection Spectrometry analysis as a non-destructive method of characterizing of minerals and stone materials in geoarchaeological and archaeometric applications. Geoarchaeology 24: 619-637.
- Ostrooumov M, Gogihaitsvili A (2013) Raman and Infrared reflection spectroscopic study of pre-Columbian Mesoamerican pottery. European Journal of Mineralogy 25: 895-905.
- Marfunin AS (1995) Advanced Mineralogy. Springer-Verlag, Berlin, Heidelberg, New York, 545.
- Faulques E, Fritsch E, Ostrooumov M (2001) Spectroscopy of natural Silica-rich glasses. Journal of Mineralogical and Petrological Sciences 96: 120-128.
- Ostrooumov M, Faulques E, Lounejeva E (2002) Raman spectrometry of natural silica in Chicxulib impactite, Mexico. Comptes Rendus Geosciences 334: 21-26.
- Ostrooumov M (2007) Espectrometría Infrarroja de Reflexión en Mineralogía Avanzada, Gemología y Arqueometría. Universidad Nacional Autónoma de México, Monografías 12, Mexico, 1-89.
- Ostrooumov M (2009) A Raman, IR and XRD analysis of the deterioration on historical monuments: Case study from Mexico. Spectrochimica Acta Part A: Molecular and Biomolecular Spectroscopy 73: 498-504.
- Ostrooumov M, Hernández Bernal M (2011) Mineralogical composition of the El Pozo meteorite: A Raman, IR and XRD study. Spectrochimica Acta Part A: Molecular and Biomolecular Spectroscopy 83: 437-443.
- Ostrooumov M (2012) Avances recientes de la espectroscopía Raman en Ciencias de la Tierra. Universidad Nacional Autónoma de México, Monografías.
- Farmer VC (1974) The Infrared Spectra of Minerals. Mineralogical Society, London, 500.
- Lazarev A (1995) Vibrational spectra and structure of silicates. Moscow, 237.
- Nasdala L, Smith D, Kaindl R, Ziemann MA (2004) Raman spectroscopy: analytical perspectives in mineralogical research. In: Beran A, Libowitzky E, Spectroscopic methods in mineralogy. European Mineralogical Union, 281-343.
- Irmer G (1985) Zum Einfluβ der Apparatefunktion auf die Bestimmung von Streuquerschnitten und Lebensdauern aus optischen Phononenspektren. Exper Techn Physic 33: 501-506.
- http://rruf.info
- Baturin G (1986) Geochemistry of Fe-Mn concretions. Academic Press, Moscow, 237.
- Ostrooumov M (2017) FT-Raman and infrared reflection spectrometry of minerals and gems.
- http://www.mineralog.net
Author Details
Mikhail Ostrooumov*
Institute of Earth Sciences, University of Michoacan of San Nicolas of Hidalgo, México
Corresponding author
Mikhail Ostrooumov, Institute of Earth Sciences, University of Michoacan of San Nicolas of Hidalgo, 58030 Morelia, Mich., Mexico, E-mail: ostroum@umich.mx
Accepted: December 06, 2017 | Published Online: December 08, 2017
Citation: Ostrooumov M (2017) Raman and Infrared Reflection Spectroscopic Study of Mineralogical Composition of Iron-Manganese Nodules (Pacific and Indian Oceans). Int J Exp Spectroscopic Tech 2:012.
Copyright: © 2017 Ostrooumov M. This is an open-access article distributed under the terms of the Creative Commons Attribution License, which permits unrestricted use, distribution, and reproduction in any medium, provided the original author and source are credited.
Abstract
Taking advantage of the recent development of Raman Microprobe (RMP) and Infrared Reflection Spectroscopy (IRS) techniques, we report the mineralogical composition of iron-manganese concretions/nodules from the oceanic bottom of Pacific (Clarion Clipperton Zone) and Indian (Western Australian Basin) Oceans. The research shows the benefits of the combined use of RMP and IRS in the analysis of iron-manganese nodules (~ 0.5-5.0 cm in diameter) to obtain some information about the mineralogical composition of these specific nodules. These nodules are mainly containing three structurally disordered and low crystallinity ore minerals: Two manganese-oxides [todorokite (Na, Ca, K, Ba, Sr) 1-x (Mn, Mg, Al)6O12.3-4H2O and birnessite (Na, Ca, K)0.6(Mn4+, Mn3+)2O4.1.5H2O] and one iron-manganese-oxyhydroxide [vernadite (Mn, Fe, Ca, Na) (O,OH)2.nH2O]. A number of non-metallic silicate mineral (quartz, feldspars, zeolites, etc.) of different origins were found in the nodules giving an indication and slow growth during the formation of nodules. Some nodules are free from non-metallic minerals and the nuclei contain only the Fe-Mn ore minerals. The combined application of RMP and IRS improves the identification of the mineralogical phases in the iron-manganese nodules. Moreover, it is possible to analyze the structural orders and crystallinity of Mn-oxides and Fe-Mn oxyhydroxides phases during the formation of the raw material in the nodules/concretions. With the recent development of combined RMP and IRS techniques are emerging as important tools in mineralogical research and, in particular the case of in-situ studies of the mineralogical composition of iron-manganese nodules from the oceanic bottom.
Keywords
Mineralogical composition, Fe-Mn nodules, Raman microprobe, Infrared reflection spectroscopy, Crystallinity
Introduction
Deep-ocean mineral deposits have received an increasing attention because they provide potentially secure sources of many critical and strategic elements needed in high-tech, green-tech, energy, and military applications [1-6]. The deep-ocean mineral deposits of greatest resource interest include iron-manganese concretions/nodules, iron-oxyhydroxide-manganese-oxide crusts (Fe-Mn crusts), seafloor massive sulfides, phosphorite, and Rare-Earth Element (REE)-rich muds. At the beginning of the third millennium, it will become imperative to take urgent steps towards the mineralogical study of deep-ocean deposits. It is very clear that only over the knowledge base concerning the mineralogical composition, will it be possible to explain their genesis, and characterize their potential resource in the future.
It is known that between all deep-ocean mineral deposits the marine ferromanganese deposits are most abundant. These nodules have a resource interest for copper, nickel, cobalt, molybdenum, lithium, titanium, REE and others [2-4]. At the same time, there is no detailed information about the mineralogical composition of iron-manganese concretions because the principal mineral phases are characterized by disordered structure and low crystallinity.
A combined use of Raman Microprobe (RMP) and Infrared Reflection Spectroscopy (IRS) techniques could practically use to identify all mineralogical, gemological and archaeological objects [7,8]. Moreover, these methods present many comparative advantages in comparison to the majority of well-known traditional mineralogical techniques. First, RMP and IRS are non-destructive methods, and thus potentially are very important tools for mineralogists, gemologists, archeometrists and geoarchaeologists. Since non-destructive methods at present are preferred in mineralogical, gemological, geoarchaeological and archaeometric identification, these methods are considered the appropriate analytical techniques for this aim. RMP and IRS are also useful as an alternative to the more traditional methods of X-ray analysis such as XRD, SEM/EDS and EPMA.
The purpose of this paper is to show the benefits of the combined use of RMP and IRS in the mineralogical analysis of iron-manganese nodules from oceanic bottom. The current study was undertaken to compensate for the absence of published literature relating to a combined use of RMP and IRS in mineralogical research of these important oceanic formations.
The present research is based on the materials collected by author at some Fe-Mn nodules deposits in Pacific (Clarion Clipperton Zone) and Indian (West Australian Basin) Oceans (Figure 1). In this study, more than fifty fragments of the Fe-Mn nodules (Figure 2) were collected during the oceanic expeditions that were carried out by the Russian Academy of Sciences (Russian Antarctic and Far East Geological Institute expeditions).
Background information
It is generally accepted that usual XRD applied to disordered structure and low crystallinity materials is not very sensitive to local or intermediate-range order. The essential characteristic of these structures is the absence of order at long distance and in this case, the usual methods of diffraction give access only to the radial functions of distribution. Moreover, using XRD is not suitable to determine the characteristics structural of slightly crystallized and/or amorphous natural compounds [9].
The finely-particulate and disordered nature of manganese and iron oxides and oxyhydroxides in the iron-manganese nodules has made identification of their mineralogy by means of XRD difficult and sometimes impossible.
Therefore, vibrational spectroscopies are necessary to gain further insights in these geo-mineralogical systems. An advantage of employing both RMP and IRS techniques is that vibrational spectroscopy gives information on the short-range ordering and, therefore, clearly has a higher sensitivity than XRD in the investigation of samples with strong structural distortions. Moreover, are rapid, accurate and non-destructive techniques in characterizing both single and mixed mineral phases. In particular, vibrational spectroscopy has shown its advantages over other techniques in terms of its sensitivity to hydroxyl groups.
On the one hand, RMP and IRS scattering are well adapted for the study of disordered materials, particularly in the case of disordered silica, high-pressure polymorphs and synthetic glasses [10]. On the other hand, spectroscopic properties of the low crystallinity polymorphs mineral have been used to interpret impact processes [11]. Before the availability of micrograin techniques, the positive identification of fine-grain minerals and other low disordered phases was made only on extracts. In situ measurements were not acquired and critical information was lost. With the recent development of micro-Raman and micro-infrared reflection techniques, the RMP and IRS are emerging as important tools in mineralogical research of the disordered and poor crystallinity natural chemical compounds [12-15].
It thus seems reasonable and useful to explore the possibilities of RMP and IRS spectrometry for the study of the mineralogical composition of the Fe-Mn nodules from the oceanic bottom. Moreover, in the mineralogical and spectroscopic literature one does not find a document concerning the combined use of the Raman and infrared reflection spectra in the mineralogical study of these Fe-Mn concretions. This is why the author undertook this study for their preliminary structural characterization with goal diagnoses, bearing on the two known sources of the most significant deposits of the Fe-Mn nodules in the oceanic bottom: Clarion-Clipperton Zone (Pacific Ocean) and West Australian Basin (Indian Ocean).
Experimental Details and Materials
Raman microprobe
Initial Raman spectra of the Fe-Mn nodules were recorded with a confocal laser Raman spectrometer (Horiba instrument Lab RAM HR 800), equipped (-70 ℃) 1024 × 256-pixel CCD (charge-coupled device) array detector. Acquisitions were obtained with an 1800 lines/mm grating. Excitation was provided by an Ar-ion laser (λ = 514 nm) source. A low laser power 1-5 mW at the sample surface was used to avoid laser induced degradation of the sample. A confocal Olympus BX41 microscope was coupled to the instrument. The laser beam was focused through a 100x objective to obtain a spot size of about 1 μm. The spectral resolution was ~0.3 cm-1/pixel. The accuracy of the instrument was controlled by repeated use of a silicon wafer calibration standard with a characteristic Raman line at 520.7 cm-1. The Raman spectra were achieved with Lab Spec 5 software.
Later Raman measurement were performed with the ultimate research grade benchtop the Perkin-Elmer Raman Station TM 400 using the 785.14 nm excitation line of an He-Ne laser in the spectral range between 100 and 3500 cm-1. An integration time of 50 and 100 scans was enough to get acceptable signal to noise ratio at a resolution of 4 cm-1. Spectrum TM software was used for data collection and experimental analysis.
Finally, Fourier-transform Raman spectra were carried out with a Bruker instrument using the 1064 nm excitation line of a Nd:YAG laser both in microscopic and macroscopic modes with an actual spectral resolution of ± 2 cm-1. In both cases, the beam power was kept between 10 and 20 mW. The laser power at the specimen was selected to minimise sample fluorescence, heating and possible thermal degradation. Raman microprobe and IRS measurements were done on the surfaces of the nodules, on the protrusions and at cross sections with the same result.
Infrared reflection spectroscopy
Infrared measurements of the reflection spectra of minerals are likely to be extended because of the appearance of stable and practical spectrometers with complementary reflection equipment with or without infrared microscope: Variable Angle Specular Reflectance Accessory (VASRA), Grazing Angle Objective (GAO) and Attenuated Total Reflection (ATR) objective. For example, in the VASRA accessory a sample's usable surface can vary from a few cm2 to few mm2. Perhaps the greatest advantage of IRS is the possibility of obtaining local spectra of inclusions within heterogeneous samples by using an infrared microscope (GAO and ATR objectives) and microcamera. This is an important advantage of the IRS method in comparison with absorption/transmission technique. For example, in mid infrared a spatial resolution of about 2.5 µm was possible in the measurement modes reflectance with micro-IRS, one can obtain spectra from particles with a diameter as little as 10 µm, which is the approximate dimension of mineral inclusions in inorganic pigments, pottery and so on. In contrast, absorption/transmission spectra show the characteristic bands of all mineral phases included in a heterogeneous sample. As a result, these bands tend to overlap, making identification of individual minerals very difficult.
The infrared reflection spectra were obtained with equipment available for the spectrometric groups installed at: (1) The Crystal Physics Laboratory in the Institute of Materials, Nantes University, France; (2) The Mineralogical Laboratory in the Metallurgical Institute, University of Michoacan, Mexico. Various spectrometric equipment's used in this study include the Spectrometer Bruker IFS-28 (France), Spectrometer Nicolet 20SXC-FTIR (France), and Spectrometer Bruker Tensor 27 (Mexico) with HYPERION 3000 FT-IR microscope. To view the visible image of the sample the HYPERION is equipped with a high-quality CCD-camera. Additionally, an eye-piece is always present allowing the observation of the sample with absolutely unaltered colors. For verification purposes, the same spectra were tested in various laboratories and with different spectrometric equipment.
All samples were guided and mounted on different reflection accessories associated with each infrared spectrometer. The infrared reflection spectra were collected also using a Tensor 27 FTIR spectrometer with HYPERION FT-IR microscope (Bruker) with a VASRA (VeeMax II, PIKE Technologies), accumulating 100 scans at a spectral resolution of 2-4 cm-1. The PIKE Technologies VeeMax design employs a unique optical design that enables samples to be analyzed over a range of incident angles from 30 to 80 degrees. Pottery samples were not prepared when placed downward on the platform (in the majority of the cases, non-uniform surfaces were used). Since the sample position is external to the accessory, large and bulky samples may be analyzed easily. The external sample chamber IMAC allows FT-IR-imaging measurements on large samples. As in the HYPERION 3000 imaging microscope a state-of-the-art FPA (Focal Plane Array) detector is used in the IMAC. The higher lateral resolutions are achieved by GAO and ATR objectives with higher numerical aperture (20x, 36x). In general, taking measurements for IRS is much easier than for most other sophisticated techniques (e.g., microprobe analyses). Moreover, no elaborate sample preparation, such as in RMP analysis, is required and the results can be obtained in a few seconds.
Results and Discussion
Raman spectroscopy
The Raman spectra obtained from selected areas of the rough sections from the Fe-Mn nodules samples (Pacific Ocean, Clarion Clipperton Zone) show that these oceanic formations are characterized by the complex mineralogical composition: Non-metallic (silicates) and ore minerals-manganese oxides and Mn-Fe oxyhydroxide (Table 1). In the first mineralogical type of these concretions, it has been detected that nucleus contained non-metallic minerals. Other mineralogical types of these nodules are characterized by the absence of the silicate nuclei that contained only the Fe-Mn ore minerals.
The Raman spectra the first mineralogical type shows that these samples are characterized by the highly heterogeneous body matrix mineralogy. This is due to the presence of a large variety of minerals mainly such as silicate (quartz, feldspars: Alkali polymorph and plagioclase, and zeolite-phillipsite; Table 1, Figure 3a, Figure 3b and Figure 3c).
Quartz was identified on the basis of its intense Raman line at 464 cm-1. The Raman spectrum of α-quartz acquired on the studied samples exhibits some characteristic lines (Table 1). The detailed identification of the vibrational modes of different forms of silica has been made in previous publications by several authors who assigned all of the observed bands [11,16]. In accordance with these data, the strongest band in the spectrum of quartz at 464 cm-1 is due to a symmetrical stretching vibration (tetrahedron breathing).
All the alkali and plagioclase feldspars exhibit a characteristic vibrational mode between 500 and 514 cm-1 (Ag mode) which is the strongest feature in each spectrum. A second strong band is observed between 478 and 488 cm-1 and both of these bands have been assigned to a mixed S-O-Si (or Si-O-Al) bending/stretching. In this concrete case of Fe-Mn nodules, it is difficult to confirm the feldspar structure by Raman spectroscopy because most of the observed bands are weak or broad. Nevertheless, the spectroscopic characteristics show that the main feldspars phases are andesine-labradorite and sanidine (Figure 3a and Figure 3b). In particular, the Raman spectra of the feldspars are readily recognized by the presence of two (sanidine: 475 and 512 cm-1) or three (andesine-labradorite: 409, 482, 508 cm-1). Raman peaks lying between 400 and 515 cm-1.
Significantly, Raman spectra of studied zeolite (Figure 3c) show no bands in the region where extremely strong antisymmetric stretching bands appear in the infrared spectra (the strongest Si-O-Si antisymmetric stretch at 1089 cm-1 with structure-sensitive shoulder band at 1063 cm-1). Generally, the zeolites are characterised by Raman spectra with an intense band about 510-480 cm-1. Accordingly, the nuclei zeolite Raman spectra show bands lower than 500 cm-1 frequency, namely two strong bands at 475 (s) and 410 (vs) cm-1. This fact can be explained by a very high Si/Al ratio that is typical for the zeolites of the phillipsite group. The band of the antisymmetrical and symmetrical vibration of hydroxyl groups lies in the region of 2950-3540 cm-1. They have a strong intensity in the infrared ATR spectra and a low intensity in the Raman spectra. For the OH-stretch region, the H-bonded stretch occurs at 3600 and 3450 cm-1 in infrared spectra and at 2940, 3450 and 3540 cm-1 in Raman spectra. The H-O-H banding frequency of the H2O molecule lies at a wavenumber of 1625-1640 cm-1, with a medium intensity in the infrared absorption spectrum and a low intensity in the Raman scattering spectrum.
RMP spectroscopy shows that the poorly crystalline and disordered phases of some manganese oxide and Mn-Fe oxyhydroxide [todorokite (Na, Ca, K, Ba, Sr)1-x(Mn, Mg, Al)6O12.3-4H2O and vernadite (Mn, Fe, Ca, Na) (O, OH)2•nH2O] have concentrated in the intermediate and periphery zones of the Fe-Mn nodules. Generally speaking, the Raman spectra of the manganese oxides, are dependent only on the MnO6 octahedral units that building the Mn-hydroxides framework. All manganese oxides and hydroxides are indicative of spectral domains at 450-600 cm-1 and 600-750 cm-1, stemming from Mn-O bending and stretching vibrations, respectively [9,17].
Figure 4a, Figure 4b, Figure 4c, Figure 4d and Figure 4e shows the Raman spectra of three principal manganese ore minerals. The general peculiarity of the vibrational features of these minerals is their low Raman activity. The todorokite type-structure can be recognised by one intense peak at 610-640 cm-1 which is characterized by different half-width values-indicator of different crystallinity of this mineral (Figure 4a, Figure 4b and Figure 4c). Sometimes have been observed the weak peak at 580 cm-1. In contrast with todorokite Raman spectra the vernadite type structure was identified based on its characteristic intense triplet at 500 (m), 570 (s), 630 (m) cm-1 (Figure 4d).
RMP analysis show two evolution series in the concentration of the ore minerals in the second mineralogical type of the concretions: a) Ordered with high crystallinity todorokite in the nuclei → disordered todorokite in the intermediate and periphery zones; b) Vernadite in the nuclei → disordered todorokite in the intermediate and periphery zones. Below we will discuss in detail the estimation of these structural distortions.
RMP studies of the Fe-Mn nodules from Indian Ocean bottom (Western Australian Basin) have shown their different ore mineralogy (Table 2). Raman spectra show that the main ore mineral is other manganese oxide: Birnessite (Na, Ca, K)0.6(Mn4+, Mn3+)2O4.1.5H2O. Three major Raman features characterize the birnessite type-structure: at 505-510, 580-585, and 630-650 cm-1 (Figure 4e). The two high-wavenumber bands are dominating all spectra, while bands in the low-frequency region appear with a rather weak intensity. The Raman band at 630-650 cm-1 can be viewed as the symmetric stretching vibration ν3 (Mn-O) of MnO6 groups. It is assigned to the A1g symmetric mode in the C2h3 spectroscopic space group. The band located at 575-585 cm-1 usually attributed to the ν2 (Mn-O) stretching vibration in the basal plane of [MnO6] sheets is particularly strong in birnessite compounds.
Birnessite has concentrated mainly in the intermediate zones of the Fe-Mn concretions. In this case, the nucleus contained the non-metallic minerals (silicates) whilst in the periphery have been observed todorokite. Due to the presence of birnessite in these nodules and the absence of vernadite, the genetic different features in the bottom of the Indian Ocean can be deduced.
Finally, some broad bands have been observed in the Raman spectra of representative Fe-Mn nodules in the range 200-1000 cm-1. These bands are related to the presence of disordered crystalline Fe-hydroxides, mainly, goethite (α-FeOOH: 243, 299, 385, 479, 550, 685 and 993 cm-1), lepidocrocite (γ-FeOOH: 245, 373, 493, 522, 650, 685 and 993 cm-1) and δ-FeOOH (400 and 680 cm-1) that have been formed after the hydroxylation of raw material. These disordered phases formed the mineral assemblage with birnessite that have not been observed in the Mn-Fe nodules from Pacific Ocean bottom.
Infrared reflection spectroscopy
In the mid-infrared range (MIR: 4000-400 cm-1 or 2.5-25 μm), the reflection or absorption bands are normally visible due to the presence of various minerals' atomic groups [16]. The mid-infrared spectra of the mineral offer significant information about the functional groups of which it is constituted. The majority of the mineral's characteristic bands meet in the mid-region of the infrared spectrum. For example, the most intense spectral features of silicates, occurring between 1250 and 800 cm-1, are generally described as simply due to fundamental antisymmetric Si-O-Si stretching vibrations, but Si-O-Al stretching vibrations may also contribute when aluminum is part of the crystal lattice [16]. The second most intense silicate bands are broadly characterized as O-Si-O bending modes, which occur in the 550-400 cm-1 region. Weaker bands in silicate spectra between 800 and 600 cm-1 are attributed to symmetric Si-O-Si stretching vibrations.
The IRS spectra obtained from selected areas of the Fe-Mn fragments confirm the results of RMP (Figure 5a, Figure 5b and Figure 5c; Table 3): These samples are highly heterogeneous, containing a large variety of non-metallic minerals in their nuclei (quartz, alkali and plagioclase feldspars, zeolite). Quartz was identified on the base of its intense IRS bands at 1174 and 1110 cm-1 [13]. Furthermore, the reflectance spectrum of quartz displays a well-defined lobe of prominent reflection doublet at 800 and 780 cm-1 that is typical for (1010) orientation. Detailed identification of the vibrational modes of different forms of silica can be found in previous publications [16,17].
All the alkali and plagioclase feldspars exhibit characteristic strong reflection bands between 1000 and 1200 cm-1 (Ag mode), which is the strongest feature in each spectrum (Table 3). A second strong band observes between 475 and 580 cm-1, and both of these bands assign to a mixed Si-O-Si (or Si-O-Al) bend/stretch. In the case of the Pacific Fe-Mn nodules, most of the observed IRS bands of the feldspars showed the presence of the two main feldspars phases that are characterized by two (1044 and 1153 cm-1: sanidine) and five (922, 959, 1000, 1107, 1143 cm-1: andesine-labradorite) intensive reflection bands (Figure 5b).
The principal bands occurring in the spectra of zeolite-phillipsite are related with the internal vibrations of either SiO4 and AlO4 tetrahedra or Si-O-Si and Si-O-Al bridges. A typical IRS spectrum of the phillipsite from Fe-Mn concretions is presented in Figure 5c. It can be seen that the infrared reflection studies have shown the strongest Si-O-Si antisymmetric stretch at 1089 cm-1 with structure-sensitive shoulder band at 1063 cm-1. Si-O-Si symmetric stretch is represented by vibration at wavelengths from 900 to 610 cm-1. Vibrations assigned to double 4- and 6-rings occur in the range 500 to 400 cm-1. The next strongest band at 465 cm-1 is assigned to a T-O bending mode.
Infrared ATR, GAO and VASRA reflection spectroscopy has proven to be also a useful tool for the mineralogical identification of the tetravalent manganese oxides and Fe-Mn oxyhydroxide. These compounds can be distinguished by absorption or reflection patterns due to vibrations of the MnO6 octahedral framework in the 1400 cm-1 to 200 cm-1 region. The 4000 cm-1 to 1400 cm-1 region is often diagnostic due to absorption associated with the hydrous components of the oxyhydroxides.
In order to obtain more information about the mineralogical composition of the two groups of Fe-Mn nodules (from Pacific and Indian Ocean bottom), their mineralogical composition was examined using single point micro-IRS spectroscopy in the mid-infrared range. A representative VASRA, ATR and GAO reflection spectrum of the Fe-Mn nodules from Pacific Ocean bottom (Figure 6a and Figure 6b) was indicative of todorokite-vernadite mineralogical composition [12]. In contrast, infrared ATR and GAO reflection spectra of the ore minerals from Indian Ocean bottom have showed the characteristic bands of birnessite-todorokite mineralogical assemblage.
In the ATR spectra of the Fe-Mn fragments, the main Mn-O stretching band appeared in the range 420-580 cm-1. According to the ATR infrared analysis, main locations in IR spectra were similar to those observed by Ostrooumov [12] for some Mn compounds: at 430 (s), 520 (vs) and 580 (vs) cm-1 (todorokite), at 465 (vs) and 515 (vs) cm-1 (birnessite), at 435 and 500 cm-1 (vernadite). In this case, IRS demonstrates an ability to distinguish different structures of the manganese oxides and Fe-Mn oxyhydroxides.
Ore minerals from Pacific Ocean bottom were identified in the intermediate and periphery zones of the Fe-Mn nodules using IRS, including todorokite and vernadite. In the spectra of these minerals main IRS broad band of todorokite detecting around 520-580 cm-1 shifts toward low wave numbers (500-510 cm-1) with the widening in the spectra of the disordered variety of this mineral. Thus, micro-IRS spectra confirm the results that have been obtained with the aid of the RMP method.
IRS studies have also shown that the Fe-Mn nodules from Indian Ocean bottom have a different mineralogy because the dominant bands in the IRS of this mineral are the Mn-O vibrations, which are related to birnessite structure (Figure 6a). IRS of the disordered variety of this structure is characterized only by one main broad band at 460 cm-1 (Figure 6b). Thus, representative infrared reflection spectra of the Fe-Mn nodules from Pacific and Indian Oceans in the range 1200-400 cm-1 confirm and complete the results that have been obtained by RMP method (Table 3).
Estimation of crystallinity
The increasing degree of disordering and the decrease of crystallinity are intimately linked to the decreasing order of the lattice. Consequently, the increasing irregularities of bond lengths and of interatomic distances must be seen as the main source of disorder. Therefore, using vibrational spectroscopy analysis, the increasing bandwidths are more expressive for estimating the degree of lattice disorder than are the changes in their spectral positions [18]. Following Irmer [19], we calculated the actual half-width Γ listed in Table 4 by using the equation Γ= Γs√1-2(s/Γs)2 where Γs is the measured half-width and s the spectral slit width.
It has been noted above that the todorokite type-structure can be recognised by one intense peak at 610-640 cm-1 that is characterized by different half-width values. Disorder in todorokite greatly influences its Raman spectra (Figure 3a, Figure 3b and Figure 3c). Upon decreasing the degree of lattice ordering, the bands of internal vibrations characterizing the interatomic motions in the octahedra become less intense and less sharp, in good correspondence with the infrared spectrum [9]. In addition, as todorokite becomes increasingly disordered, the vibrational frequency of the principal band is clearly lowered (Table 4). The frequency shift can be attributed to the decreasing degree of crystallinity.
The shift towards lower wavenumbers was observed especially for the main band around 640 cm-1. Similar frequency changes should be expected for the corresponding infrared vibration, but have never been described. Perhaps the much greater width of the infrared bands, in contrast to the narrow Raman bands, might be one reason that in the infrared spectrum band shifts cannot be as clearly observed as in the Raman spectrum [10].
The shift of the main Raman bands toward lower wavenumbers indicates that in general the average distances between atoms become somewhat larger, i.e., that the lattice is slightly expanded. The increase in band half-widths and the accompanying decrease of intensity can be interpreted in such a way that, during disorder, the distribution of bond lengths and bond angles within and between MnO6 octahedra becomes increasingly irregular. Both line broadening and decreasing intensity are especially clear for the main band at about 640 cm-1 in well-ordered todorokite. In the Raman spectra of the intermediate todorokite this band shifts toward 620 cm-1. In samples with a high degree of disorder only one broad and weak band at about 610 cm-1 is observed. There are other examples of higher frequency leading to higher crystallinity [18].
The half-width (widening) of the intense Raman band at about 640 cm-1 appears to be the best tracer for investigating changes connected with structural ordering and different crystallinity of the lattice. Half-width values of about 10-15 cm-1 characterize a well ordered todorokite structure in the intermediate zones. Intermediate disordered todorokite show α values between 20-25 cm-1, while in highly disordered samples α ≥ 30-35 cm-1 (Table 4). Thus, the Raman line shapes appear to depend strongly on the degree of lattice order/disorder subsequent to the structural degree of ordering and crystallinity of the principal Mn-oxides and Fe-Mn oxyhydroxides phases that are formed during the formation of the raw material in the concretions.
The RMP measurements, performed with high spatial resolution down to about one micrometer, allow investigation not only of individual crystals or grains but also of thin sections or unprepared rock samples. Because of much simpler sample preparation, Raman spectroscopy can be more widely used than infrared spectroscopy. Furthermore, compared with infrared measurements, RMP spectroscopy affords higher lateral resolution, because of the considerable smaller wavelengths of the exciting light [20].
On other hand, an advantage of combined RMP and IRS spectroscopy is that vibrational spectroscopy gives information on the short-range ordering and, therefore, clearly has a higher sensitivity that XRD in the investigation of samples with strong structural disorder and low crystallinity.
Conclusions
The present study demonstrates that RMP and IRS techniques help to infer fundamental information such as mineralogical composition of Fe-Mn oxides and oxyhydroxide minerals that were formed in the Fe-Mn nodules from oceanic bottom. It has been shown that the combined use of the non-destructive RMP and IRS techniques is useful for crystal chemical characterization and for the determination of structural order-disorder and crystallinity of some principal ore mineral of these Fe-Mn nodules.
RMP and IRS spectroscopy are powerful tools to probe vibrational behaviour of lattice and hence probe structural differences and short-range order in poorly crystalline phases of manganese oxides and iron-manganese oxyhydroxides that have concentrated in the intermediate and periphery zones of the Fe-Mn nodules. The combined application of RMP and IRS improves the identification of the mineralogical phases in the composition of the nodules and makes it possible to analyze the structural degree of ordering of the principal disordered mineral phases that are formed during the formation of the ore minerals in these nodules.
Two case studies demonstrate the application of RMP and IRS spectroscopy in the field of non-destructive mineralogical analysis of Fe-Mn nodules from Pacific and Indian Oceans bottoms. The ore minerals of the first (Clarion Clipperton Zone) are todorokite and vernadite. RMP and IRS studies of the Fe-Mn nodules from Indian Ocean bottom (Western Australian Basin) have shown their different mineralogy due to the presence of the other mineralogical assemblage (birnessite-todorokite) and the absence of vernadite.
The coexistence of ordered-disordered manganese oxides (todorokite) has been ascertained by their Raman spectra. While these spectra are extremely sensitive to short-range order, they also yield information about the overall disorder. Therefore, it is turns out that the structural order of todorokite can be well characterized by RMP spectroscopy. Frequency shift, band broadening, as well as Raman intensity appears to depend strongly on the degree of ordering. By measure the half-width of the Mn-O band at about 640 cm-1, the degree of lattice disorder can be estimated even in highly disordered todorokite.
It is very important to note that the Raman and IRS spectra no have shown the minerals that contain copper, nickel, and cobalt. On the other hand, some research has confirmed [21] that Cu and Ni have concentrated in the Fe-Mn nodules with high concentration of Mn-bearing oxides (todorokite) while the presence of Co was related with the Fe-hydroxides phases.
Thus, there is a good deal of evidence that the Fe-Mn nodules have undergone specific mineralogical features. Consequently, RMP and IRS spectroscopy is a powerful micro-analytical method for investigating the process of structural disordering in these specific mineral phases. Additionally, RMP and IRS spectrometry, applied to those specific natural minerals, is a highly reliable probe, as well as being relatively convenient, rapid and, in particular, non-destructive.
Finally, it is proposed the combined use of RMP and IRS that can provide non-destructive and crystal chemical information for most mineralogical objectives. In support of combined RMP and IRS techniques, the first systematic catalog and a new spectral database with automatic search software have been created with over 600 FT-Raman and infrared reflection spectra from more than 300 different minerals and stone materials [22,23]. RMP and IRS have the potential to be a primary investigative tool in mineralogical, archaeometric, geoarchaeological and environmental research, as it's have advantages over other methods. Other applications of combined RMP and IRS in advanced mineralogy, archaeometry and environmental sciences are likely to be developed in the future. In particular, the researchers will have for the mineralogical and spectroscopic study more than 30-ore fields of the Fe-Mn concretions in the World Ocean.