
International Journal of Experimental Spectroscopic Techniques
(ISSN: 2631-505X)
Volume 3, Issue 1
Research Article
DOI: 10.35840/2631-505X/8514

Article Formats
Interval Partial Least Squares (iPLS) Regression Approach to Predict Hatching Time of Chick
Table of Content
Figures
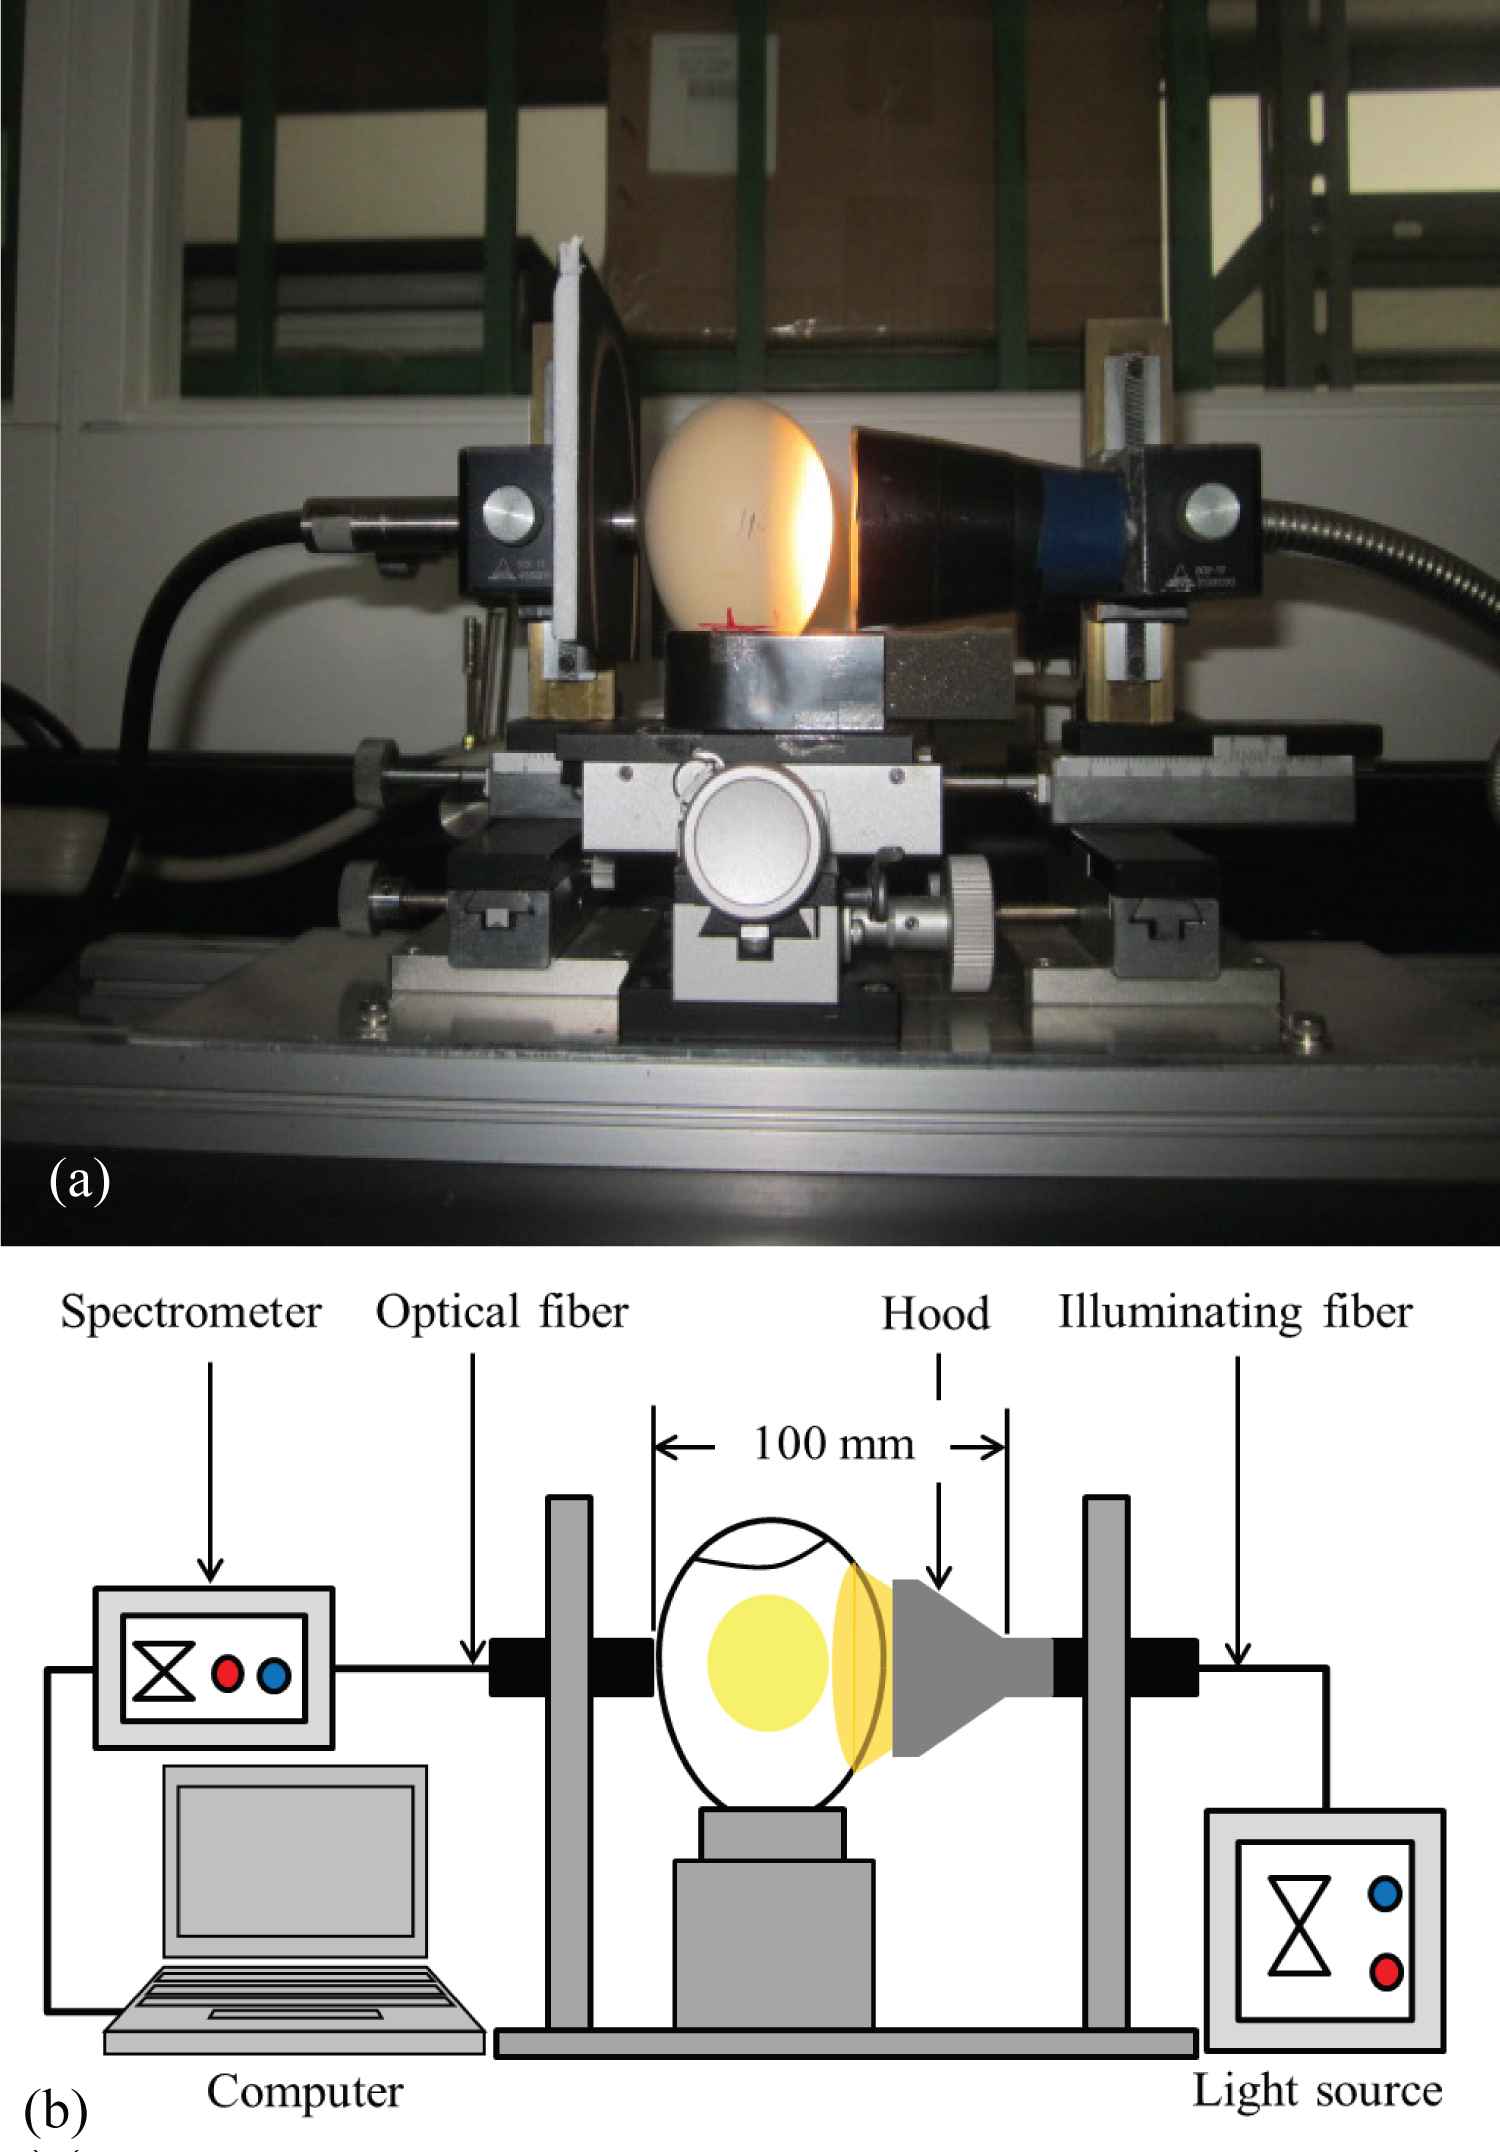
Figure 1: Experimental setup used for the measurement of...
Experimental setup used for the measurement of transmission spectra: a) Pictorial diagram and; b) Schematic diagram.
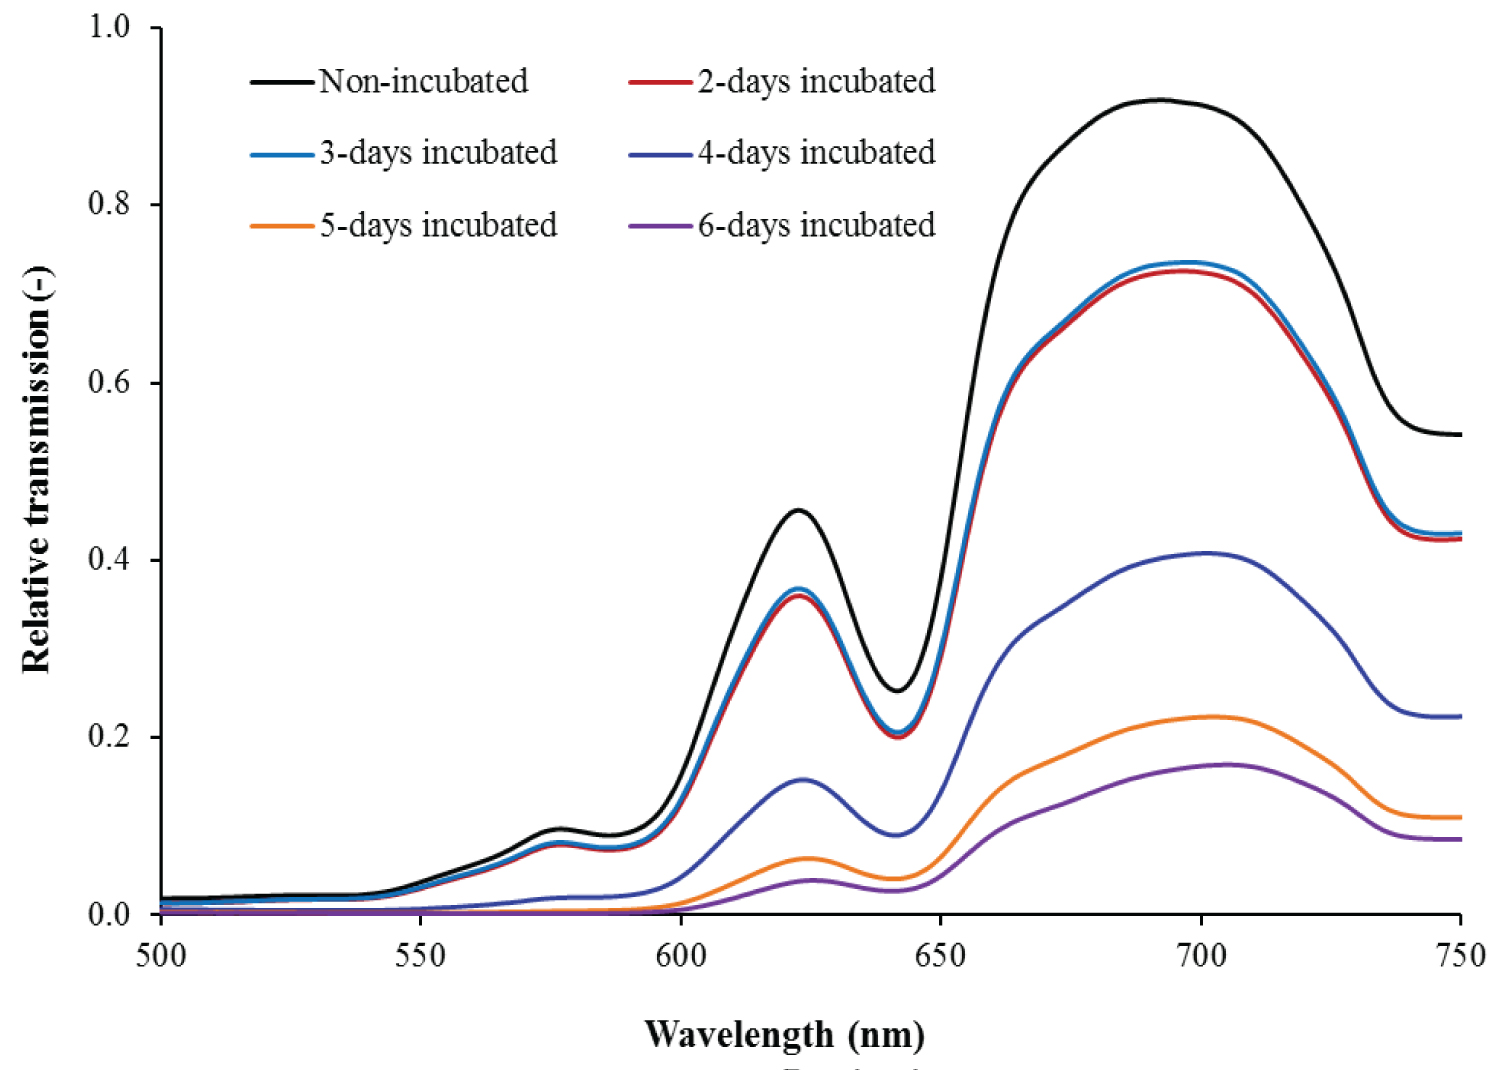
Figure 2: Typical relative transmission spectra of an incubating...
Typical relative transmission spectra of an incubating egg at different incubation time in visible region.
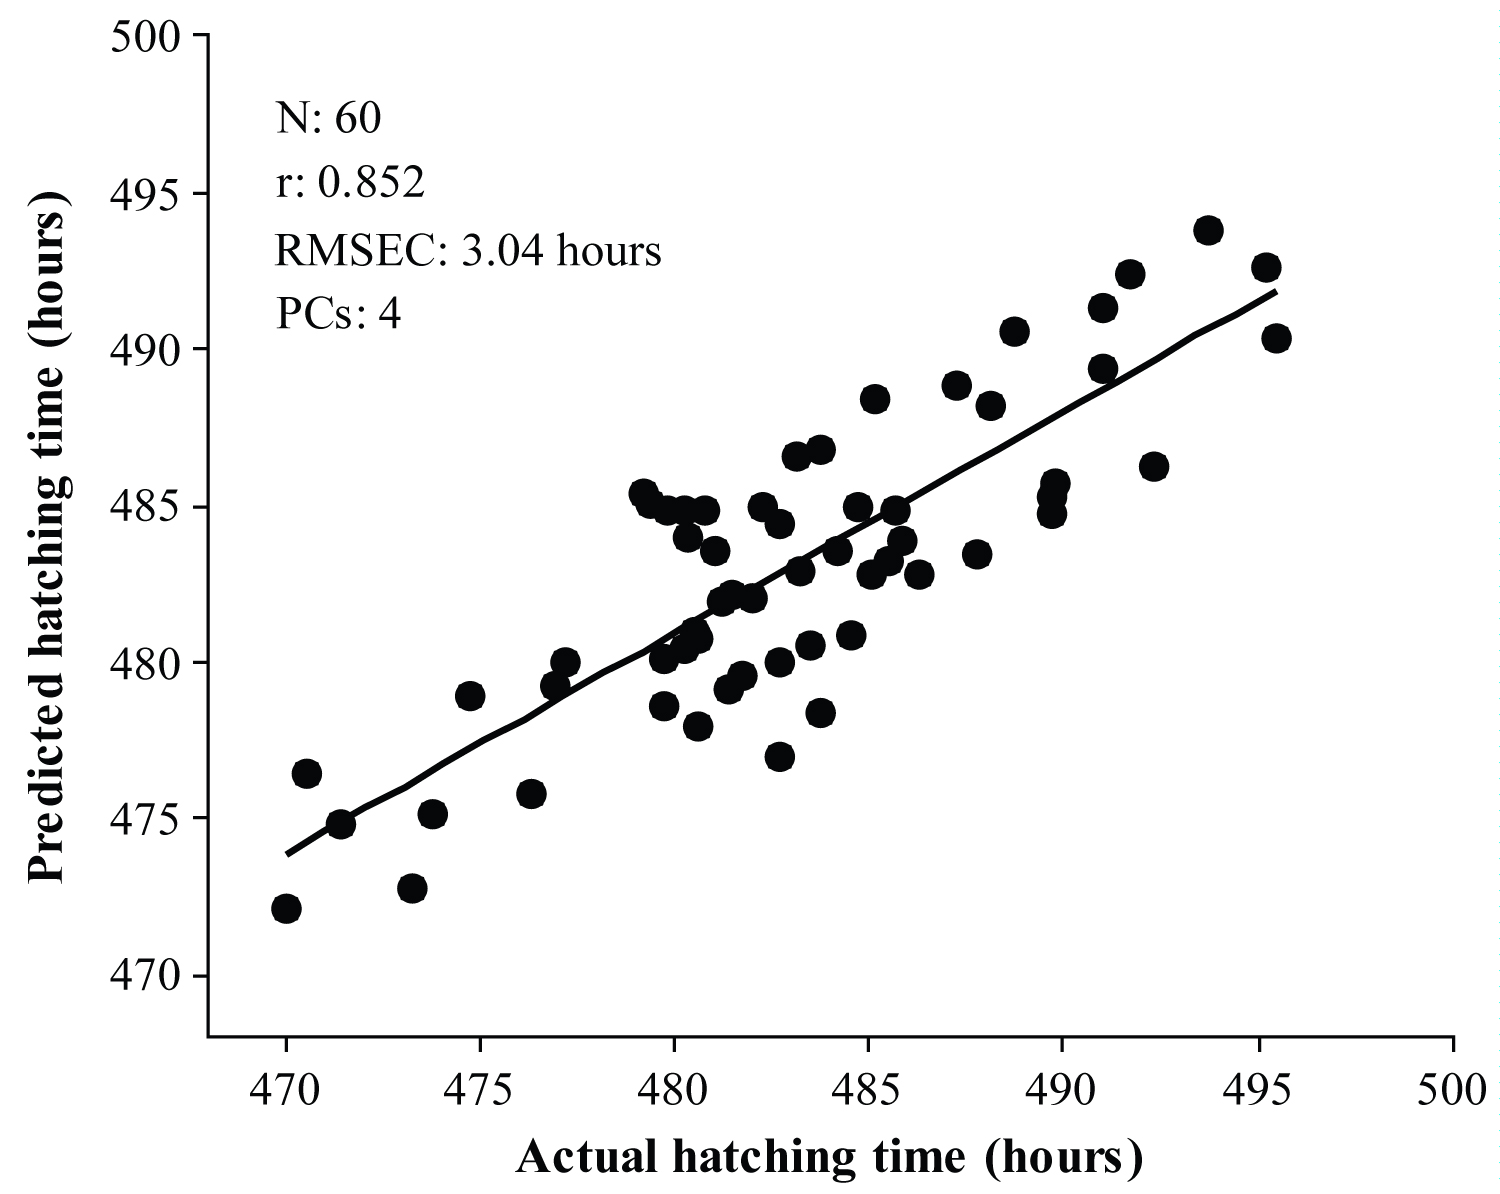
Figure 3: Calibration results for the prediction of chick hatching time...
Calibration results for the prediction of chick hatching time using FS-PLS regression.

Figure 4: Subinterval selection using RMSECV calculated from...
Subinterval selection using RMSECV calculated from PLS regression in each subinterval.
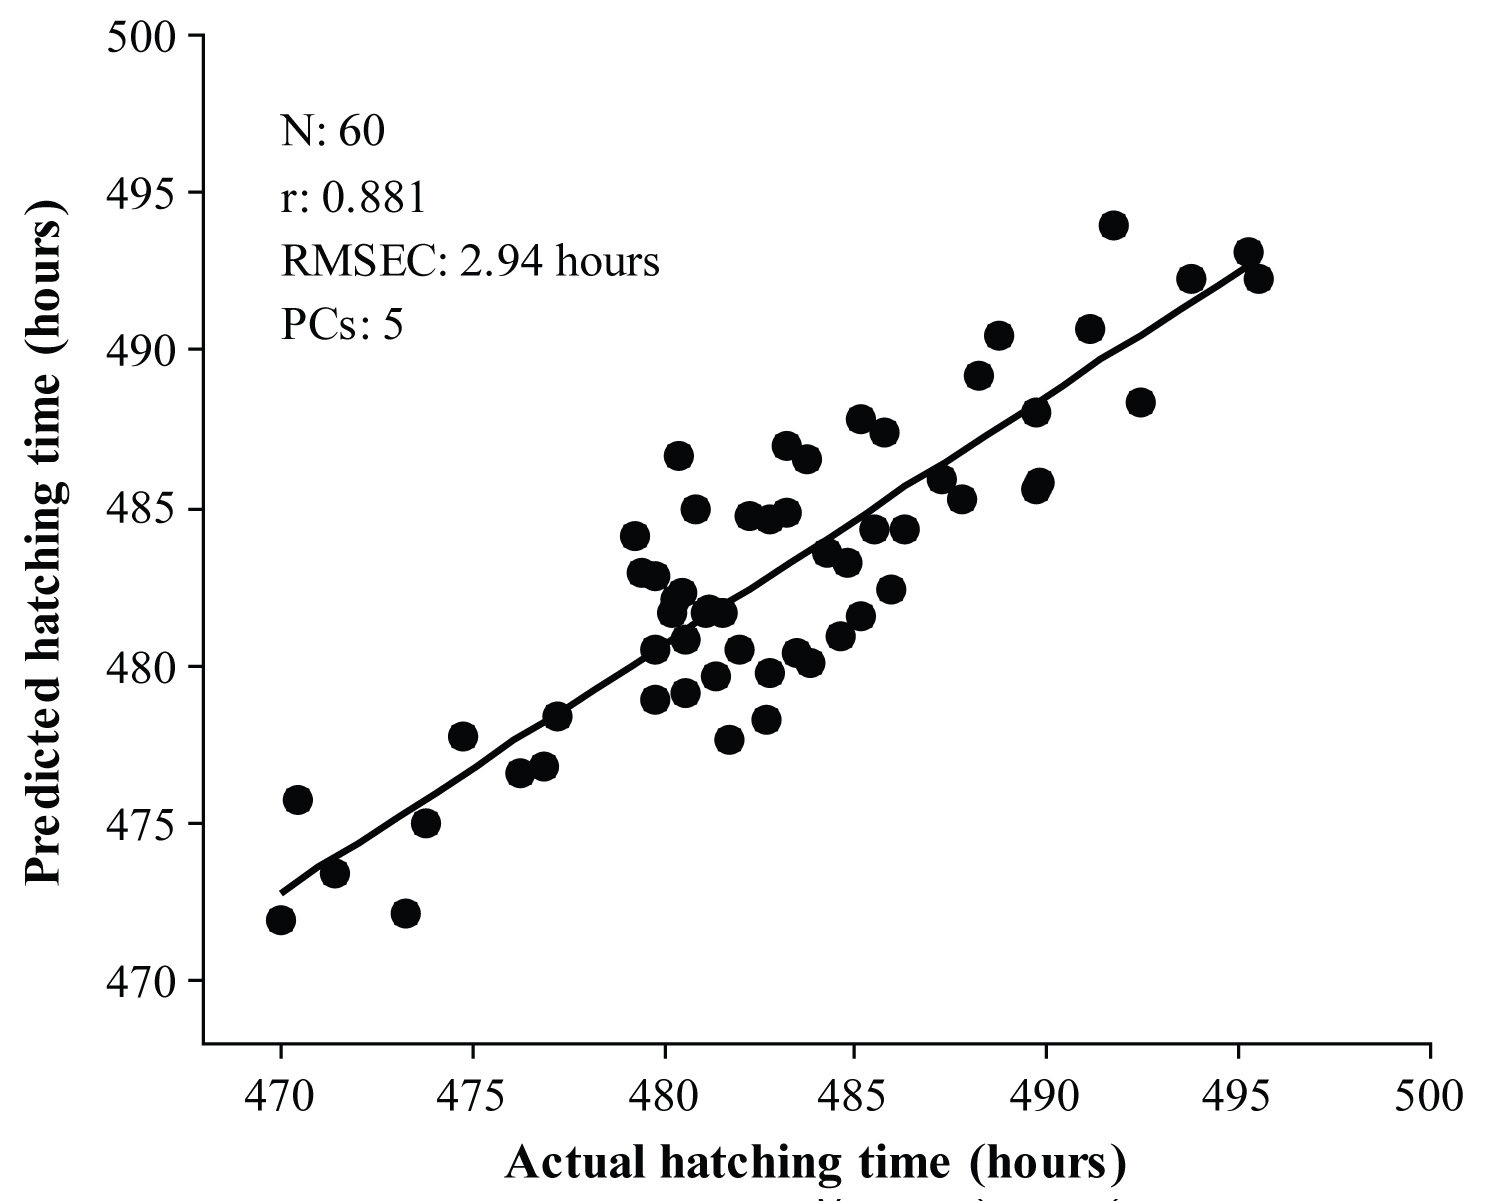
Figure 5: Calibration results for the prediction of chick...
Calibration results for the prediction of chick hatching time using selected subintervals.
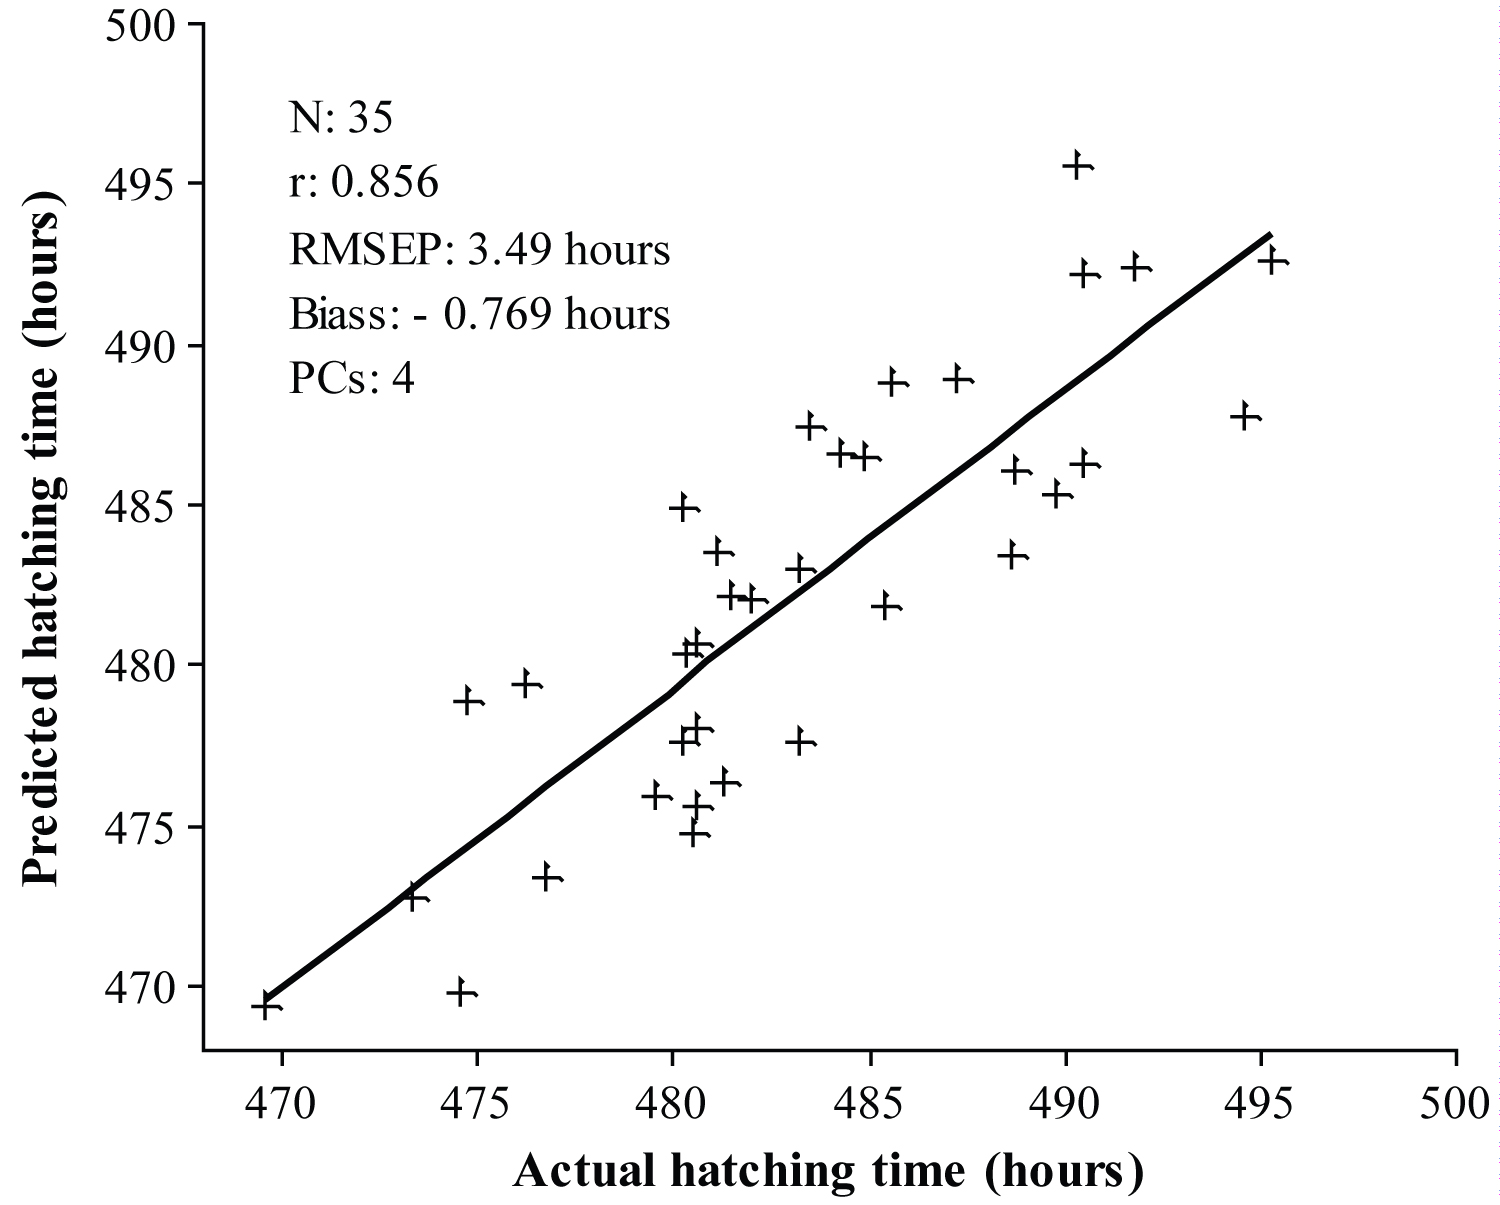
Figure 6: Prediction results for the prediction of chick hatching...
Prediction results for the prediction of chick hatching time using FS-PLS regression model.

Figure 7: Prediction results for the prediction of chick hatching...
Prediction results for the prediction of chick hatching time using iPLS regression model.
Tables
Table 1: PLS results for the prediction of chick hatching time for different pre-processing techniques based on 4-days incubated egg spectra.
Table 2: Calibration and cross-validation result using iPLS regression.
References
- Decuypere E, Bruggeman V (2007) The endocrine interface of environmental and egg factors affecting chick quality. Poult Sci 86: 1037-1042.
- Tona K, Bamelis F, De Ketelaere B, Bruggeman V, Moraes VM, et al. (2003) Effects of egg storage time on spread of hatch, chick quality, and chick juvenile growth. Poult Sci 82: 736-741.
- Careghi C, Tona K, Onagbesan O, Buyse J, Decuypere E, et al. (2005) The effects of the spread of hatch and interaction with delayed feed access after hatch on broiler performance until seven days of age. Poult Sci 84: 1314-1320.
- Chou CC, Jiang DD, Hung YP (2004) Risk factors for cumulative mortality in broiler chicken flocks in the first week of life in Taiwan. Br Poult Sci 45: 573-577.
- Gonzales E, Kondo N, Saldanha ES, Loddy MM, Careghi C, et al. (2003) Performance and physiological parameters of broiler chickens subjected to fasting on the neonatal period. Poult Sci 82: 1250-1256.
- Bamelis FR, Tona K, De Baerdemaeker JG, Decuypere EM (2002) Detection of early embryonic development in chicken eggs using visible light transmission. Br Poult Sci 43: 204-212.
- Kemps BJ, Bamelis FR, Mertens K, Decuypere EM, De Baerdemaeker JG, et al. (2010) Assessment of embryonic growth in chicken eggs by means of visible transmission spectroscopy. Biotechnol Prog 26: 512-516.
- Islam MH, Kondo N, Ogawa Y, Fujiura T, Suzuki T, et al. (2015) Prediction of chick hatching time using visible transmission spectroscopy combined with partial least squares regression. Engineering in Agriculture, Environment and Food 8: 61-66.
- Suhandy D, Yulia M, Ogawa Y, Kondo N (2013) Prediction of L-Ascorbic Acid using FTIR-ATR Terahertz Spectroscopy Combined with Interval Partial Least Squares (iPLS) Regression. Engineering in Agriculture, Environment and Food 6: 111-117.
- Norgaard L, Saudland S, Wagner J, Nielsen JP, Munck L, et al. (2000) Interval partial least-squares regression (iPLS): A comparative chemometric study with an example from near-infrared spectroscopy. Applied Spectroscopy 54: 413-419.
- Islam MH, Kondo N, Ogawa Y, Fujiura T, Suzuki S, et al. (2017) Detection of infertile hatching egg using visible transmission spectroscopy combined with multivariate analysis. Engineering in Agriculture, Environment and Food 10: 115-120.
- Kemps BJ, Bamelis FR, Ketelaere B De, Mertens K, Tona K, et al. (2006) Visible transmission spectroscopy for the assessment of egg freshness. Journal of the Science of Food and Agriculture 86: 1399-1406.
- Lourens A, van den Brand H, Meijerhof R, Kemp B (2005) Effect of eggshell temperature during incubation on embryo development, hatchability, and posthatch development. Poult Sci 84: 914-920.
- Walstra I, Napel JT, Kemp B, van den Brand H (2010) Temperature manipulation during layer chick embryogenesis. Poult Sci 89: 1502-1508.
- Brant AW, Norris KH, Chin GA (1953) Spectrophotometric method for detecting blood in white shelled eggs. Poult Sci 32: 357-363.
- Camps C, Christen D (2009) On-tree follow-up of apricot fruit development using a hand-held NIR instrument. Journal of Food Agriculture and Environment 7: 394-400.
- Gielen RMAM, de Jong LP, Kerkvliet HMM (1979) Electro-optical blood-spot detection in intact eggs. IEEE Transactions on Instrumentation and Measurements 28: 177-183.
- Baggott GK (2001) Development of extra-embryonic membranes and fluid compartments. In: Deeming DC, Perspectives in fertilization and embryonic development in poultry. Ratite Conference Books, Lincolnshire, UK, 23-29.
- Pedersen DK, Morel S, Andersen HJ, Engelsen SB (2003) Early prediction of water-holding capacity in meat by multivariate vibrational spectroscopy. Meat Science 65: 581-592.
- Di Anibal CV, Callao MP, Ruisánchez I (2011) 1H NMR variable selection approaches for classification. A case study: The determination of adulterated foodstuffs. Talanta 86: 316-323.
Author Details
Md. Hamidul Islam1,2*, Naoshi Kondo1, Yuichi Ogawa1, Tateshi Fujiura1, Tetsuhito Suzuki1 and Shinichi Fujitani3
1Graduate School of Agriculture, Kyoto University, Japan
2Department of Farm Power and Machinery, Bangladesh Agricultural University, Bangladesh
3NABEL Co. Ltd., 86 Morimoto Cho, Nishikujo, Minami-ku, Kyoto, Japan
Corresponding author
Md. Hamidul Islam, Graduate School of Agriculture, Kyoto University, Kitashirakawa-Oiwakecho, Sakyo-ku, Kyoto, 606-8502, Japan; Department of Farm Power and Machinery, Bangladesh Agricultural University, Bangladesh.
Accepted: April 14, 2018 | Published Online: April 16, 2018
Citation: Islam MH, Kondo N, Ogawa Y, Fujiura T, Suzuki T, et al. (2018) Interval Partial Least Squares (iPLS) Regression Approach to Predict Hatching Time of Chick. Int J Exp Spectroscopic Tech 3:014.
Copyright: © 2018 Islam MH, et al. This is an open-access article distributed under the terms of the Creative Commons Attribution License, which permits unrestricted use, distribution, and reproduction in any medium, provided the original author and source are credited.
Abstract
Due to a wide hatch window, hatchery managers need to deal with chicks of different biological ages at take-off, which negatively affects the chick's post-hatched performance. Consequently, it is important to control the spread of the hatch window in order to have a batch of chicks with the same biological age. Since the spread of the hatch window is influenced by the hatching time of individual chicks, early prediction of hatching time can be used to limit the hatch window. In this study, the feasibility of using visible transmission spectroscopy combined with partial least squares (PLS) regression for the prediction of chick hatching time was investigated. An experiment was conducted with 100 chicken eggs in which transmission spectra were measured between incubation day 0 (non-incubated egg) and 8 and subsequent hatching time was recorded. Several spectral pre-processing procedures, including smoothing, baseline offset correction, multiplicative scatter correction (MSC) and first order derivative, were compared during data analysis. Full spectrum PLS (FS-PLS) and iPLS regression methods were used to developed calibration models using different pre-processed spectra. The results showed that an iPLS model based on MSC pre-processed spectra resulted in superior performance compared to that of the best FS-PLS model. The root mean square error of prediction (RMSEP) was 3.23 hours and 3.49 hours for the iPLS model and FS-PLS model, respectively. The result indicates that the use of visible transmission spectroscopy combined with multivariate analysis has the potential to accurately predict chick hatching time.
Keywords
Hatching time, Chicken egg, Hatch window, Visible transmission spectroscopy, iPLS regression, Calibration model
Introduction
In broiler production system, the day-old chick is an important starting input for broiler farms which is the end product of the poultry hatchery. Therefore, day-old chicks should be of high quality, which is determined from their post-hatched survivability and growth potential, such as high growth rate, high breast meat yield and low feed conversion ratio [1] and homogeneity of chicks within a batch. However, a batch of day-old chicks is frequently not homogeneous in quality due to a widespread hatch window [2]. Usually, fertile hatching egg requires 21 days of incubation to hatch and all chicks in a batch are desired to hatch at the same time. But in reality, chicks hatch at different moments within a time period called the "hatch window" which may spread from 24 to 48 hours [3]. As a result of this broad hatch window, a production manager is dealing with chicks of different biological ages at take-off.
The earlier hatched chicks, which are older than one day, often show signs of dehydration at take-off and are a poor-quality stock for later production. In addition, the delay in the collection of the chick batch also delays further hatchery procedures, such as sexing, vaccinations, packaging, and transportation, which also ultimately delays the first feed and access to water. Several researchers have reported that a delay in feed intake is associated with higher early-mortality in chicks and impaired performance throughout the growth period [4,5]. For poultry hatchery managers, a hatch window of less than 24 hours is beneficial both from an economic point of view, as well as with respect to animal welfare.
According to previous published reports, several factors, such as parent flock, egg handling, egg storage duration, and incubation conditions, influence mean hatching time [1-3]. Due to the complexity of the factors influencing hatching time, it is very difficult for the hatchery managers to correctly estimate hatching time and consequently the spread of the hatch window. However, to obtain high quality chicks and narrow hatch window, the hatching time of chicks needs to be predicted accurately. Since the spread of the hatch window is estimated from the hatching time of individual chicks in a batch, early prediction of hatching time could be used as a means to narrow down the hatch window. Previous researchers reported that in incubated fertile hatching eggs, blood formation takes place from incubation day 2 and subsequent physiological changes occur in live embryos during the incubation period [6]. Thus, monitoring information of embryonic. Thus, monitoring information of embryonic development of a chicken egg could be used to predict the length of incubation time.
Now a days, spectral measurements are commonly used to extract internal information about eggs, such as presence of blood and meat spots, egg freshness and embryonic growth. Such spectral measurements have the advantage of being fast, nondestructive, and noncontact. Moreover, this technique can be implemented at a reasonable price. Preliminary investigations have revealed that significant variations in the spectra were found during incubation. Furthermore, Kemps, et al. [7] used visible transmission spectroscopy to assess embryonic weight in chicken eggs. They developed a model based on spectral information combined with partial least square (PLS) regression. A very good prediction accuracy (correlation coefficients of 0.97) was achieved from the multiplicative scatter corrected (MSC) spectra in the spectral range of 570-750 nm.
In the previous work, Islam, et al. [8] used visible transmission spectroscopy for prediction of chick hatching time combined with full-spectrum PLS (FS-PLS) regression in the spectral range of 500-750 nm. Results showed that incubation day 4 spectra with multiplicative scatter correction (MSC) have lowest root mean square error of prediction (RMSEP) = 3.41 hours. However, for practical application, it is important to develop a robust calibration model with a high prediction performance. When using a FS-PLS regression, it is possible to include unrelated and unimportant spectrum characteristics in the calibration model that results in over-fitting. If over-fitting occurs, the model will generally have a poor predictive performance [9]. To avoid this problem, it is a very important step to construct a calibration model with only a selected subset of wavelengths instead of using all the wavelengths. Therefore, a robust calibration model with high prediction performance can be developed with properly selected variables that contain only the important and relevant information to the target variables.
Among several variable selection methods, the spectral region selection method, based on iPLS [10], was used to develop a calibration model for prediction of chick hatching time with high prediction performance. In iPLS method, all wavelengths are splited into some smaller equidistant subintervals, and develop PLS models on each subinterval. Then, the best subintervals are determined on the basis of the root mean squared error of cross-validation (RMSECV) values.
In this study, the visible transmission spectroscopy technique was applied to predict the chick hatching time. First, the spectral data was split into equidistant spectral subintervals by iPLS; then subintervals which had lower RMSECV than the average RMSECV were selected. Finally, the iPLS model was developed using these selected subintervals. The prediction performance of the iPLS model was tested with the samples independent from the calibration sample set. The overall results were compared and discussed in comparison with results obtained in the previous report using a full-spectrum PLS (FS-PLS) calibration model [8].
Material and Methods
Materials
A total of 100 light brown-shell chicken eggs laid by a commercial broiler breed (Ross 308 strain) were used in this study. All eggs were collected from a commercial poultry hatchery (Yamamoto Co. Ltd., Kameoka, Kyoto, Japan). At the moment of egg collection, the laying hens were 36 weeks of age. In order to minimize the effect of size and weight of eggs on hatching time, all samples were selected within a range of 43.5 (± 1.0) mm of diameter, 56.5 (± 2.5) mm of height which resulted in a weight range of 58-85 g. In addition, to minimize the effect of egg shell pigmentation on transmission spectra, eggs with a similar shell color (red-value of 0.405 ± 0.015) were selected based on digital image processing technique [captured image of eggs, convert color image into R, G and B image and calculate r-value as: R/(R + G + B)]. Prior to incubation, all eggs were stored for 3 days at 15.0 (± 0.5) °C and 80 (± 5) % of relative humidity (RH).
Spectral acquisition system
The experimental setup used for acquiring the transmission spectra of an intact egg is shown in Figure 1 [11]. An illuminating fiber was used for cool illumination of the egg and an optical fiber was used to collect and transport the transmitted light to the spectrometer (Hamamatsu C 7473-36). The distance between the illuminating fiber and the optical fiber was kept at 100 mm to obtain a consistent transmission signal. A halogen light source (Asahi Spectra FHL-101) was used for illuminating the samples. This light source consisted of a dichroic reflector type halogen lamp (capable of cutting off infrared energy) in order to prevent warming of the live embryo, which is very sensitive to heat. The light transmitted through the egg was received and transported by the optical fiber (1 mm effective light receiving diameter) to the spectrometer. The software package PMA-11 Spectral Analyzer for Windows (PMA Software U6039-01, Hamamatsu Photonics K.K., Japan) was used to control the spectral acquisition.
The transmission spectra of the eggs were measured over the spectral range of 200 to 950 nm at 1 nm intervals. The integration time for one scan was 100 ms and the spectrum of each egg contains an average of 10 scans. Since the characteristics of a halogen lamp changes over time, the spectrometer was calibrated before measurement using a Teflon block (PTFE push rod Ø45 mm, Chukoh Chemical Industries, Ltd., Japan) of 30 mm thickness [7]. In addition, the reference spectra were measured after each 12 samples to evaluate any changes in the reference spectra with time. Furthermore, a correction was made for electrical noise by recording the spectra with no light exposure to the spectrometer. All measurements were done inside a black box to shield any stray light from entering. The raw transmission values of light passing through an egg were expressed as a ratio of the amount of light passing through the eggs to the amount of light passing through the reference at the same wavelength [12]. The relative transmission (T) was calculated using equation (1).
Where:
T (λ) is relative transmission at wavelength λ nm
S (λ) is intensity of sample at wavelength λ nm
R (λ) is intensity of Teflon reference at wavelength λ nm
It should be noted that the term "transmission spectra" used throughout this text refers to the relative transmission spectra.
Experimental design
Prior to setting the eggs into the incubator, eggs were preheated for 16 ho'urs (first 6 hours at 28 °C and the remaining 10 hours at 30) to bring the embryos to a uniform temperature when they were placed into the incubator. Just prior to incubation (referred to as "Day 0"), the transmission spectra of all eggs were measured. Upon completion of measurements, the eggs were immediately placed in a commercial incubator (SSH-02 all in one type, Showa Furanki Co., Saitama, Japan) to incubate at 37.8 and 55% RH [13]. During incubation, eggs were turned automatically every hour through an angle of 90 degrees until incubation day 18. Between incubation day 1 to day 8, eggs were taken out from the incubator every 24 hours to measure the spectral transmission of each egg. To minimize exposure time of the egg outside the incubator, eggs were immediately placed back into the incubator after the measurements. At incubation day 19, eggs with living embryos were placed into hatcher baskets at 37.8 and 60% RH [14] and allowed to hatch. From incubation day 19, hatching chicks were monitored by a web camera to record the time of hatching for each egg until the hatching process ended. During the monitoring period, images were captured at 5 minute intervals. The time of capture was also recorded simultaneously. Later, incubation time required by each egg to hatch was calculated as the duration between the time of emergence of the chick and the starting time of incubation.
Data analysis
Since the calciferous shell of the eggs absorbed most of the transmitted light below 500 nm [15], the transmission spectra of eggs in the spectral range of 500 to 750 nm were used for data analysis. At first, raw relative transmission spectra were normalized by mean normalization technique under each spectrum to minimize the effect of variation of egg shell thickness on transmission spectra. Among 100 eggs, 1 egg was infertile, 2 eggs were failed to hatch and 2 eggs were died immediate after hatching. After removal of all spectral information of earlier mentioned 5 samples, rest 95 samples were then divided into two groups i.e. the calibration samples set and prediction samples set containing 60 and 35 samples, respectively (SPxy method was used to select calibration and validation sample set). The calibration set was used for developing a calibration model, and the prediction set was used for the validation of the model. Several pre-processing procedures, including Savitzky-Golay smoothing, multiplicative scatter correction (MSC), baseline offset correction, Savitzky-Golay first derivative, were compared during this work. These pre-processing operations were performed on normalized transmission spectra for both calibration and prediction sample sets. All spectral pre-processing techniques were performed using The Unscrambler® software: Version 9.8 (CAMO, Oslo, Norway).
Calibration model development
Partial least squares (PLS) regression multivariate analysis was used to develop a calibration model for the prediction of chick hatching time. The PLSR approach is one of the most popular chemometric algorithms for the development of calibration models due to its simplicity and small volume of calculations. Actually, PLS regression is a technique that generalizes and combines features from principal component analysis and multiple regressions. It is particularly useful when we need to predict a set of dependent variables from a large set of independent variables (i.e. predictors). Two PLS regression methods were used to develop models and compared. First, a calibration model was developed using the FS-PLS regression method with different pre-processing spectra and their results were compared. Then a calibration model was developed using the iPLS regression method based on the best FS-PLS calibration model for further improvement of prediction capability.
The iPLS regression method was first proposed by Nørgaard, et al. [10]. The objective of iPLS regression analysis is to develop a calibration model with selected subsets of wavelength, which contain only the important and relevant information of the target variables. For iPLS regression analysis, the full spectrum (501-750) was divided into 25 equidistant subintervals and each contained 10 variables. Then a PLS calibration model was developed for each subinterval. The average root mean square error of cross-validation (RMSECV) of subintervals was used as a threshold value for the selection of appropriate subintervals. The PLS and iPLS regression analysis was performed using the commercial multivariate analysis software The Unscrambler: Version 9.8.
Evaluation of the calibration model
The performance of the developed calibration model was evaluated using several statistical parameters, including correlation coefficient (r) of prediction, root mean square error of calibration (RMSEC) and root mean square error of prediction (RMSEP). A good calibration model should have a high correlation coefficient (r) and a low RMSEP. In addition, the difference between RMSEC and RMSEP should be small for a good calibration model [16]. The quality of the final model was evaluated according to the lowest value of RMSEP and lowest difference between RMSEC and RMSEP.
Results and Discussion
Characteristics of visible transmission spectra of an incubating egg
Typical relative transmission spectra of an incubating egg at different incubation times in the spectral range of 500-750 nm are shown in Figure 2. The overall shape of the incubated egg spectra was qualitatively examined in order to illustrate the influence of embryonic development on the spectral profile. From Figure 2, it is apparent that the transmission spectra shifted up and down depending on the stage of incubation. The large decreases in the transmission spectra at 589 and 643 nm prior to incubation day 4 are due to light absorbed by the shell color pigment "protoporphyrin IX" [17]. However, the changes in the shape of the transmission spectra around 570-580 nm from incubation day 4 onward are due to the light absorbed by hemoglobin, which is the detected pigment in the blood [6]. The shifting down of the transmission spectra from incubation day 3 to day 6 is due to the formation of sub embryonic fluid (SEF). With the formation of SEF the albumen of the egg gradually loses water and becomes thicker [18]. This thick albumen reduces the transmission of light through the egg and results in a lower signal received by the detector. Since the value of relative transmission of light after incubation day 6 is nearly zero, relative transmission spectra of an incubating egg until incubation day 6 are shown in Figure 2.
Calibration models using FS-PLS regression
Initial FS-PLS regression results reveal that spectral information from 4-day incubated eggs is more effective in predicting chick hatching time. Therefore, in the rest of the manuscript we discuss only the results that are obtained from transmission spectra from 4-day incubated eggs. The FS-PLS regression results obtained from different pre-processed spectra are shown in Table 1. Among all calibration models, the MSC spectra based model was selected as the best calibration model, because of having a low RMSEP, small difference between RMSEC and RMSEP. In addition, this model is less complex, because of utilizing a minimal number of principal components to develop the model. Figure 3 shows the calibration results for the prediction of chick hatching time based on MSC spectra using FS-PLS regression.
Calibration model using iPLS regression
The iPLS regression analysis was used to develop calibration models from MSC spectra of 4-day incubated eggs. A PLS regression model was developed using each subinterval and subsequent root means square error of calibration (RMSEC), and the root means square error of cross-validation (RMSECV) values were calculated. Table 2 shows the results obtained from the iPLS regression analysis. The RMSECV value of each subinterval was used to compare the prediction performance of the iPLS calibration models according to previous reports [9,19,20]. The average RMSECV of all subintervals was used as threshold value for the selection of appropriate subintervals. Subintervals having a RMSECV value lower than threshold were selected to develop the iPLS calibration model. As seen in Figure 4, subintervals 5, 14 and 18-24 have a lower or a similar value of RMSECV to that of the threshold value. For this reason, these subintervals were selected for the development of the iPLS calibration model. Figure 5 shows the calibration results for the prediction of chick hatching time based on MSC spectra using iPLS regression. These results showed that iPLS calibration model is simpler than FS-PLS model because number of variables reduced from 250 to 90. On the other hand, the number of PC is larger for iPLS model than for FS-PLS model.
Comparison of the performance of FS-PLS and iPLS calibration models for prediction of chick hatching time
The capability of the developed calibration models for the prediction of chick hatching time was confirmed with the prediction sample set. For this purpose, both FS-PLS and iPLS calibration models were used to predict the hatching time of 35 chicken eggs from the prediction set. The prediction results obtained using the FS-PLS and iPLS calibration models are shown in Figure 6 and Figure 7, respectively. The prediction results obtained from the iPLS calibration model were better than those from the FS-PLS calibration model. The RMSEP was 3.49 hours for the FS-PLS calibration model. While using the iPLS calibration model the RMSEP was improved to 3.23 hours. Furthermore, 250 variables were included in the FS-PLS calibration model, while only 90 variables were used in the iPLS calibration model. In addition, 5 PCs were used in iPLS model while 4 PCs were used in FS-PLS model. However, for any online applications, a lower number of variables will be important in order to develop a simple calibration model. At the same time, the bias was also lower in the iPLS model over that of the FS-PLS model. In addition, the results of paired t-test reveal that there is no statistically significant difference between the actual and predicted hatching time with 90% confidence level (p-value = 0.142). This supports that the model is fitted well for the prediction of chick hatching time.
Summary and Conclusions
In this study, visible transmission spectra combined with PLSR multivariate analysis were used to predict chick hatching time. The transmission spectra of incubating eggs were applied to develop the prediction model. In the subsequent analysis, relative spectra were normalized for selected wavebands to exclude the effects of egg shell thickness and then several pre-processing procedures were applied on the spectra. The results showed that the FS-PLS regression model based on MSC pre-processed spectra achieved the best result (r = 0.854 and RMSEP = 3.49 hours) among different pre-processed spectra. Further model improvement was achieved using an iPLS regression method based on selected spectral subintervals. The iPLS model had a superior performance to that of the FS-PLS model, with r of 0.882 and RMSEP of 3.23 hours. These results indicate that visible transmission spectroscopy combined with multivariate analysis has a great potential to be used for predicting chick hatching time. Furthermore, early prediction of hatching time for individual eggs will enable hatchery managers to more finely control the spread of the hatch window, and subsequently the profitability of broiler production. Further refinement of the model is, however, required for commercial application.
Acknowledgements
The authors express their gratitude to Kunio Nambu, President of NABEL Co., Ltd., Japan for his given consent regarding collaborative research and Professor Garry Piller, Graduate School of Agriculture, Kyoto University for editing and proof reading of this manuscript.