
International Journal of Experimental Spectroscopic Techniques
(ISSN: 2631-505X)
Volume 3, Issue 1
Research Article
DOI: 10.35840/2631-505X/8515

Article Formats
Spectrophotometric and Thermodynamic Study on the Dimerization Equilibrium of Neutral Red in the Water and Micelle Environments by Chemometrics Methods
Table of Content
Figures
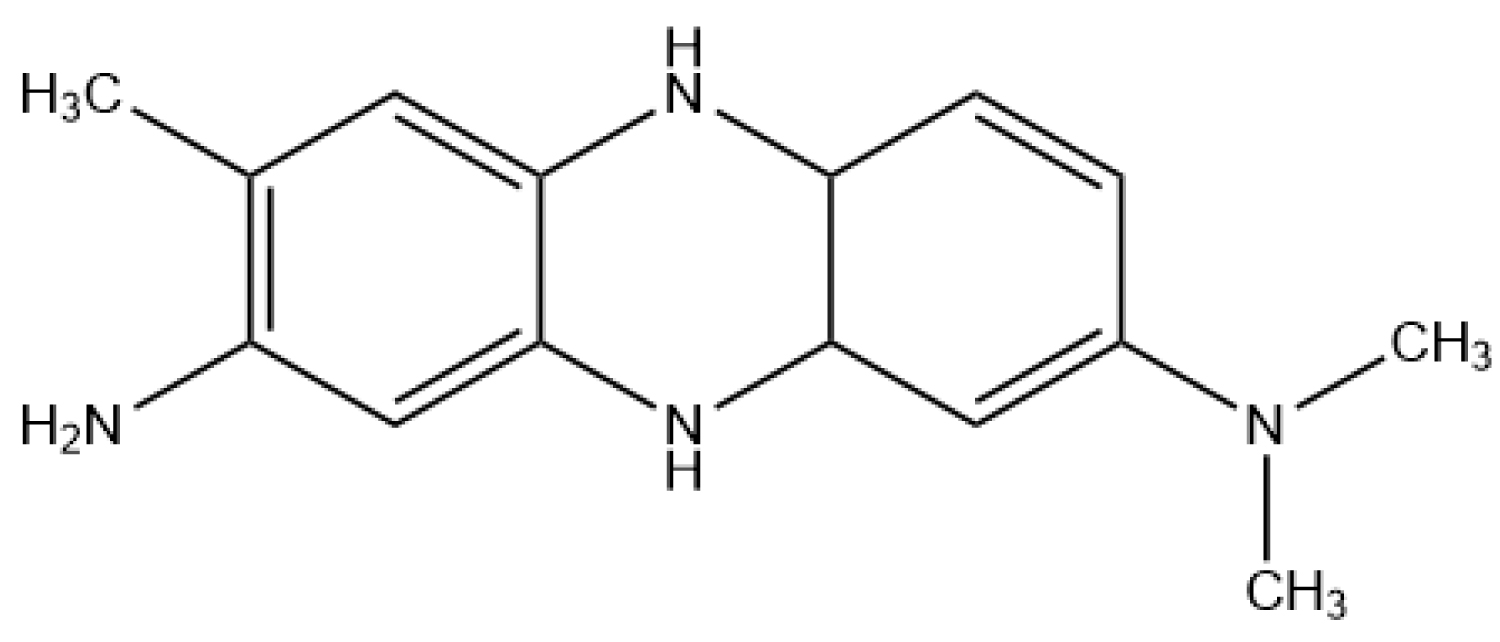
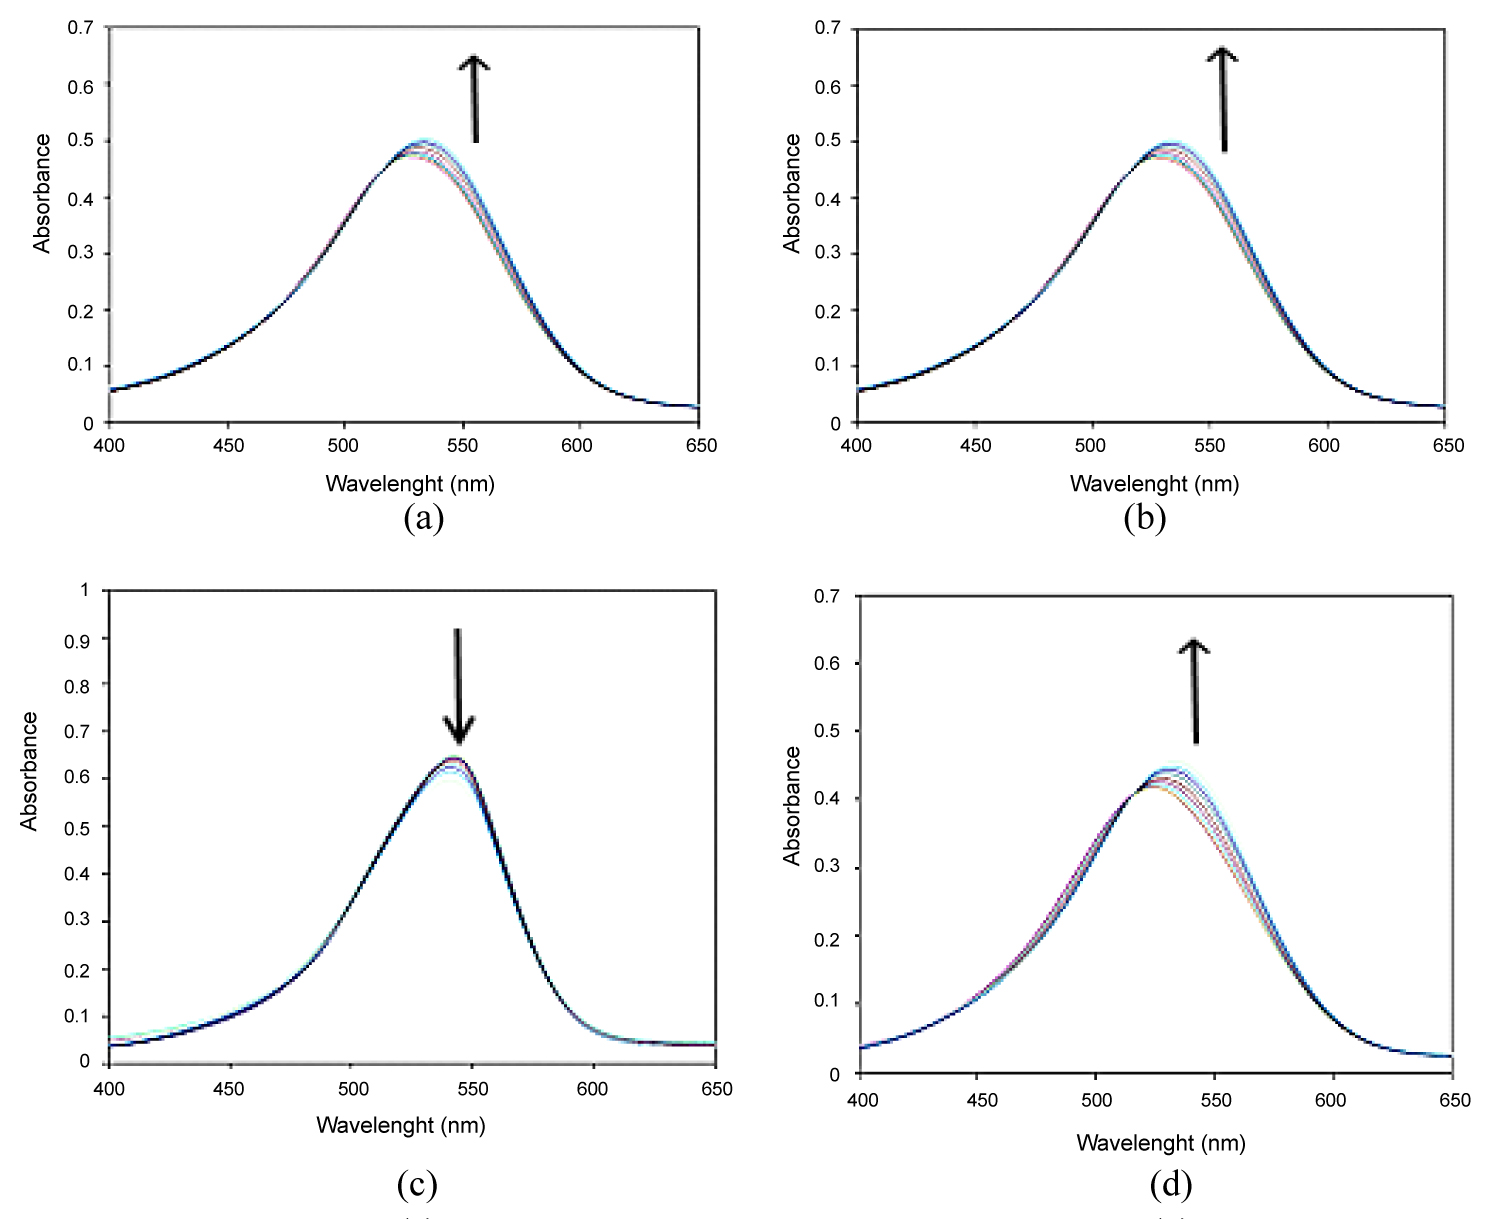
Figure 2: Absorption spectra of Neutral Red (1.73 × 10⁻⁵ M in pH...
Absorption spectra of Neutral Red (1.73 × 10⁻⁵ M in pH 7.00 in a) Water; b) Water - CTAB (0.1); c) Water - SDS (0.1) and d) Water - triton X-100 (0.1).

Figure 3: Output of DATAN program a) Experimental spectra; b) Component...
Output of DATAN program a) Experimental spectra; b) Component spectra; c) Molar ratio and d) Van't Hoff equation plot.
Tables
Table 1: Dimeric constant and thermodynamic parameters values of Neutral Red (1.73 × 10⁻⁵ M) dye in the water and micelle environments.
References
- Gohain B, Sarma S, Dutta RK (2008) Protonated dye-surfactant ion pair formation between neutral red and anionic surfactants in aqueous submicellar solutions. Journal of Molecular Liquids 142: 130-135.
- Iram M, Guo C, Guan Y, Ishfaq A, Liu H (2010) Adsorption and magnetic removal of neutral red dye from aqueous solution using Fe 3 O 4 hollow nanospheres. Journal of Hazardous Materials 181: 1039-1050.
- Sharma M, Dube A, Bansal H, Gupta PK (2004) Effect of pH on uptake and photodynamic action of chlorin p6 on human colon and breast adenocarcinoma cell lines. Photochem Photobiol Sci 3: 231-235.
- Xinhua H, Yuanfang L, Ping F, Chegzhi H (2006) The aggregation of neutral red encouraged by deoxyribonucleic acids and its depending factors [J]. Chinese Journal of Analytical Chemistry 28: 682-686.
- Burdett B (1983) Aggregation of dyes in studies in physical and theoretical chemistry. Elsevier.
- Miyatake T, Tamiaki H, Holzwarth AR, Schaffner K (1999) Self‐assembly of synthetic zinc chlorins in aqueous microheterogeneous media to an artificial supramolecular light‐harvesting device. Helvetica Chimica Acta 82: 797-810.
- Antonov L, Gergov G, Petrov V, Kubista M, Nygren J (1999) UV-Vis spectroscopic and chemometric study on the aggregation of ionic dyes in water. Talanta 49: 99-106.
- Evans L, Patonay G (1999) Effects of organic and aqueous solvents on the electronic absorption and fluorescence of chloroaluminum (III) tetrasulphonated naphthalocyanine. Talanta 48: 933-942.
- Mchedlov-Petrosyan N, Kholin YV (2004) Aggregation of rhodamine B in water. Russian Journal of Applied Chemistry 77: 414-422.
- Micheau J, Zakharova G, Chibisov A (2004) Reversible aggregation, precipitation and re-dissolution of rhodamine 6G in aqueous sodium dodecyl sulfate. Physical Chemistry Chemical Physics 6: 2420-2425.
- Miljanić S, Cimerman Z, Frkanec L, Žinić M (2002) Lipophilic derivative of rhodamine 19: Characterization and spectroscopic properties. Analytica Chimica Acta 468: 13-25.
- Pepperkok R, Saffrich R (2001) Microinjection and detection of probes in cells. EMBO Practical Course.
- Su G-J, Yin S-X, Wan L-J, Zhao J-C, Bai C-L (2004) c. Surface science 551: 204-212.
- Yazdani O, Irandoust M, Ghasemi JB, Hooshmand S (2012) Thermodynamic study of the dimerization equilibrium of methylene blue, methylene green and thiazole orange at various surfactant concentrations and different ionic strengths and in mixed solvents by spectral titration and chemometric analysis. Dyes and Pigments 92: 1031-1041.
- Ghasemi J, Niazi A, Kubista M (2005) Thermodynamics study of the dimerization equilibria of rhodamine B and 6G in different ionic strengths by photometric titration and chemometrics method. Spectrochim Acta A Mol Biomol Spectrosc 62: 649-656.
- Ghasemi J, Niazi A, Westman G, Kubista M (2004) Thermodynamic characterization of the dimerization equilibrium of an asymmetric dye by spectral titration and chemometric analysis. Talanta 62: 835-841.
- Almasifar D, Forghaniha A, Khojasteh Z, Ghasemi J, Sharghi H, et al. (1997) Spectrophotometric determination of acidity constants of some recently synthesized anthraquinones in methanol + water. Journal of Chemical & Engineering Data 42: 1212-1215.
- Kubista M, Nygren J, Elbergali A, Sjöback R (1999) Making reference samples redundant. Critical Reviews in Analytical Chemistry 29: 1-28.
- Kubista M, Sjöback R, Albinsson B (1993) Determination of equilibrium constants by chemometric analysis of spectroscopic data. Analytical Chemistry 65: 994-998.
- Kubista M, Sjöback R, Nygren J (1995) Quantitative spectral analysis of multicomponent equilibria. Analytica Chimica Acta 302: 121-125.
- Nygren J, Andrade JM, Kubista M (1996) Characterization of a single sample by combining thermodynamic and spectroscopic information in spectral analysis. Analytical Chemistry 68: 1706-1710.
- Scarminio I, Kubista M (1993) Analysis of correlated spectral data. Analytical Chemistry 65: 409-416.
- Ghasemi J, Ahmadi S, Kubista M, Forootan A (2003) Determination of acidity constants of 4-(2-pyridylazo) resorcinol in binary acetonitrile+ water mixtures. Journal of Chemical & Engineering Data 48: 1178-1182.
- Ghasemi J, Niazi A, Kubista M, Elbergali A (2002) Spectrophotometric determination of acidity constants of 4-(2-pyridylazo) resorcinol in binary methanol-water mixtures. Analytica Chimica Acta 455: 335-342.
- Niazi A, Ghalie M, Yazdanipour A, Ghasemi J (2006) Spectrophotometric determination of acidity constants of Alizarine Red S in water, water-Brij-35 and water-SDS micellar media solutions. Spectrochim Acta A Mol Biomol Spectrosc 64: 660-664.
- Niazi A, Yazdanipour A, Ghasemi J, Kubista M (2006) Spectrophotometric and thermodynamic study on the dimerization equilibrium of ionic dyes in water by chemometrics method. Spectrochimica Acta Part A: Molecular and Biomolecular Spectroscopy 65: 73-78.
- Niazi A, Yazdanipour A, Ghasemi J, Kubista M (2006) Multiwavelength spectrophotometric determination of acidity constants of morin in methanol-water mixtures. Collection of Czechoslovak Chemical Communications 71: 1-14.
Author Details
Zahra Tamiji1, Atisa Yazdanipour1 and Ali Niazi1,2*
1Department of Chemistry, Arak Branch, Islamic Azad University, Arak, Iran
2Department of Chemistry, Central Tehran Branch, Islamic Azad University, Tehran, Iran
Corresponding author
Ali Niazi, Department of Chemistry, Arak Branch, Islamic Azad University, Arak; Department of Chemistry, Central Tehran Branch, Islamic Azad University, Tehran, Iran.
Accepted: June 25, 2018 | Published Online: June 27, 2018
Citation: Tamiji Z, Yazdanipour A, Niazi A (2018) Spectrophotometric and Thermodynamic Study on the Dimerization Equilibrium of Neutral Red in the Water and Micelle Environments by Chemometrics Methods. Int J Exp Spectroscopic Tech 3:015.
Copyright: © 2018 Tamiji Z, et al. This is an open-access article distributed under the terms of the Creative Commons Attribution License, which permits unrestricted use, distribution, and reproduction in any medium, provided the original author and source are credited.
Abstract
Study of Neutral Red dimerization in the water and micelle environments with using of spectrophotometric and chemometrics methods was investigated of the monomer-dimer equilibrium and thermodynamic of Neutral Red. Dimerization constant of Neutral Red was defined from spectrum data with DATAN program. Data obtained from different absorbance by change the temperature in range of 5-75 ℃ at concentrations of Neutral Red (1.73 × 10⁻⁵ M) on spectrum rang of 450-650 nm in the water environment such water-CTAB, water-SDS and water-Triton X-100 in different pH Effect of temperature on the equilibrium constant studied with using of van't Hoff equation and reported quantities of enthalpy and entropy. The result from spectrum data show that DATAN program have good capacity for studying of equilibrium of monomer and dimer.
Keywords
Dimerization, Chemometrics, Spectrophotometric, Neutral Red, DATAN
Introduction
1-amino-7-D-methyl 2 methyl fenarin hydrochloride (Neutral Red), whose structure is shown in Figure 1, is a eurhodin dye and water soluble and, it is widely used in staining in histology, it stains lysosomes red. It is used as a general stain in histology, as a counterstain in combination with other dyes, and for many staining methods but probably the most common use of it is a simple red nuclear counterstain; this dye is accumulated in lysosomic membrane and Golgi bodies living cells. Cellular uptake of this compound occurs by passive transfer through the plasma membrane. Neutral Red accumulation in lysosomes occurs by its attachment to fixed acidic ions such as polysaccharides within lysosomic matrix or trapping cationic type of Neutral Red within the lysosomal acid environment. Several papers have investigated the balance of Neutral Red in micellar environments [1-4].
Study of the dye aggregation is of great importance in industrial and medical processes. Dimerization of dyes in aqueous solution is widely studied in the form of molecular interactions. Several factors to influence dimerization behavior including the paint structure, solvent, temperature and pressure have been determined [5]. Thermodynamic parameters such as standard enthalpy change and entropy on dimerization are effective and determined out of the dependence of the equilibrium constants on temperature.
Accumulation is a feature of dyes in solution and is effective on their dye and photophysical properties and is very important. The cumulative effect plays an important role in biological processes; accumulate molecules optical processing play an important role for photosynthesis in green plants and photosynthesis of bacteria [6]. Dimers is the subject of many studies of thermodynamics, photophysical properties - Optical and balance of Dimer-monomer that are considered [7-14]. Well understood that the ionic dye tends to accumulate in the diluted solution, which leads to the formation of dimers and sometimes higher-order accumulation. In such a case the molecular nature of dye is strongly influenced by parameters such as concentration, structure, ionic strength, temperature and the presence of organic solvents [7-10,13-16]
Data analysis (DATAN) is a program which was introduced by Kubista in 1993 and has the ability to calculate the number of species [17-22], spectral profiles and distribution curve of concentration of available species in solution whereas the only experimental data is as its input.
Kubista and colleagues developed a new way called approaching the physical limits, a special solution was provided that applied concentrations were calculated by assuming equilibrium and its applicability was shown by determining the acidic constants of forms 2 and 4 of fluorescein protonation. The theory and application of the physical constraints method was discussed by several papers [15,16,23-27].
An advantage of the method of Kubista and colleagues is that we can mix or make close together the hard and soft models. This can be a general strategy because you can apply different situations with only partial knowledge of chemistry systems. Approaching the physical limits for the samples that are in chemical equilibrium is applicable and measures the spectrum diagram. Samples should be different in physical properties such as temperature; pH and etc. and should be effective on concentrations of the components in a predictable way.
Thermodynamic equilibrium constant as predicted by formula of Vant's Hoff depends on the temperature:
Titration spectra of samples in the matrix A can be change into orthogonal vectors T and the P by NIPALS algorithm or any other equivalent method [20]. In which, A of absorbing matrix with dimensions n × m that n means the number of spectra and m means the number of data points per spectrum.
Assuming linearity of response, recorded spectra are as linear components.
Ci are vectors that contain concentrations of the components at different temperatures, two equations are related by a rotation [19].
Where R is the rotation matrix r × r. For two-component system,
For equilibrium of monomer-dimer, concentration of all monomers is constant:
The matrix R is characterized by r21. Value of r21 of dimer spectrum and concentration diagrams specifies concentration of monomer. Although, all the values of r21 are not acceptable mathematical solutions, they generate reasonable results according to the spectrum severity and non-negative concentrations and spectral responses that are obtained in a limited range of values of r21, for determination of the equilibrium constant of solution.
Spectrophotometry UV-Vis is widely used to identify and measure a large number of organic and inorganic species. Determination of equilibrium constants by spectrophotometric method is a good method for measuring the colorful chemical species dissolved in solvents. Titration consists of a series of measuring solution that is affected by adding a tested reactive, balance-like agent [15,16]. The reasons for widely using this method include broad application range, high sensitivity, moderate to high selectivity, good accuracy, easiness and being comfortable.
Surfactant is an abbreviation for surface active agents that are literally active in the meaning level. The materials that if a small amount of them is dissolved in a liquid, it will lead to low surface tension of the liquid are called surface active agents. Surfactant shows its main feature by reducing the surface tension of the water by air absorption at its surface and can also create surface absorption between two polar and non-polar liquids by adsorption liquid-liquid.
Experimental
Material and method
All the chemicals used were of analytical reagent grade. Neutral Red was purchased from Fluka and was used without additional purification. A stock solution (1.73 × 10⁻⁵ M) was prepared by dissolving these solid ionic dyes in water. The pH of the all solutions was kept constant at 7.00 using universal buffer. Three types of surfactants, anionic (SDS), cationic (CTAB) and neutral (X-100) were applied. Different percentages of surfactant solution (0.01 - 0.05 - 0.1) was used. In this work, we used Britton-Robinson Buffer at all stages of the experiment and the buffers at 1 to 10 pH were adjusted to 1. A quantity of 3 ml of Neutral Red solution with a concentration of 1.73 × 10⁻⁵ M is transferred to quartz tubes and at temperature of 5-55 ℃, spectroscopies was performed. In the next step, the spectroscopy is carried out by a mixture of Neutral Red with buffer at various pH values of 1-10 and surfactants with different percentages (0.01, 0.05, and 0.1) at temperature of 5-55 ℃. The absorbance variations were recorded in the range of 350 nm to 650 nm.
Apparatus
Absorption spectra were measured on Agilent HP-8453 UV-Vis spectrophotometer equipped with a quartz cell with a path length 1 cm. The pH values were measured by a HORIBA M-12 with applied of glass electrode. The temperature was controlled by a MLW thermostat MLW motorized water circulation.
Computer hardware and software
All absorption spectra where digitized at five data points/nm in the wavelengths 300-650 nm and transferred (in ASCII format) to an Athlon 2000 XP computer for analysis by MATLAB (Math works, Version 6.5) or for processing by using DATAN package [9].
Results and Discussion
Data was obtained by the absorption changes proportional to the temperature change in the range 5-55 ℃ in the wavelength range of 300-650 nm, in water and in the water - micellar environments CTAB, water - SDS0, water - triton X-100 and at various pHs. In water with increased temperature, Neutral Red absorption peak is increased at wavelength of 535 nm and absorption of about 500 nm is decreased, as shown in Figure 2a. In triton X-100 (0.01) with increasing temperature, Neutral Red absorption peak at wavelength of 530 nm is increased, at higher pH of the maximum absorption is shifted toward shorter wavelength, as shown in Figure 2d. In SDS (0.1) with increasing temperature, Neutral Red absorption peak at wavelength of 547 nm is decreased, as shown in Figure 2c. In CTAB (0.1) with increasing temperature, Neutral Red absorption peak at wavelength of 538 nm is increased, at higher pH of the maximum absorption is shifted toward shorter wavelength, as shown in Figure 2b.
With drawing Log KD according to 1/T, the values ΔS°, ΔH° were obtained, the relation between ΔS and ΔH reflects the electrostatic feature of dimerization of colorful ions. The relative dependence of monomer-dimer concentrations on temperature is obtained. The measured absorption spectra from Neutral Red were shown in the forms of monomer and dimer at Figure 3.
With increasing temperature, the monomer figure gets dominant on dimer form. So, the colorful spectrum at the highest temperature can be selected as an estimate for the next calculation. According to the equations of DATAN program it runs with experimental value r21 at predetermined intervals and repeats all the steps of calculation. The time repetition that all r21 values are tested is stopped. As a final result dimer spectrum, K°D, ΔS°, and ΔH° are selected according to the minimum statistical value χ2. χ2 is the sum of squared residuals that is used as a good measure and the its value shows the predictability of the model. This means that how the spectrum of the monomer and r21 is determined.
The general formula of χ2:
That Aexp is the predicted value and Acale is calculated out of the experimental data on point n.
We analyze the dimerization constant determination (temperature titration) on monomer-dimer, monomer-dimer and trimer and some other pattern showing other densities. Dimerization constant is measured at different temperatures that KD is decreased with the increased temperature and KD is dependent of Neutral Red concentration. From the dependence of log KD on 1/T, ΔH° and ΔS values were determined. The dimerization constants at 25 ℃ and thermodynamic parameters of the dimerization reactions of the Neutral Red in the water and micelle environments are listed in Table 1. In general, the extent of aggregation depends reciprocally on the temperature of the solution and is fully reversible. In all cases the dimerization and self-association are enthalpy favored and entropy disfavored. As described above, dimerization is presumed to be the dominant form of aggregation in applied concentration ranges in aqueous solutions of Neutral Red. This is corroborated by the constancy of the apparent enthalpy of association. In general, the extent of aggregation depends reciprocally on the temperature of the solution and is fully reversible. The observed relationship between entropy and enthalpy reflects an electrostatic nature of the dimerization phenomenon of this dye. The molecular association of ionic dyes in solutions is due to the strongly attractive electrostatic forces. The interaction between dye molecules is attributed predominantly to enthalpic rather than entropic reasons. The dimerization forces between the dye molecules are dispersive van der Waals interactions and KD depends on the size and rigidity of the dye molecules and also viscosity of surfactant at different concentration.
Conclusion
In this study using chemometric approach for spectrophotometric study of the thermodynamics of dimerization of Neutral Red dye in the water and micelle environments. First time, we reported dimerization constants of concentration diagrams for monomer and dimer and spectrum responses of monomer and dimer of the Neutral Red dye by DATAN program at the micellar environment and at various pHs. Thermodynamic parameters of ΔS and ΔH of dimerization is measured by dimer constant dependence on temperature (van't Hoff equation). To obtain more reliable estimates of the thermodynamics parameters we performed all experiments at three different types of surfactants and different concentrations of surfactant.