
International Journal of Experimental Spectroscopic Techniques
(ISSN: 2631-505X)
Volume 3, Issue 2
Research Article
DOI: 10.35840/2631-505X/8516

Article Formats
(Cuinse2)1-X (Tase)X Solid Solutions (0 < X ≤ 0.5): X-Ray Diffraction, Scanning Electron Microscopy, Differential Thermal Analysis and Magnetic Susceptibility
Table of Content
Figures
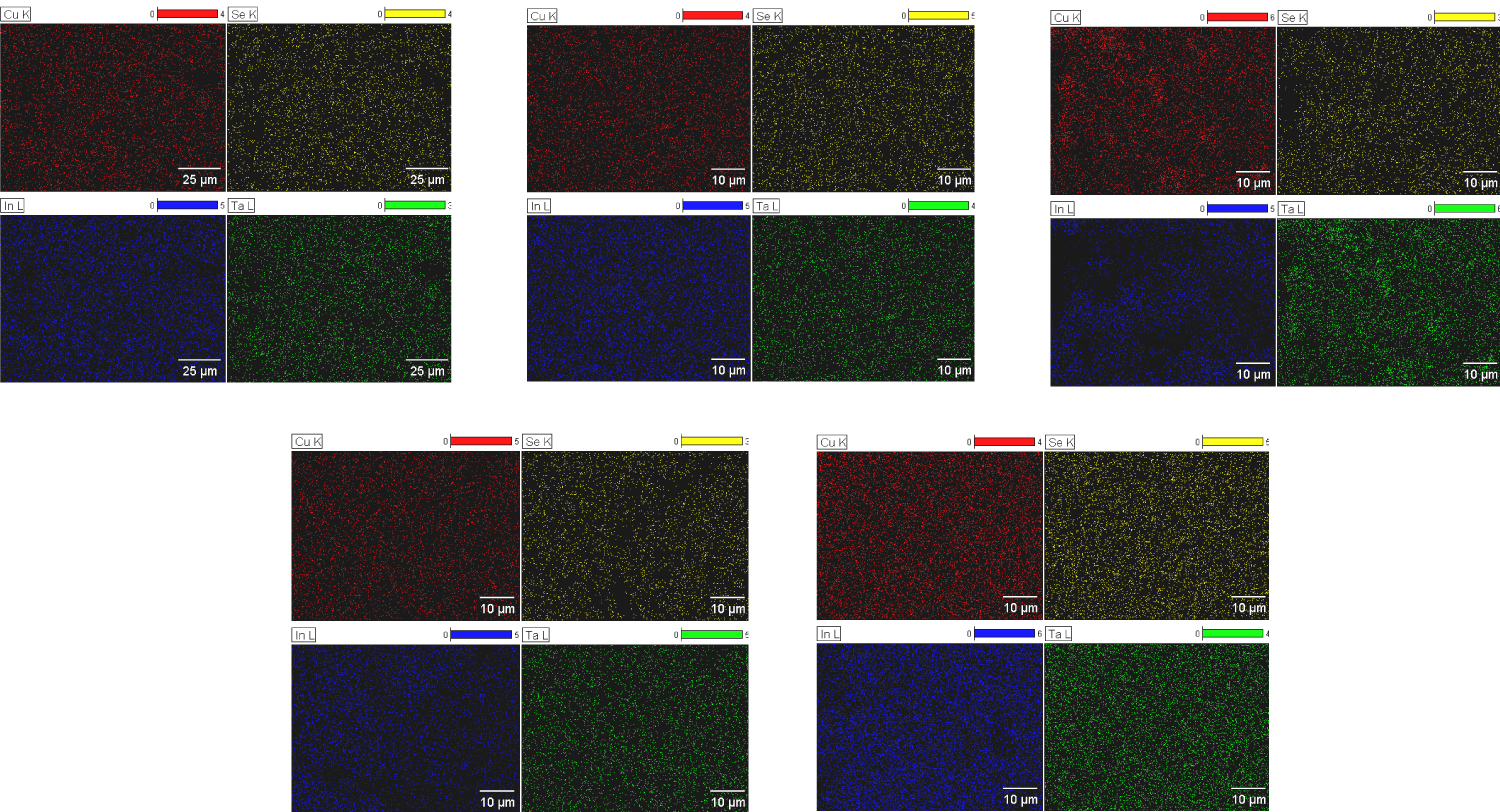
Figure 1: Distribution of Cu, Se, In and Ta in the samples x = 0.1...
Distribution of Cu, Se, In and Ta in the samples x = 0.1, 0.2, 0.3, 0.4 and 0.5.
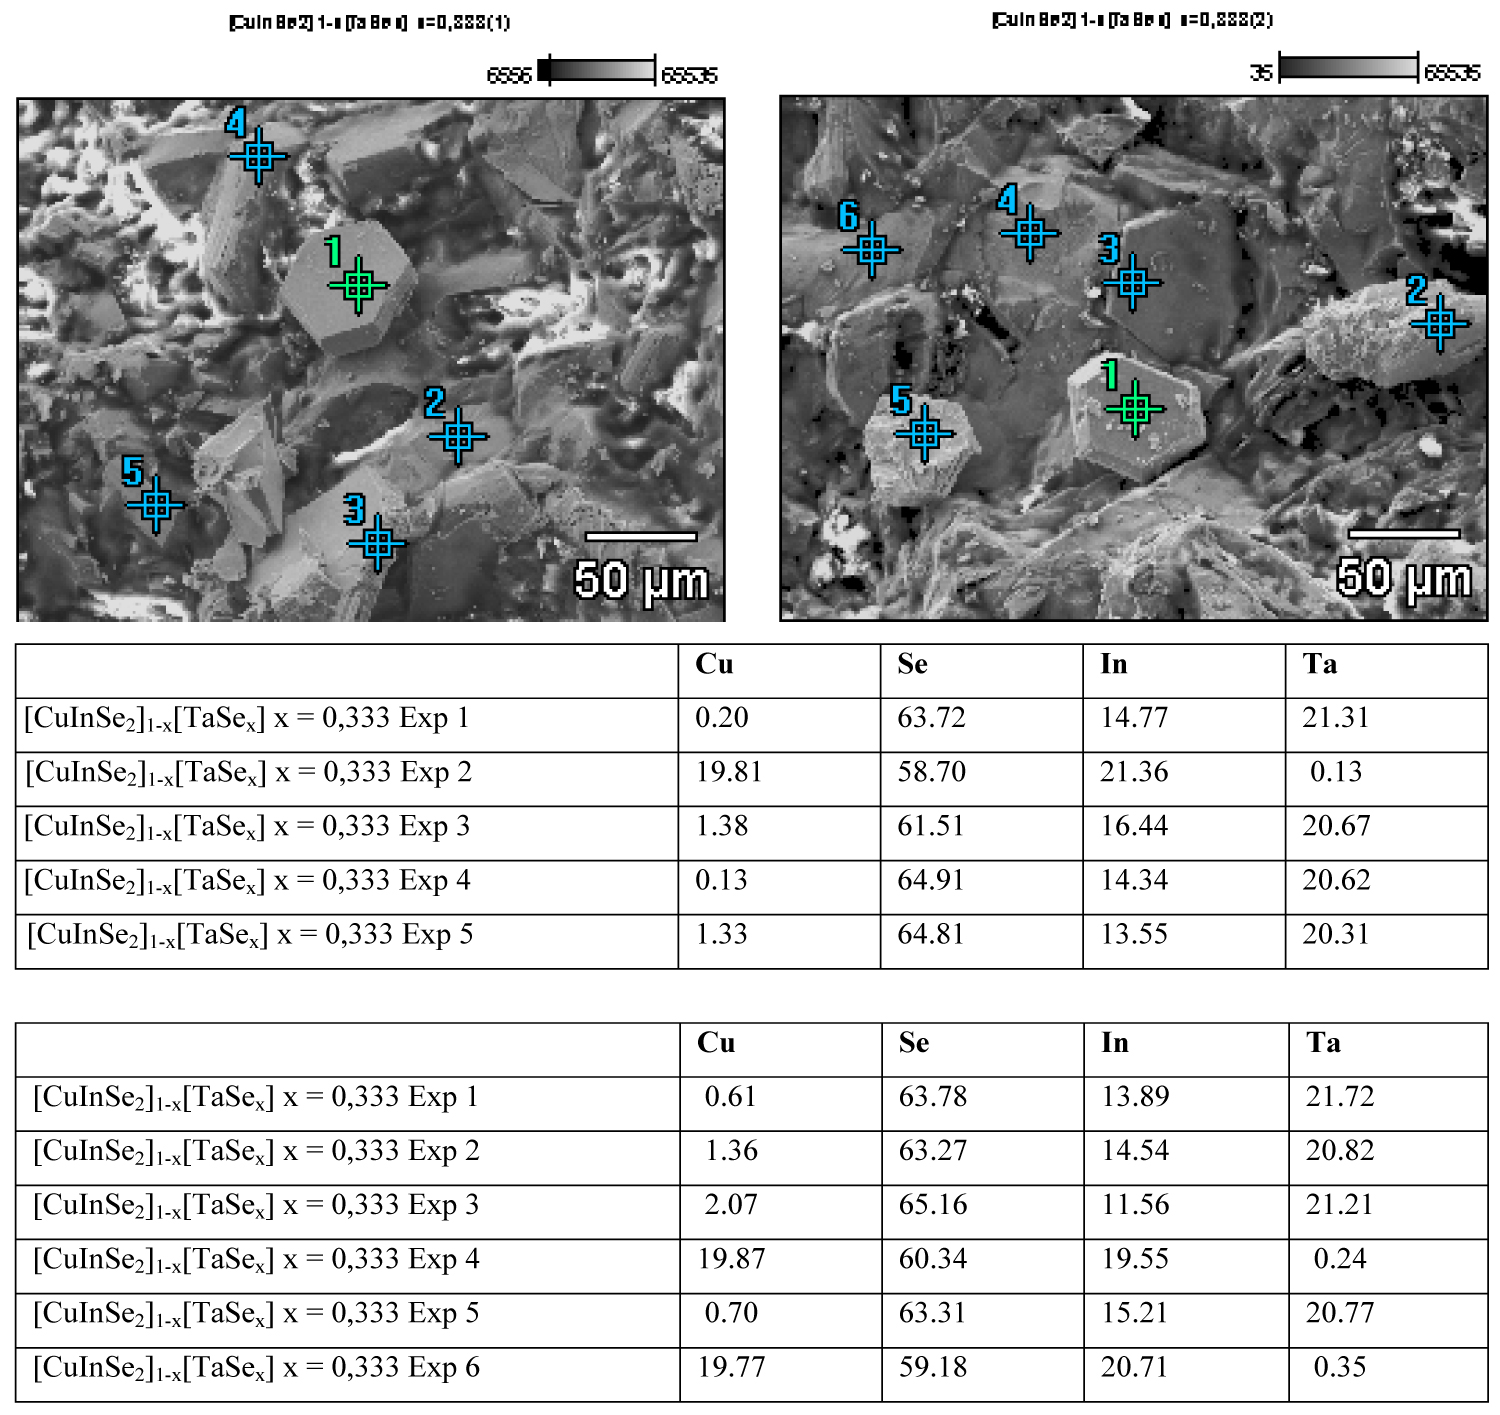
Figure 2: Microphotographs of sample x = 1/3. The tables show...
Microphotographs of sample x = 1/3. The tables show the atomic concentrations (%) for the experimental points (left photography → upper table and right photography → bottom table).
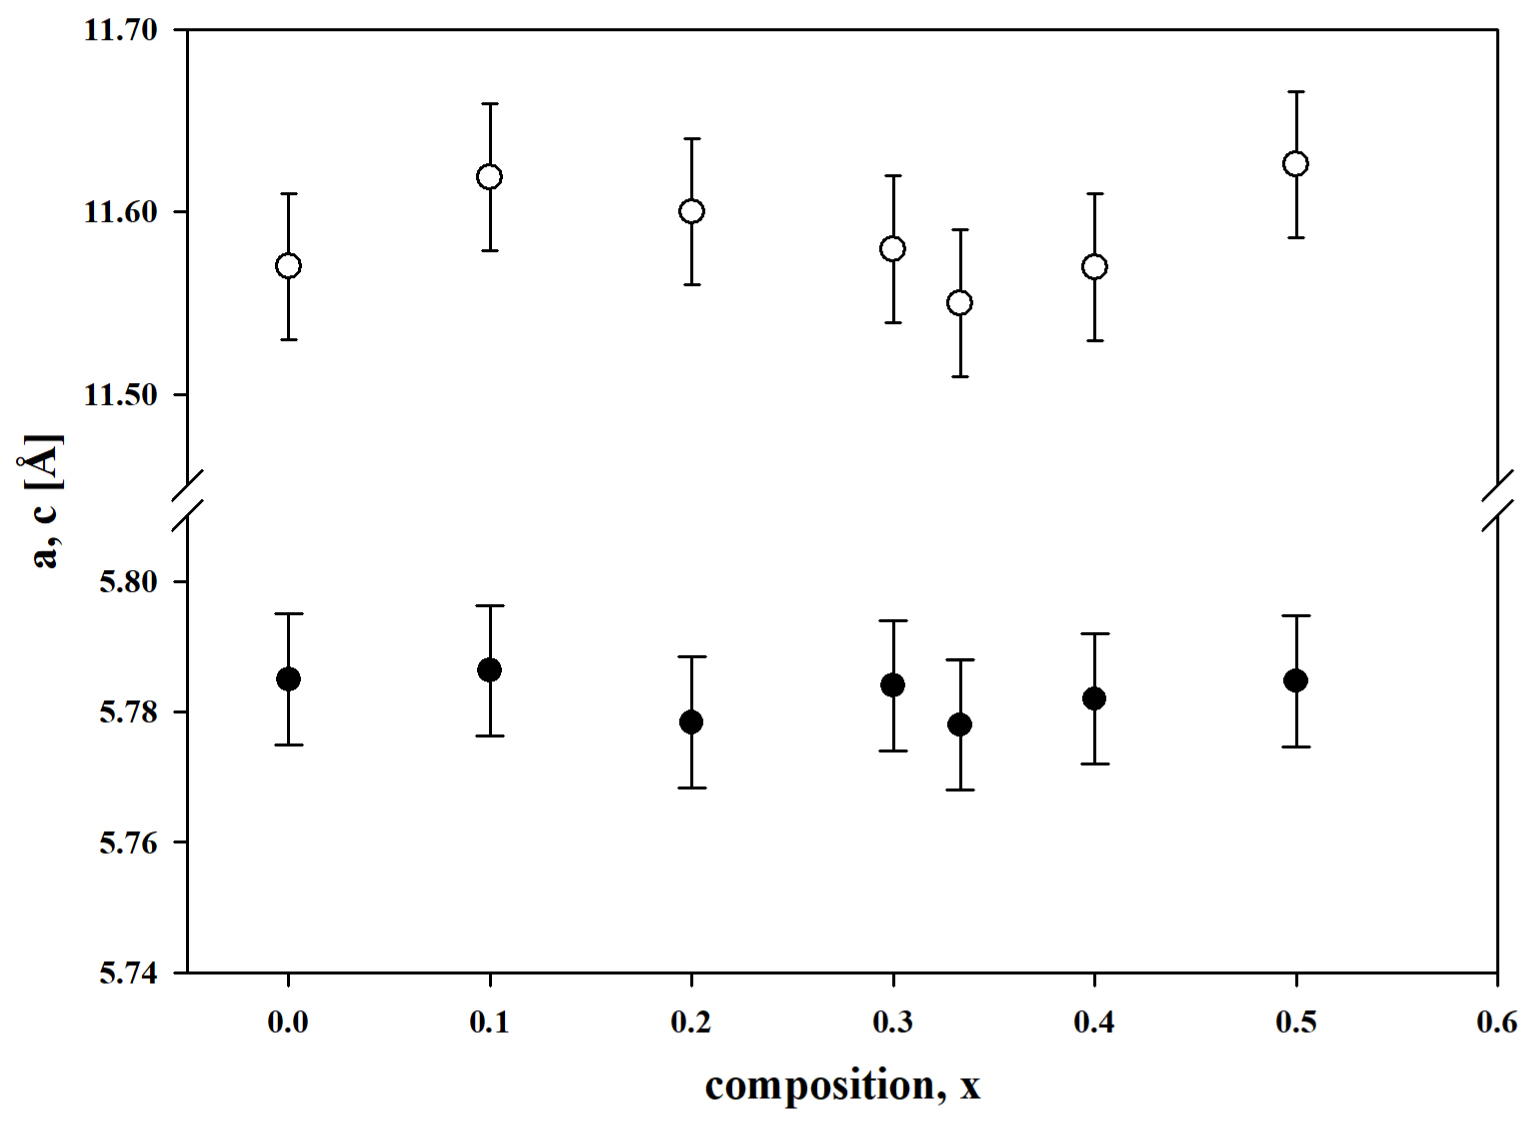
Figure 3: Lattice parameters of (CuInSe2)1-x (TaSe)x...
Lattice parameters of (CuInSe2)1-x (TaSe)x alloys. White circles: Parameter c; Black circles: Parameter a.
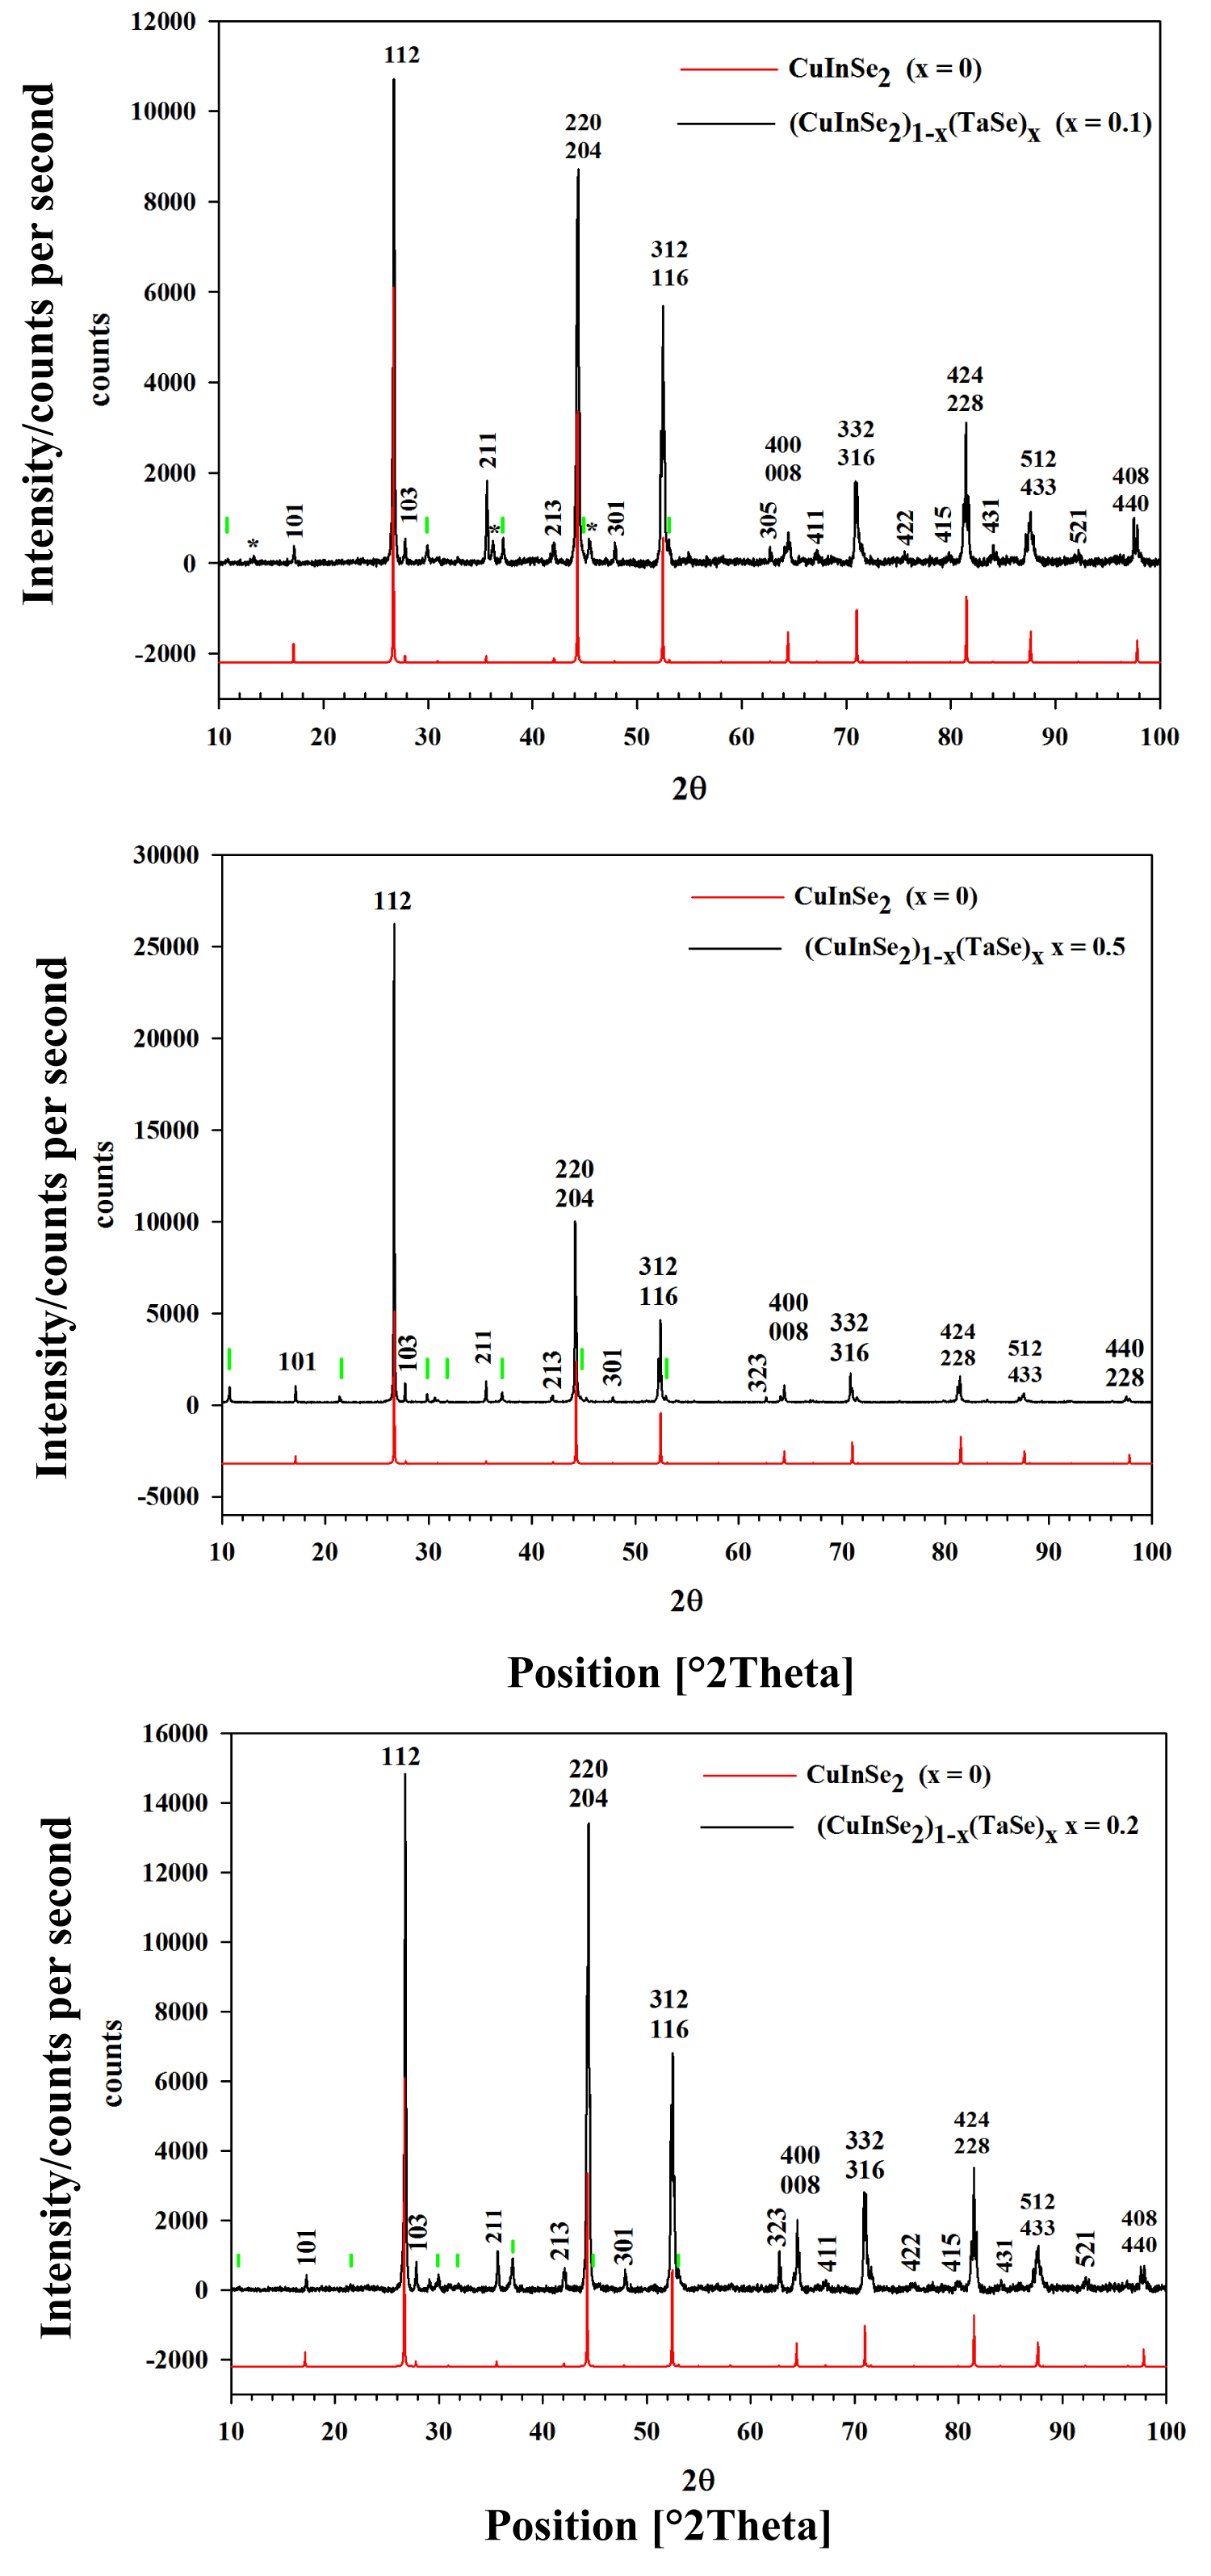
Figure 4: XRD patterns for samples x = 0.1 (upper), x = 0.2 (middle)...
XRD patterns for samples x = 0.1 (upper), x = 0.2 (middle) and x = 0.5 (bottom). In red: CuInSe2 calculated diffraction pattern using Powder Cell software [47]. Green ticks denote the positions of the stronger peaks for TaIn0.67Se2 phase. Asterisks signal not identified peaks.
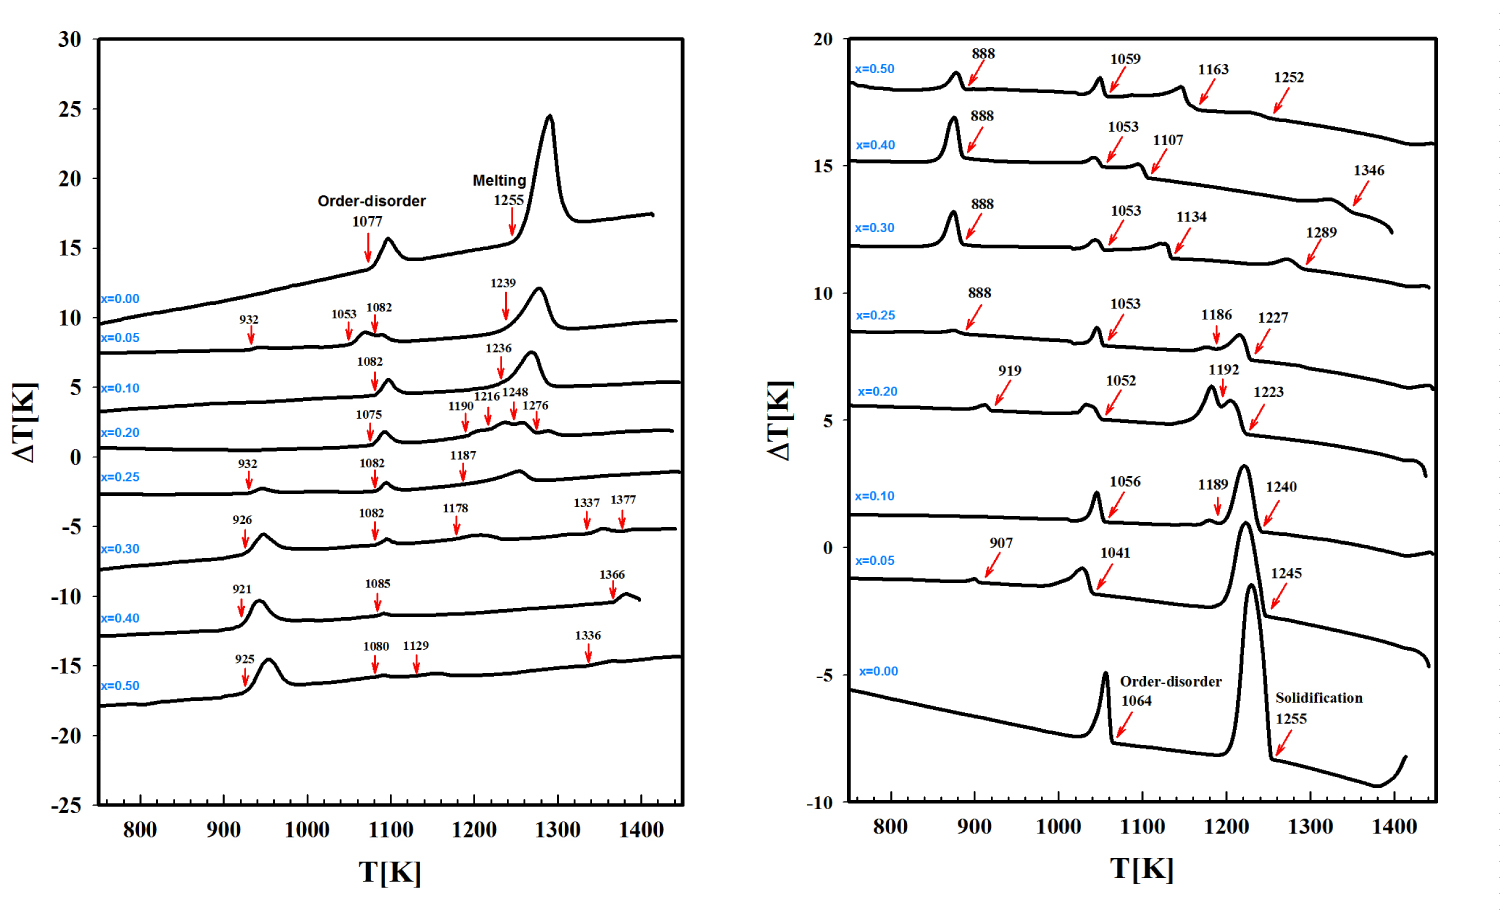
Figure 5: DTA thermograms for (CuInSe2)1-x (TaSe)x...
DTA thermograms for (CuInSe2)1-x (TaSe)x alloys, 0 ≤ x ≤ 0.5. Left: Heating cycle; Right: Cooling cycle.

Figure 6: T-x phase diagram for (CuInSe2)1-x (TaSe)x alloys...
T-x phase diagram for (CuInSe2)1-x (TaSe)x alloys, 0 ≤ x ≤ 0.5. Black circles: heating cycle; White circles: cooling cycle; α: Ordered chalcopyrite-like phase; α': Semi-ordered chalcopyrite phase; β: Disordered zincblende phase; L: Liquid phase.
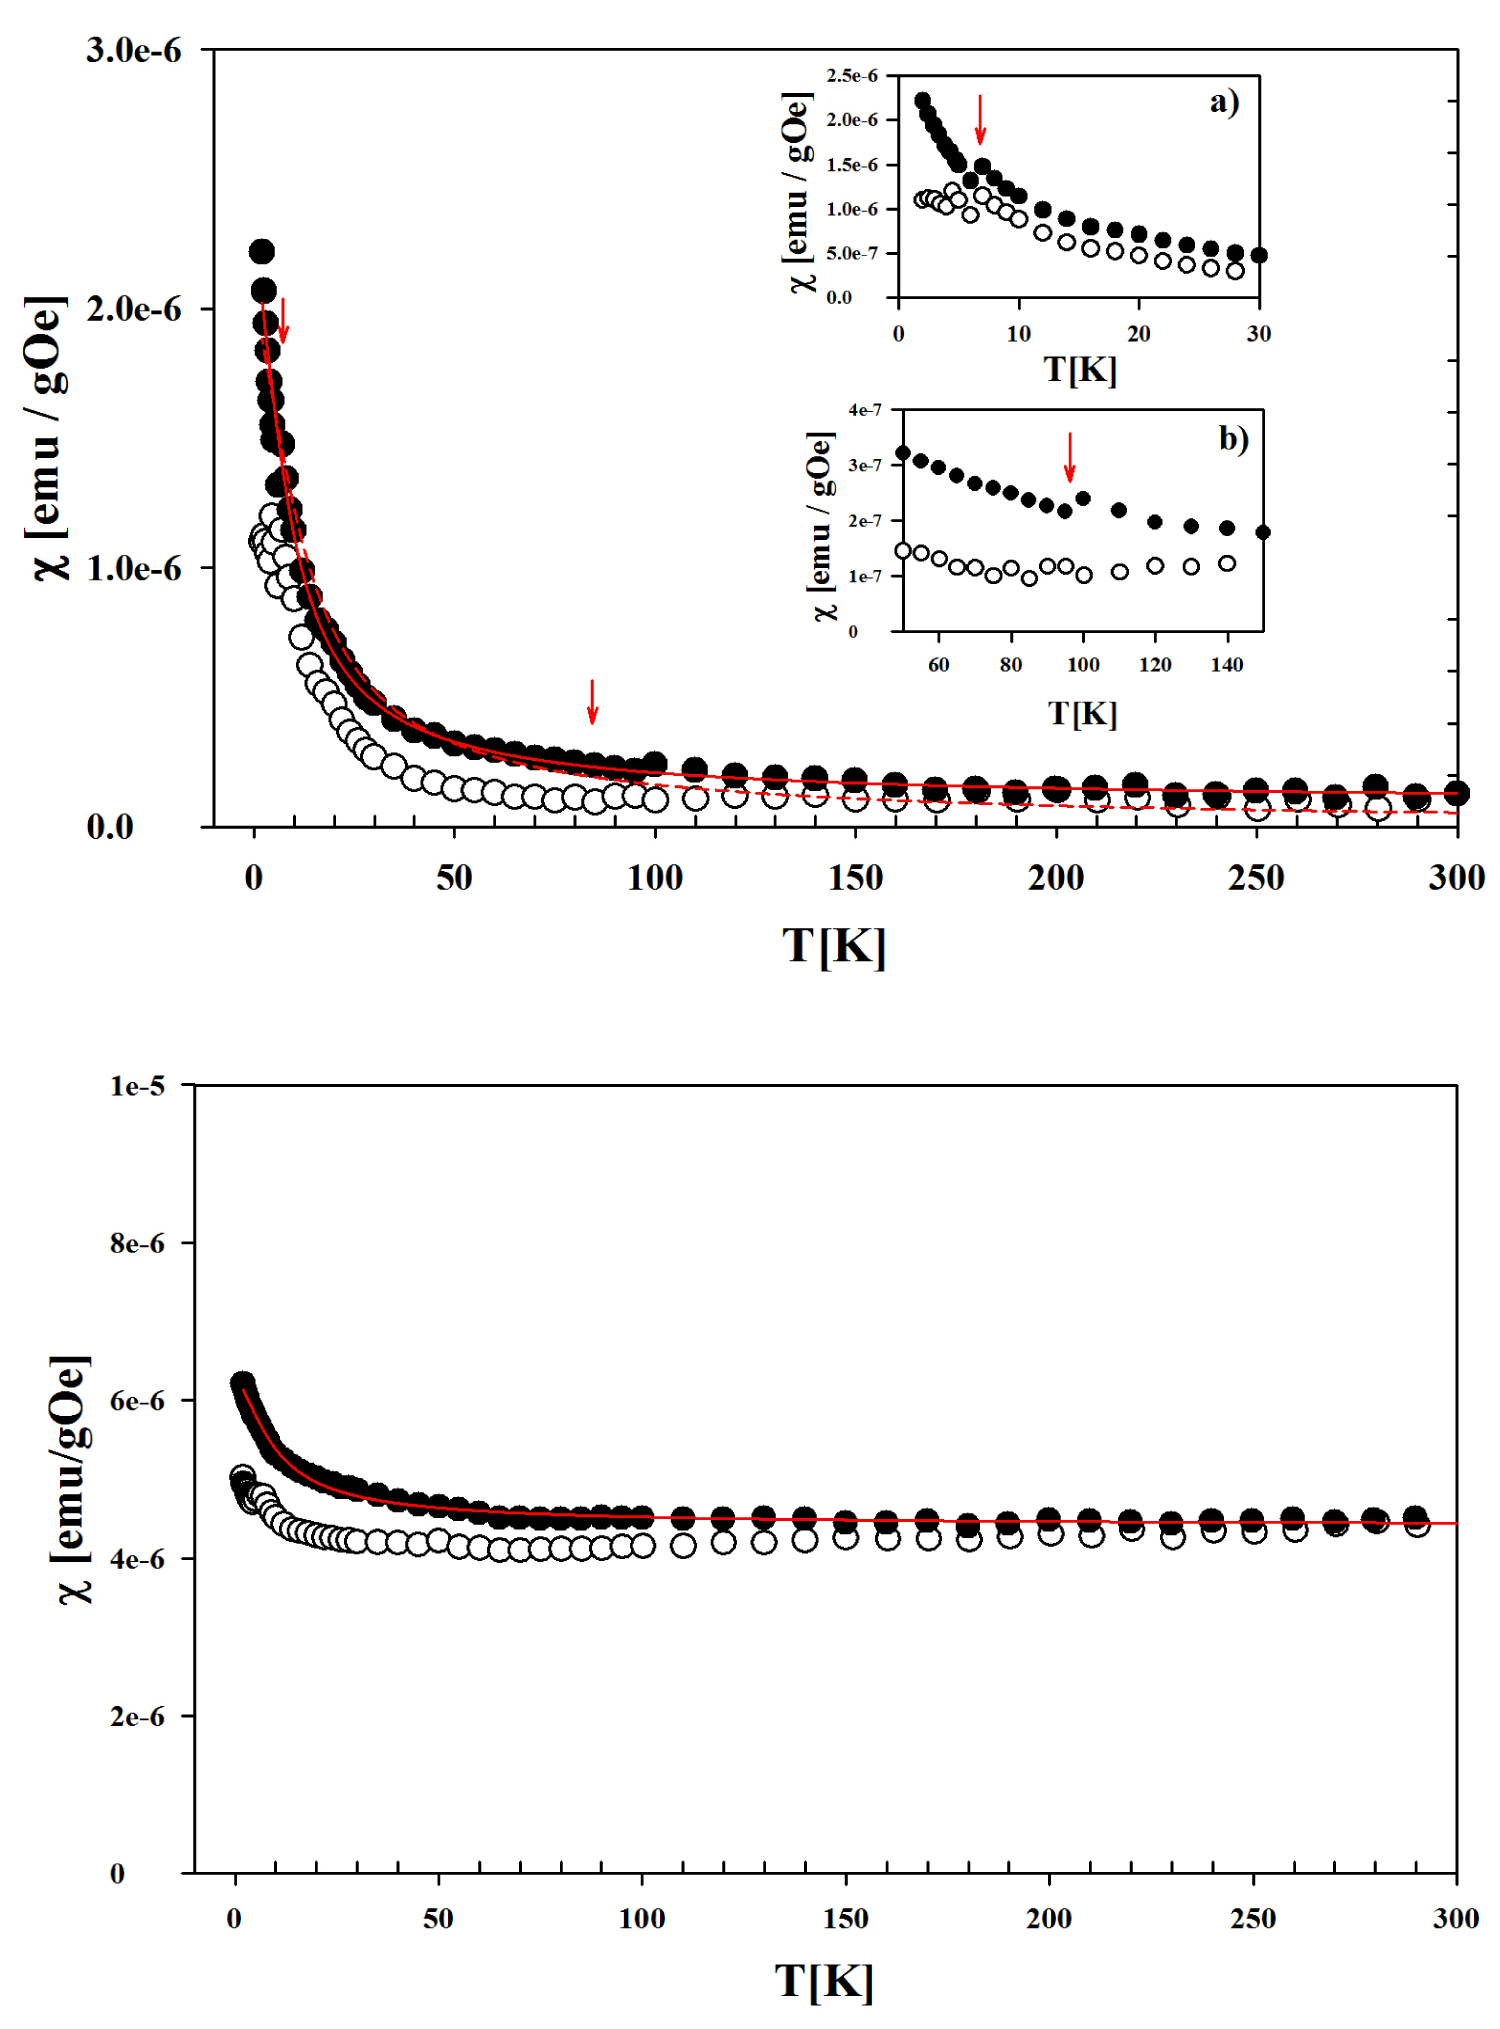
Figure 7: DC magnetic susceptibility of samples x = 0.05 (A) and x = 1/2 (B)...
DC magnetic susceptibility of samples x = 0.05 (A) and x = 1/2 (B) of the (CuInSe2)1-x (TaSe)x solid solutions. ZFC: White circles; ZC: Black circles; Red lines: Fit with a Langevin function.
Tables
Table 1: CuInSe2: TM alloys previously reported in the literature.
Table 2: Microphotographs and measured stoichiometry for (CuInSe2)1-x (TaSe)x alloys with x = 0.1, 0.2, 0.3, 0.4 and 0.5. In red the nominal stoichiometry.
Table 3: Values of the covalent radii for Cu, In and Ta.
Table 4: Results of the fits for sample x = 0.05 (Figure 6).
References
- Shay JL, Wernick JH (1974) Ternary chalcopyrite semiconductors: Growth, electronic properties, and applications. Pergamon Press, Oxford.
- Madelung O (2004) Semiconductors data handbook. Springer, Berlin, 691.
- Shay JL, Wagner S (1975) Efficient CuInSe2/CdS solar cells. Appl Phys Lett 27: 89.
- Stolt L, Hedström (1993) ZnO/CdS/CuInSe2 thin‐film solar cells with improved performance. J Appl Phys Lett 62: 597.
- Cahen D (1989) Defect chemical explanation for the effect of air anneal on CdS/CuInSe2 solar cell performance. Appl Phys Lett 54: 558.
- Medvedkin GA, Ishibashi T, Nishi T, Hayata K, Hasewaga Y, et al. (2000) Room temperature ferromagnetism in novel diluted magnetic semiconductor Cd1-xMnxGeP2. Japanese Journal of Applied Physics 39.
- Cho S, Choi S, Cha G-B, Hong SC, Kim Y, et al. (2002) Room-temperature ferromagnetism in (Zn1-xMnx)GeP2 semiconductors. Phys Rev Lett 88: 257203.
- Cho S, Cho J, Hong SC, Cho S (2003) Mn-doped ZnGeAs2 and ZnSnAs2 single crystals: Growth, electrical, and magnetic properties. Journal of the Korean Physical Society 42: S739-S741
- Demin RV, Koroleva LI, Marenkin SF, Mikhailov S, Aminov T, et al. (2005) Room-temperature ferromagnetism in Mn-doped CdGeAs2 chalcopyrite. J Magn Magn Mater 290-291: 1379-1382.
- Koroleva LI, Pavlov V Yu, ZashchirinskiĬ DM, Marenkin SF, VarnavskiĬ SA, et al. (2007) Magnetic and electrical properties of the ZnGeAs2: Mn chalcopyrite. Physics of the Solid State 49: 2121-2125.
- Koroleva LI, ZashchirinskiĬ DM, Khapaeva TM, Marenkin SF, Fedorchenko IV, et al. (2009) Manganese-doped ZnSiAs2 chalcopyrite: A new advanced material for spintronics. Phys Solid State 51: 303-308.
- Kilanski L, Gorska M, Domukhovski V, Dobrowolski W, Anderson JR, et al. (2008) Zn(1-x)(Mn,Co)xGeAs2 ferromagnetic semiconductor: Magnetic and transport properties. Acta Physica Polonica 114: 1151-1157.
- Kochura AV, Laiho R, Lashkul A, Lähderanta E, Shakhov MS, et al. (2008) Synthesis and magnetic properties of Mn-doped Cd0.1Zn0.9GeAs2 solid solutions. Journal of Physics: Condensed Matter 20: 1-5.
- Lin LJ, Tabatabaie N, Wernick JH, Hull GW, Meagher B (1988) Optical, electronic and magnetic properties of the dilute magnetic semiconductor Mn:CuInTe2. Journal of Electronic Materials 17: 321-324.
- Shand PM, Polstra PA, Miotkowski I, Crooker BC (1994) Magnetic behavior of (CuIn)1-xMn2xTe2. Journal of Applied Physics 75: 5731-5733.
- Tsuji N, Kitazawa H, Kido G (2002) Electric and magnetic properties of Mn- and Fe-doped CuInS2 compounds. Physics Status Solidi 189: 951-954.
- Yao J, Rudyk BW, Brunetta CD, Knorr KB, Figore HA, et al. (2012) Mn incorporation in CuInS2 chalcopyrites: Structure, magnetism and optical properties. Materials Chemistry and Physics 136: 415-423.
- Yao J, Brunetta CD, Aitken JA (2012) Suppression of antiferromagnetic interactions through Cu vacancies in Mn-substituted CuInSe2 chalcopyrites. J Phys Condens Matter 24: 086006.
- Yao J, Kline CN, Gu H, Yan M, Aitken JA (2009) Effects of Mn substitution on the structure and properties of chalcopyrite-type CuInSe2. J Solid State Chem 182: 2579-2586.
- Demin RV, Koroleva LI, Marenkin SF, Novotortsev VM, Trukhan BM, et al. (2005) Heterogeneous magnetic state in Mn-doped CdGeP2 and CuGaTe2. Proceedings of the Third Moscow International Symposium on Magnetism.
- Schorr S, Hoehne R, Spemann D, Doering Th, Korzun BV (2006) Magnetic properties investigations of Mn substituted ABX2 chalcopyrites. Physica Status Solidi 203: 2783-2787.
- Novotortsev VM, Shabuninab GG, Koroleva LI, Aminov TG, Demin RV, et al. (2007) Superparamagnetism in Mn-doped CuGaTe2. Inorganic Materials 43: 12-17.
- Torres-Cuenza S, Grima-Gallardo P, Muñoz M, Durán S, Quintero M, et al. (2015) Magnetic behavior of the alloy (CuInSe2)1-x(FeSe)x with x = 0.5. Acta Científica Venezolana 66: 56-59.
- Grima-Gallardo P, Calderón E, Muñoz-Pinto M, Durán-Piña S, Quintero M, et al. (2008) Synthesis and characterization of Cu3TaIn3Se7 and CuTa2InTe4. J Physica Status Solidi 205: 1552-1559.
- Zhao YJ, Zunger A (2004) Electronic structure and ferromagnetism of Mn-substituted CuAlS2, CuGaS2, CuInS2, CuGaSe2 and CuGaTe2. Phys Rev B 69: 104422.
- Zhao YJ, Zunger A (2004) Site preference for Mn substitution in spintronic CuMIIIXVI2 chalcopyrite semiconductors. Physical Review B 69: 075208.
- Kochura AV, Ivanenko SV, Lashkul A, Kochura EP, Marenkin SF, et al. (2013) Magnetic Properties of AIIBIVCV2 compounds doped with Mn. Journal of Nano and Electronic Physics 5: 04013-04016.
- Kilanski L, Dobrowolski W, Szymczak R, Dynowska E, Wójcik M, et al. (2014) Chalcopyrite semimagnetic semiconductors: From nanocomposite to homogeneous material. Science of Sintering 46: 271-281.
- Aitken JA, Tsoi GM, Wenger LE, Brock SL (2007) Emergence of pressure-induced metamagnetic-like state in Mn-doped CdGeAs2 chalcopyrite. Chem Mater 83: 1809.
- Dietl T, Ohno H, Matsukura F (2001) Hole-mediated ferromagnetism in tetrahedrally coordinated semiconductors. Phys Rev B 63: 195205.
- Katamani T, Akai HJ (2003) Magnetic properties of chalcopyrite-based diluted magnetic superconductors. Journal of Superconductivity 16: 95-97.
- Katamani T, Akai HJ (2003) The magnetic properties in transition metal-doped chalcopyrite semiconductors. Materials Science in Semiconductor Processing 6: 389-391.
- Mahadevan P, Zunger A (2001) Room-Temperature ferromagnetism in Mn-Doped semiconducting CdGeP2. Phys Rev Lett 88: 047205.
- Akai H (1998) Ferromagnetism and its stability in the diluted magnetic semiconductor (In, Mn)As. Phys Rev Lett 81: 3002.
- Dietl D (2007) Origin of ferromagnetic response in diluted magnetic semiconductors and oxides. J Phys Condens Matter 19: 165204.
- Grima-Gallardo P, Muñoz-Pinto M, Durán-Piña S, Quintero M, Delgado GE, et al. (2007) Preparation and investigation of (CuInSe2)1-x(TaSe)x solid solutions (0 < x < 0.5). Revista Mexicana de Física S 53: 259-261.
- Grima-Gallardo P, Muñoz M, Durán S, Delgado GE, Quintero M, et al. (2007) Preparation and investigation of the quaternary alloy CuTaInSe3. Materials Research Bulletin 42: 2067-2071.
- Delgado GE, Mora AJ, Grima-Gallardo P, Durán S, Muñoz M, et al. (2008) Crystal structure of the quaternary alloy CuTaInSe3. Crystal Research & Technology 43: 783-785.
- P Grima-Gallardo, E Calderón, M Muñoz-Pinto, S Durán-Piña, M Quintero, et al. (2008) Synthesis and characterization of Cu3TaIn3Se7 and CuTa2InTe4. Physica Status Solidi 205: 1552-1559.
- (2011) Hitachi Launches World's Highest Resolution FE-SEM. Nanotech Now.
- Sunandana CS, Chandrasekaran K, Aravamudan G, Subba Rao GV (1982) Electrical properties of InxMCh2 (M ≡ Nb, Ta; Ch ≡ S, Se). Journal of the Less Common Metals 84: 115-118.
- https://environmentalchemistry.com/yogi/ periodic/covalentradius.html.
- https://www.webelements.com/periodicity /covalent_radius/.
- http://crystalmaker.com/support/tutorials /crystalmaker/atomic-radii/index.html.
- http://chemistry-reference.com/images /covalent%20radius%20table.jpg.
- https://www.researchgate.net/publication /23573185_Molecular_Single Bond_ Covalent_Radii_for_Elements_1-118/figures?lo=1.
- http://www.ccp14.ac.uk/ccp/web-mirrors/ powdcell/a_v/v_1/powder/e_cell.html.
- Delgado GE, Mora AJ, Grima-Gallardo P, Quintero M (2008) Crystal structure of CuFe2InSe4 from X-ray powder diffraction. Journal of Alloys and Compounds 454: 306-309.
- Grima-Gallardo P, Torres S, Quintero M, Nieves L, Moreno E, et al. (2015) Phase diagram of (CuInSe2)1-x(FeSe)x alloys. Journal of Alloys and Compounds 630: 146-150.
Author Details
P Grima-Gallardo1,2*, L Méndez2, GE Delgado3, H Cabrera4, E Pérez-Cappé5, I Zumeta-Dubé6, A Rodríguez6, JA Aitken7 and DP Rai8
1Department of Physics, Faculty of Science, Semiconductor Studies Center, University of Andes, Merida, Venezuela
2National Center for Optical Technology, Merida, Venezuela
3Department of Chemistry, Faculty of Science, Lab. Crystallography, University of Andes, Merida, Venezuela
4SPIE-ICTP Anchor Research in Optics Laboratory, International Centre for Theoretical Physics (ICTP), Trieste, Italy
5Institute of Materials Science and Technology, La Habana University, Vedado, Cuba
6National Polytechnic Institute, Center for Research in Applied Science and Advanced Technology, Unidad Legaria, Mexico D.F, Mexico
7Department of Chemistry and Biochemistry, Duquesne University, Pittsburgh, USA
8Department of Physics, Pachhunga University College, Aizawl, India
Corresponding author
P Grima-Gallardo, Department of Physics, Faculty of Science, Semiconductor Studies Center, University of Andes; National Center for Optical Technology, Merida, Venezuela.
Accepted: July 10, 2018 | Published Online: July 12, 2018
Citation: Grima-Gallardo P, Méndez L, Delgado GE, Cabrera H, Pérez-Cappé E, et al. (2018) (Cuinse2)1-X (Tase)X Solid Solutions (0 < X ≤ 0.5): X-Ray Diffraction, Scanning Electron Microscopy, Differential Thermal Analysis and Magnetic Susceptibility. Int J Exp Spectroscopic Tech 3:016.
Copyright: © 2018 Grima-Gallardo P, et al. This is an open-access article distributed under the terms of the Creative Commons Attribution License, which permits unrestricted use, distribution, and reproduction in any medium, provided the original author and source are credited.
Abstract
Polycrystalline samples of the (CuInSe2)1-x (TaSe)x system were prepared by the melt and anneal technique in the composition range 0 < x ≤ 0.5. Products were characterized by X-Ray Diffraction (XRD), Scanning Electron Microscopy (SEM), Differential Thermal Analysis (DTA) and SQUID techniques. From XRD and SEM, it was found that the solubility of TaSe in CuInSe2 is around 10%; however, samples up to x = 0.5 are composed by a mean tetragonal CuInSe2-like phase with traces of TaIn0.67Se2. A preliminary T-x phase diagram is presented. DC magnetic susceptibility measurements as a function of temperature using the ZFC-FC protocol were performed in samples x = 0.05 and 0.5. The magnetic behavior evolves from paramagnetic to weak ferromagnetic. In both samples, the presence of hysteresis between FC and ZFC curves suggest the presence of magnetic clusters; fitting FC curves with a Langevin function it was found that clusters are composed for ~103 Ta-atoms.
Introduction
CuInSe2 is an AI-BIII-CVI2 semiconductor material which crystallize in the tetragonal chalcopyrite structure, space group (No122), widely studied because of its applications in the photovoltaic industry [1-5]. Moreover, the discovery in the last years of room temperature ferromagnetism (RT-FM) in the analogous AII-BIV-CV2 compounds doped with transition metals (TM) [6-22] has prompted a new and renewed interest in his research. Particularly, the magnetism of CuInSe2 doped and/or alloyed with Mn, Fe and Ta has been reported before [18,19,23,24] founding paramagnetic, superparamagnetic and spinglass behaviors (Table 1).
RT-FM arise from the interaction of holes (created by substitution of BIV or BIII cations by TM) with the local moment of the TM d electrons [25,26]; however, it is also argued that it is due by the presence of magnetic secondary phases such as MnP and MnAs [26-30]. Kochura, et al. in samples prepared by solid state reaction under the condition of fast cooling, found that exist three types of magnetic species in AIIBIVCV2: Mn alloys: a) Substitution of Mn ions making Mn complexes (especially dimers); b) MnAs micro-precipitates and c) MnAs nanosize precipitates (clusters with a mean diameter of 3 nm) [27].
Although the origin of RT-FM is still matter of investigation, it is well established that is composition dependent: at low values of x, the alloy shows a typical paramagnetic behavior (or also superparamagnetic) [9,11] whereas for higher values of x, a critical xc value is attained for which, the paramagnetic→ferromagnetic transition occurs. It is also worth to note that Tc values are approximately the same for all AIIBIVCV2: Mn alloys suggesting that this transition is related to Mn-based secondary phases more than substitution of cations for Mn2+ in the ternary matrix.
It is interesting to compare theoretical calculations with experimental results. Katamani, et al. [31,32], using KKR-CPA-LDA method, predict that ferromagnetic states are stable in (Cd1-xVx)GeP2 and (Cd1-xCrx)GeP2 alloys, whereas (Cd1-xMnx)GeP2, (Cd1-xFex)GeP2 and (Cd1-xCox)GeP2 must show spinglass-like ground states (calculations were made using x = 0.1). They also found that Ti and Ni substitutions in CdGeP2 could not have a net magnetic moment (the same are applicable to ZnGeP2 and CdSiAs2). On the other hand, the ferromagnetic state was found to be stable in AgGaS2 (CuAlS2) doped with Ti, V, Cr and Mn, whereas doping with Fe, Co and Ni must stabilizes a spinglass-like state. The work of Zhao, et al. [25], using first principle calculations, coincides with Katamani and predicts that Mn doping at the III site in AIBIIICVI2 compounds provides holes that must stabilize ferromagnetic coupling between Mn ions. The predictions of both works (Katamani and Zhao) are contradictory that which has been observed experimentally! The reason for the discrepancies between theoretical expectations and experimental results is not clear until now. It has been suggested that stabilization of ferromagnetism is also due to the interaction of holes with Mn magnetic moments induced by:
b) Non-uniform spatial distribution of carriers and/or and magnetic ions [35]; or
c) Nanoscale phase separation, driven either by randomness in the carrier and spin subsystems or by limited solubility of transition metals in the host semiconductor, which leads to spinodal decomposition into regions with a small and a large concentration of the magnetic constituents [35].
It is evident that additional experimental work, in greater variety of systems and with larger concentration of the transition metal dopant, is necessary.
In the present work we report the preparation and characterization of the (CuInSe2)1-x (TaSe)x solid solutions system in the composition range 0 < x ≤ 0.5, as a part of our systematic research in AI-BIII-CVI2 alloys with TM. Some partial results had been previously reported: XRD diffraction and DTA were presented as short note in a conference [36], for sample x = 0.5 (CuTaInSe3) the preparation and crystal structure [37,38] and for sample x = 0.25 the magnetic susceptibility [39]. Here, in this work, we are added a more exhaustive analysis of XRD diffraction, identification of the phases by SEM measurements, a preliminary T-x phase diagram, and DC magnetic susceptibility measurements for samples x = 0.05 and x = 0.5.
Experimental Procedure
Preparation
Samples were prepared in steps of x = 0.1 in the composition range 0 < x ≤ 0.5 and in addition samples x = 0.05 and 1/4 were also prepared. Polycrystalline ingots, of about 1 g were prepared by the usual melt and anneal technique. Starting materials (Cu, In, Ta, and Se) with a nominal purity of 99.99 wt. % in the stoichiometric ratio were mixed together in an evacuated (10-4 Torr) and sealed quartz tube with the inner walls previously carbonized in order to prevent chemical reaction of the elements with quartz. The quartz ampoule is heated until 493 K (melting point of Se) keeping this temperature for 48 h and shaking all the time by means of a electromechanical motor. This procedure guarantees the formation of binary species at low temperature avoiding the existence of Se free gas at high temperature, which could produce explosions or a Se deficiency in the ingot. Then the temperature is slowly increased until 1423 K, with the mechanical shaker connected for a better mix of the components. After 24 h, the cooling cycle begins until the anneal temperature (800 K) with the mechanical shaker disconnected. The ampoule is keeping at the annealing temperature during 1 month in order to assure the thermal equilibrium. Then the furnace is switching off.
Scanning Electron Microscopy (SEM)
The stoichiometric relation of the samples was investigated by scanning electron microscopy (SEM) technique, using Hitachi S2500 equipment. The micro chemical composition was found by an energy-dispersive x-ray spectrometer (EDS) coupled with a computer-based multichannel analyzer (MCA), (Delta III analysis and Quantex software, Kevex). For the EDS analysis, Kα lines were used. Accelerating voltage was 15 kV. The samples were tilted 35 degrees. A standarless EDS analysis was made with a relative error of ± 5-10% and detection limits of the order of 0.3 wt. %, where the k-ratios are based on theoretical standards.
X-Ray Diffraction (XRD)
X-ray powder diffraction data was collected by means of a diffractometer (Bruker D5005) equipped with a graphite monochromator (CuKα, λ = 1.54059 Å) at 40 kV and 20 mA. Silicon powder was used as an external standard. The samples were scanned from 10-100° 2θ, with a step size of 0.02° and counting time of 20 s. The Bruker analytical software was used to establish the positions of the peaks from the CuKα1 component and to strip mathematically the CuKα2 components from each reflection. The peak positions were extracted by means of single-peak profile fitting carried out through the Bruker DIFFRACplus software. Each reflection was modeled by means of a pseudo-Voigt function.
Differential Thermal Analysis (DTA)
The differential Thermal Analysis (DTA) was carried out in a fully automatic Perkin-Elmer apparatus with Pt/Pt-Rh thermocouples. Au was used as internal standard. The heating and cooling rates were controlled to 20 Kh-1. Transition temperatures were manually obtained from the ΔT vs. T graph with the criteria that the transition occurs at the intersection of the base line with the slope of the thermal transition peak, as usually. The maximum error committed in the determination of transition temperatures by this method was estimated at ± 10 K.
Magnetic susceptibility
DC magnetic susceptibility as a function of temperature measurements, χ(T), were performed on a Quantum Design SQUID magnetometer, equipped with a superconducting magnet able to produce fields up to 5 T. The samples in the form of powder were compacted with a piece of cotton inside the sample holder in order to prevent any movement. Zero-field-cooling and field cooling (ZFC-FC) measurements were carried out in the temperature range of 2-300 K.
Analysis and Discussion
As it is routine in our laboratory, stoichiometric relations of all the samples were checked out in a thin slide (~1 mms thick) cut off from the center of the ingot. The results are show in Table 2. The experimental error is estimated in the first decimal place (± 0.1). The sum of the percentages does not always add exactly 100% by approximations of decimals.
a) Deviations in the stoichiometry for Cu and Se, in average, lies inside of the estimated experimental error (~10%);
b) In the case of In and Ta, deviations (always in average) are higher that the experimental error (20 and 30%, respectively);
c) In average, the quantity of Ta in the samples does not excess 10%, suggesting that this is the limit of solid solubility.
In particular, in sample x = 0.1, Cu copper stoichiometry is close to nominal, whereas In and Ta are somewhat low. For sample x = 0.2, three experiences give a similar behavior to sample x = 0.1 but two experiments (2 and 3) give lower stoichiometry values for Cu and In and higher for Ta with respect to nominal. Behavior of sample x = 0.3 is similar to sample x = 0.2. For samples x = 0.1, 0.2 and 0.3, although the nominal stoichiometry values of Cu and In are the same, the experimental values of Cu are always higher than In; this behavior is inverted for sample x = 0.4. Sample x = 0.5 have a similar behavior of samples x = 0.1, 0.2 and 0.3 with respect to the relation between Cu and In, but the Ta values are too lower with respect to nominal, with exception of exp. 1 where the value of Ta is higher than nominal but of Cu and In are lower.
With respect to the distribution of Cu, In Ta and Se atoms in the samples, it can be observed in Figure 1 that it is quite homogenous (Cu: red, Se: yellow, Indium: blue, Tantalum: green); this indicative that our observations are more due to local fluctuations of stoichiometry that large regions of different phases. Effectively, in SEM technique the usual resolution is in the order of one digit in nanometer units (although in some sophisticated equipment it can be obtained resolutions of 0.4 nm [40]), that is ~10-4 times the size of the white trait scale in Figure 1.
However, under a more exhaustive examination, for sample x = 1/3, we are observed little structures with hexagonal symmetry (secondary phase) which we are identified as TaIn0.67Se2 (Figure 2). TaIn0.67Se2 is a previously reported compound [41], crystallizes in a hexagonal structure, space group (N 187) with cell parameters a = b = 3.45 Å, c = 8.22 Å, α = β = 90°, γ = 120°. The nominal stoichiometry for TaIn0.67Se2 is Ta: 27.25%, In: 18.26% and Se: 54.50% which is very close to those observed in points 1, 3, 4 and 5 (left microphotography, upper table) and 1, 2, 3 and 4 (right microphotography, bottom table). The hexagonal symmetry is clearly observed in microphotographs: point 1 of left microphotography and point 3 of right microphotography.
The lattice parameters of (CuInSe2)1-x (TaSe)x solid solutions were previously reported [37] (Figure 3), it can be observed that parameters a and c remains nearly constant in the entire composition range studied. However, it is worth a short discussion about the covalent radii of Cu, Ta and In (Table 3) and the occupancy of the Ta atoms in the CuInSe2 matrix. Although there is a considerable dispersion in reference to the covalent radius values from different authors, it is well established that it increases from left to right and from upper to bottom in the periodic table: Cu has the lower value whereas Ta and In are similar. The fact that the lattice parameters do not change with composition in (CuInSe2)1-x (TaSe)x solid solutions up to x = 0.5 suggests that Ta preferably substitutes In in the CuInSe2 matrix. That is, may be the reason that the observed general trend of deviation in stoichiometry with respect to the nominal values is higher in In that in Cu.
In Figure 4, we are displayed the diffraction patterns of compositions x = 0.1, 0.2 and 0.5, which have not showed in a previous report [37]. In this figure:
a) The experimental diffraction patterns is displayed in black,
b) A calculated diffraction pattern of CuInSe2, using Power Cell software [47] in red,
c) Green ticks denote the stronger peaks of TaIn0.67Se2 phase which was also observed in SEM measurements,
d) Asterisks denotes not identified peaks.
The coincidence of the CuInSe2 peaks with those of the alloys (x = 0.1, 0.2 and 0.5) confirms that the lattice parameters remain constant in the entire composition range studied. The mean difference between diffraction patterns results in peak intensities. The intensities of the diffraction peaks are related with the occupation of the crystallographic sites by cations; however, Ta will replace no way of knowing, a priori, which cation, Cu or In. Moreover, refinements using Rietveld method suggest that at least one crystallographic site is occupied at random for the three cations, as it is the case of CuTaInSe3, the sample x = 0.5 [24]. With respect to this sample (x = 0.5) it can be observed in Figure 3 that the relation between the intensities of the two stronger peaks (I112/I220) is 2.62, whereas for samples x = 0, x = 0.1 and x = 0.2 the values are 1.53, 1.22 and 1.10, respectively. In previous works on chalcopyrite/metal transition alloys we are extensively discussed that the ordered chalcopyrite structure, space group (N 122) evolves with composition to a semi-ordered chalcopyrite-like structure, space group (N 112), until a new cationic rearrangement occurs towards stannite-type structure, space group (N 121), at x = 2/3 [48,49].
In order to build a preliminary T-x phase diagram in the basis of the information obtained by SEM, XRD and DTA measurements, in Figure 5, DTA thermograms are show. In heating and cooling cycles, a chalcopyrite-like behavior can be clearly observed. Two transitions, one due to cationic sublattice disorder and another due to melting (or solidification), in the composition interval 0 ≤ x ≤ 1, although sample x = 0.05 show a little peak at 932 K in the heating (907 in the cooling), suggesting that this is the existence field of the ordered chalcopyrite-like (α) phase. For x > 0.1, the thermogram show the evolution to another phase with several thermal transitions. In Figure 6, we show the proposed T-x phase diagram.
The chalcopyrite-like (α) phase field is limited to composition range 0 ≤ x ≤ 0.1 at T = 800 K; with increasing temperature the phase field decreases until the temperature of T = 1077 K. The semi-ordered (α') phase exist for compositions x > 0.1, at T = 800 K until T = 932 K whereas between T = 932 K and T = 1077 K, the α' phase coexist with the β phase. At x = 0, the β phase exist between T = 1077 K and the melting point at 1255 K. The melting point decreases between x = 0 to approximately x = 0.15, then increases until x = 0.3 and decrease again until x = 0.5. There is a wide liquid + solid region between x = 0.15 and x = 0.5 but region phases cannot be identified.
We also observe overcooling in the samples: the thermal transitions in the cooling cycle are observed at lower temperature than in the heating cycle.
DC magnetic susceptibility measurements were performed in samples x = 0.05 and 1/2 using SQUID technique and the ZFC-FC protocol (Figure 7):
Sample x = 0.05 shows a paramagnetic-like behavior with hysteresis between ZFC and FC curves typical of systems with magnetic clusters. The position of two little peaks in the FC curve are signaled by red arrows and amplified in the insets. The origin of these two little peaks cannot be explained unambiguously at this stage of this study; however, a possibility is than it can be related to the blocking-unblocking process of magnetic clusters. Effectively, the peak at lower temperature coincides with a relative maximum of the magnetic susceptibility in the ZFC curve which is typical of systems with a size distribution of the magnetic clusters; this relative maximum in the ZFC curve sometimes also produce a peak in the FC curve as it observed in our measurement. With respect to the little peak at higher temperature, it is observed only in the FC curve and it is very weak, in consequence, their origin remains speculative. Two fits (dashed and continuous red lines) were performed on the FC curve; the first one (dashed line) with a simple Langevin function χ(T) = χ0L(x), where x = μH/kBT, being μ the mean magnetic moment of the magnetic clusters, H the applied magnetic field (100 Oe in our experiment), kB the Boltzmann constant and T the absolute temperature. It can be observed that this fit is not good for T > 100 K. For the second fit (continuous red line), a constant term (χp) has been added to the Langevin function, suggesting the presence of a little magnetic component which can be due to the presence of the TaIn0.67Se2 secondary phase. This time the fit is better (Table 4). The obtained values for the mean magnetic moment show that clusters are composed for ~103 Ta atoms.
With respect to the sample with x = 0.5, the magnetic behavior seems to be that of a weak ferromagnetic (4.4 × 10⁻⁶ emu/gOe) with a Tc > 300 K accompanied with a paramagnetic component appreciable only at low temperature. The fit gives a mean magnetic moment of 2.7 × 10³ Ta-atoms by cluster.
Conclusion
(CuInSe2)1-x (TaSe)x solid solutions in the composition range 0 < x ≤ 0.5 have been investigated. XRD shows a tetragonal chalcopyrite-like phase with lattice parameters very close to CuInSe2 and the presence of a secondary phase identified as TaIn0.67Se2 that does not belongs to the CuInSe2-TaSe tie line. The analysis of SEM-EDX shows stoichiometric deviations in Cu and Se elements in the order of the experimental error (~10%) for this technique whereas for In and Ta deviations are, on average, of 23.5 and 34%; also, always in average, the contents of Ta in the samples never excess 10% suggesting than this is the solubility limit. This result coincides with DTA and the obtained preliminary T-x phase diagram. As the amount of Ta increases in the samples, the magnetic behavior evolves from paramagnetic to a weak ferromagnetic.
Acknowledgments
P. G.-G. Wants to thanks to Dr. Dwight R. Acosta Najarro, Departamento Materia Condensada, Instituto de Física de la Universidad Autónoma de México (UNAM) for SEM-EDX measurements.