
International Journal of Experimental Spectroscopic Techniques
(ISSN: 2631-505X)
Volume 5, Issue 1
Research Article
DOI: 10.35840/2631-505X/8526

Article Formats
Emission Spectroscopy of Carbon Laser Ablation in Methane Atmosphere
Table of Content
Figures
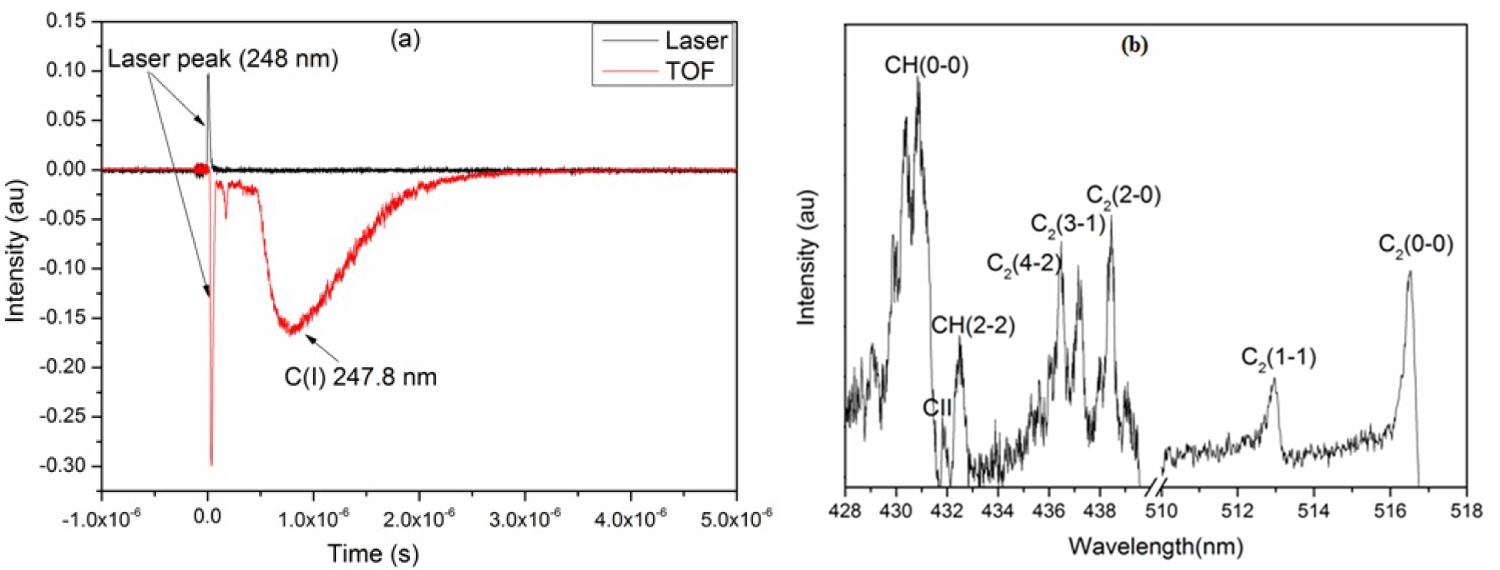
Figure 1: a) The signal in red is the time of flight....
a) The signal in red is the time of flight of C(I) 247.8 nm recorded in vacuum at 10-6 mbar of pressure and that in black the laser response; b) Emission spectrum of carbon plasma in methane atmosphere at a pressure of 0.3 mbar.
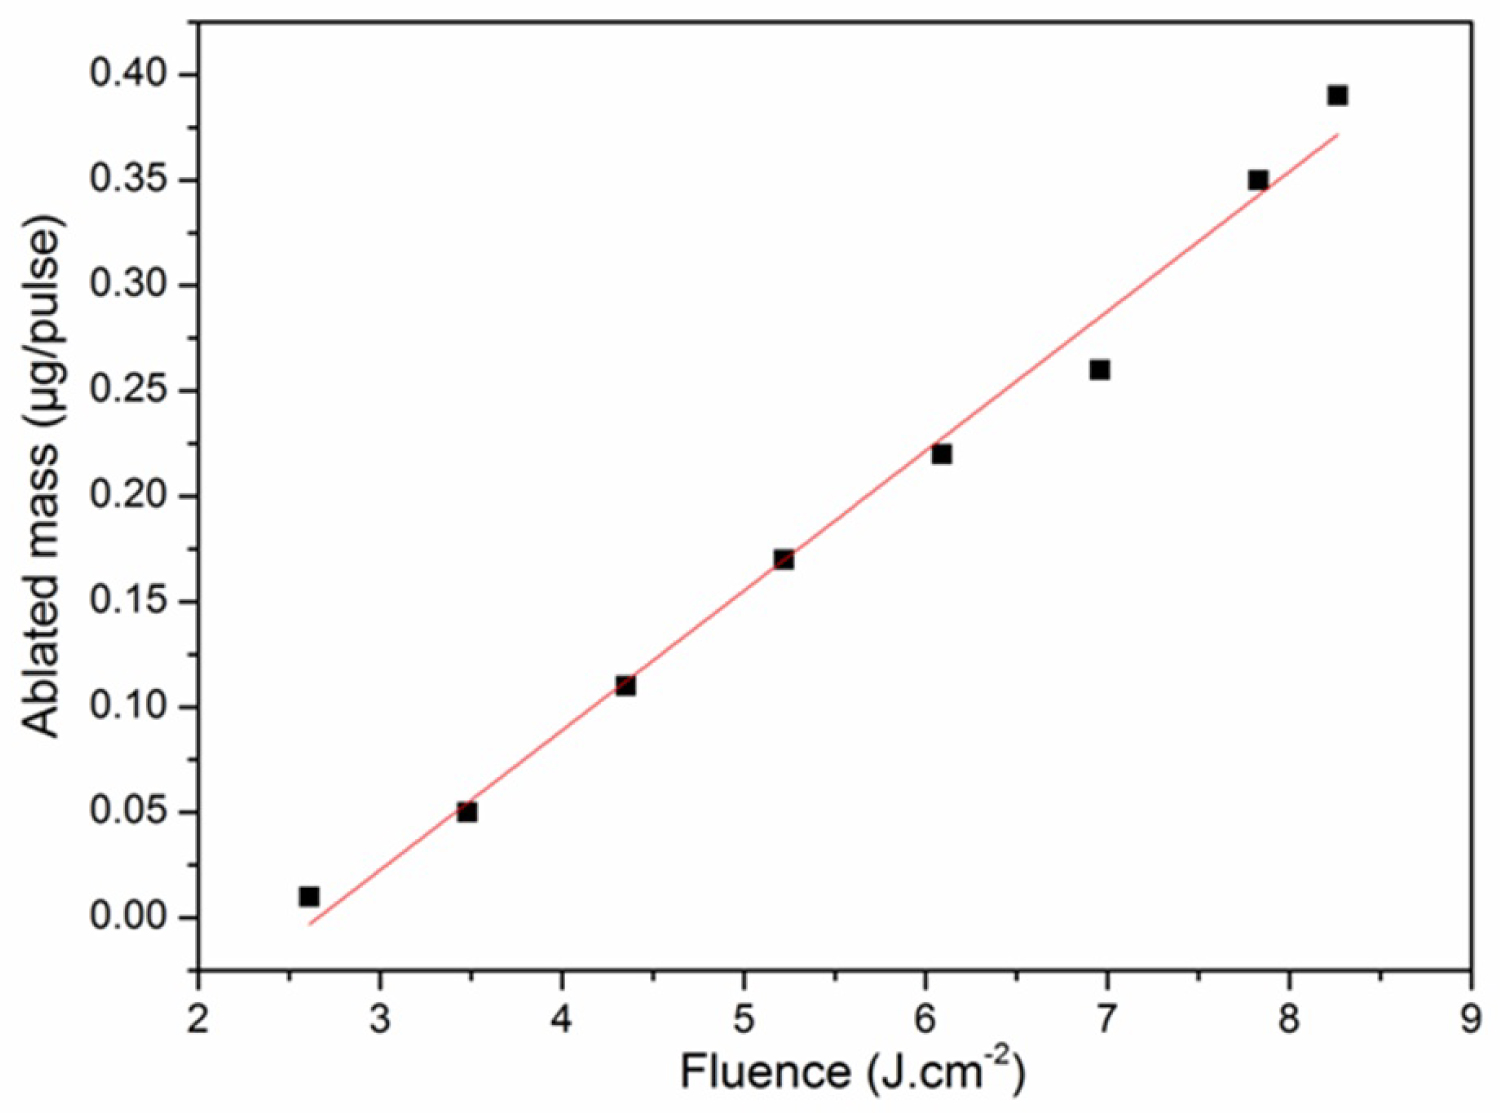
Figure 2: Rate of the ablated mass of carbon.....
Rate of the ablated mass of carbon as a function of the laser fluence.
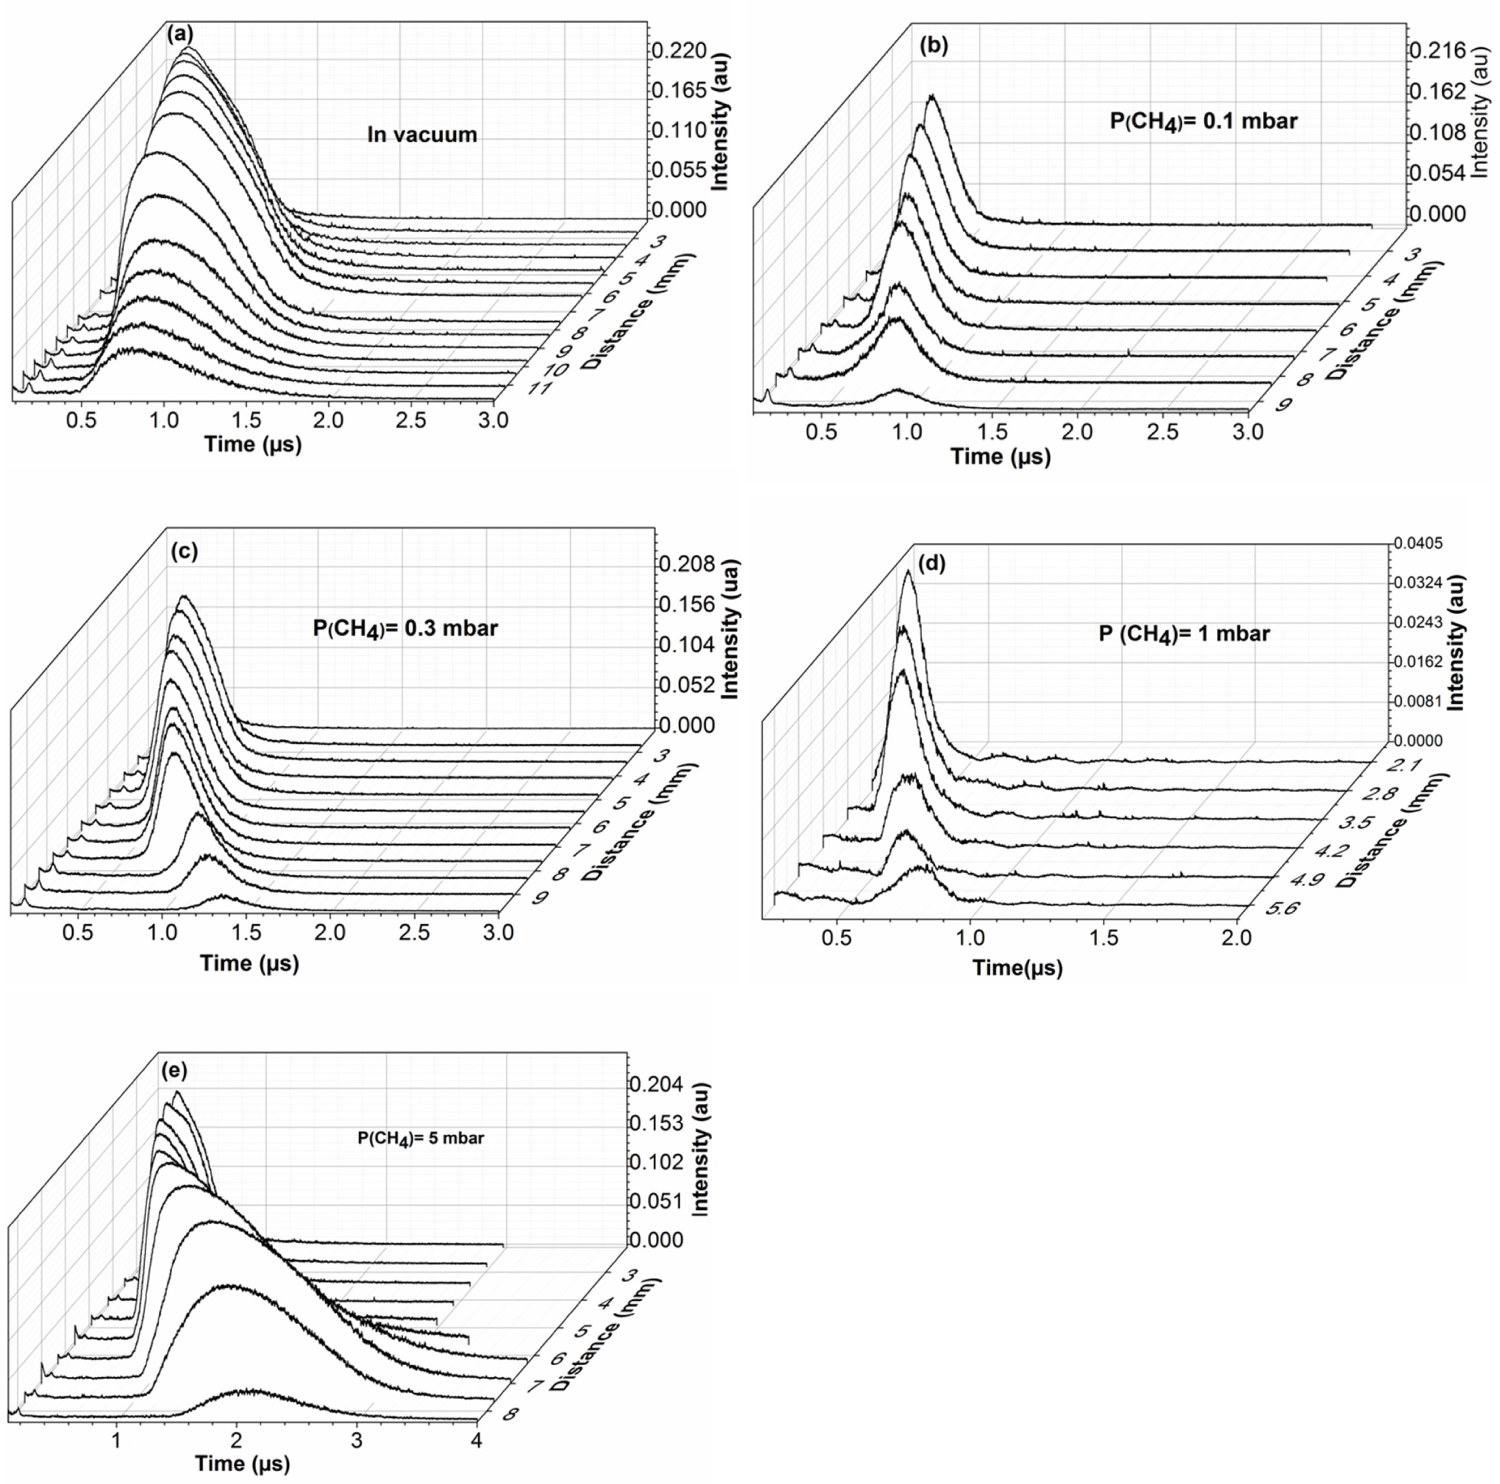
Figure 3: Time of flight signals of C(I) 247.8 nm under....
Time of flight signals of C(I) 247.8 nm under a) Vacuum and at b) 0.1; c) 0.3; d) 1 and e) 5 mbar of methane atmosphere for different distances from the target.
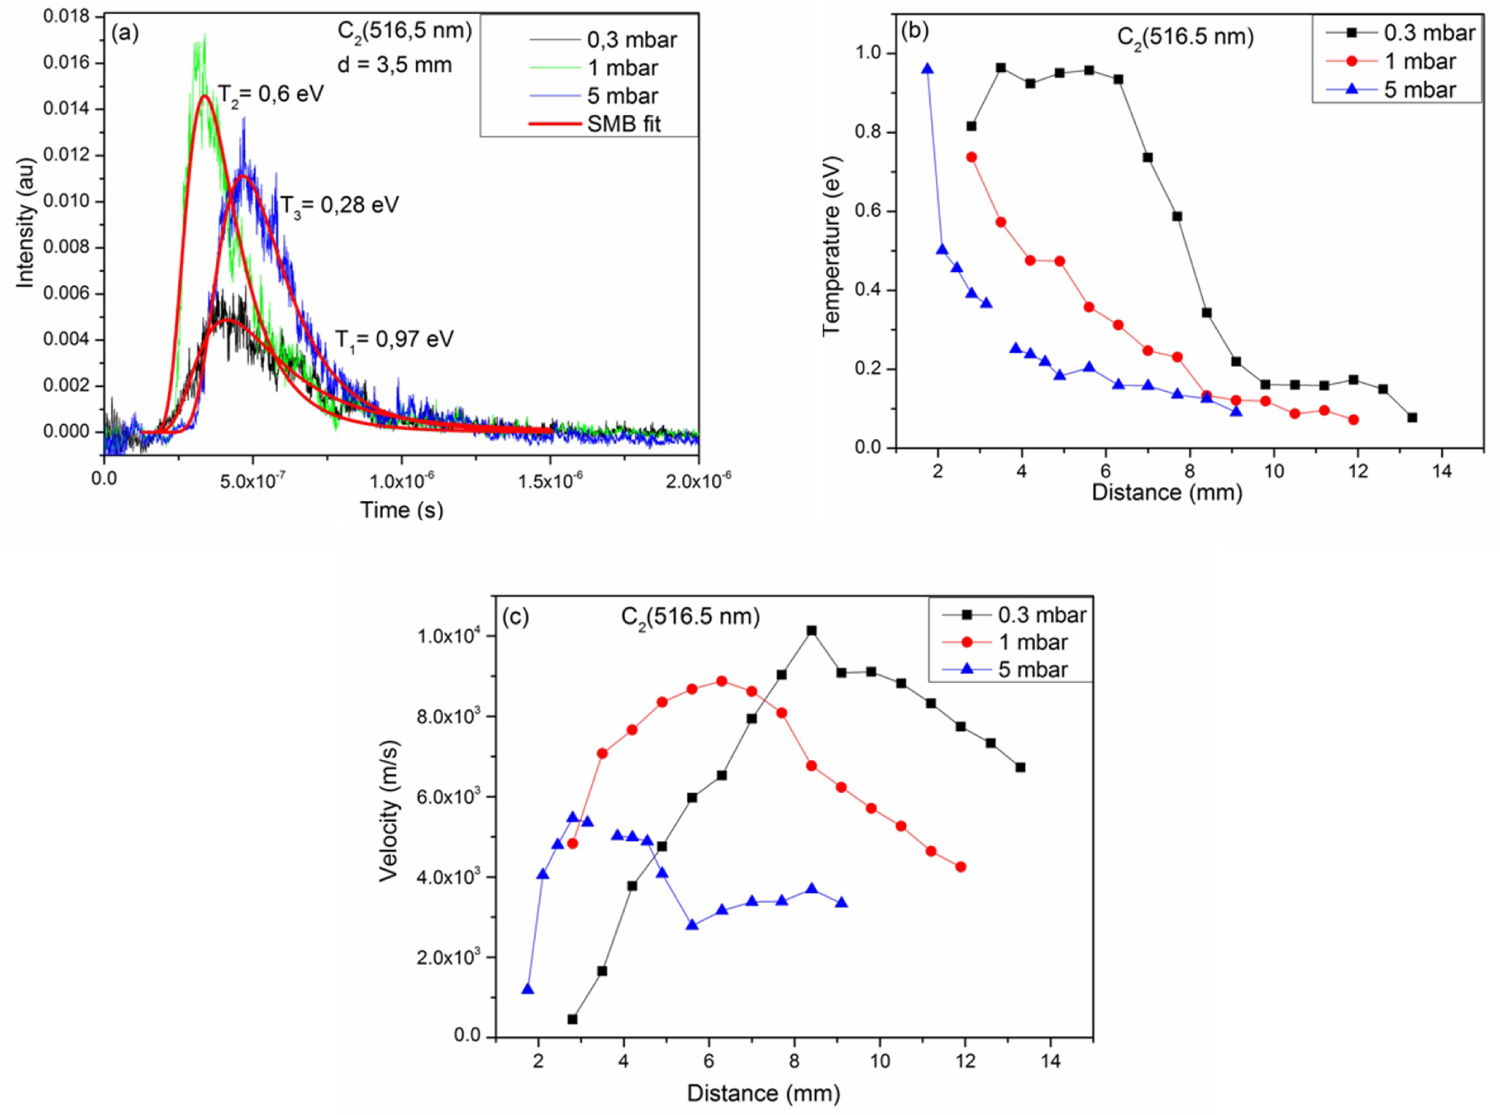
Figure 4: a) Time of flight signal of C2 fitted by....
a) Time of flight signal of C2 fitted by SMB function b) and c) Shows respectively the evolutions of the temperature and the stream velocity as a function of the distance from the target surface at 0.3, 1 and 5 mbar of methane atmosphere.
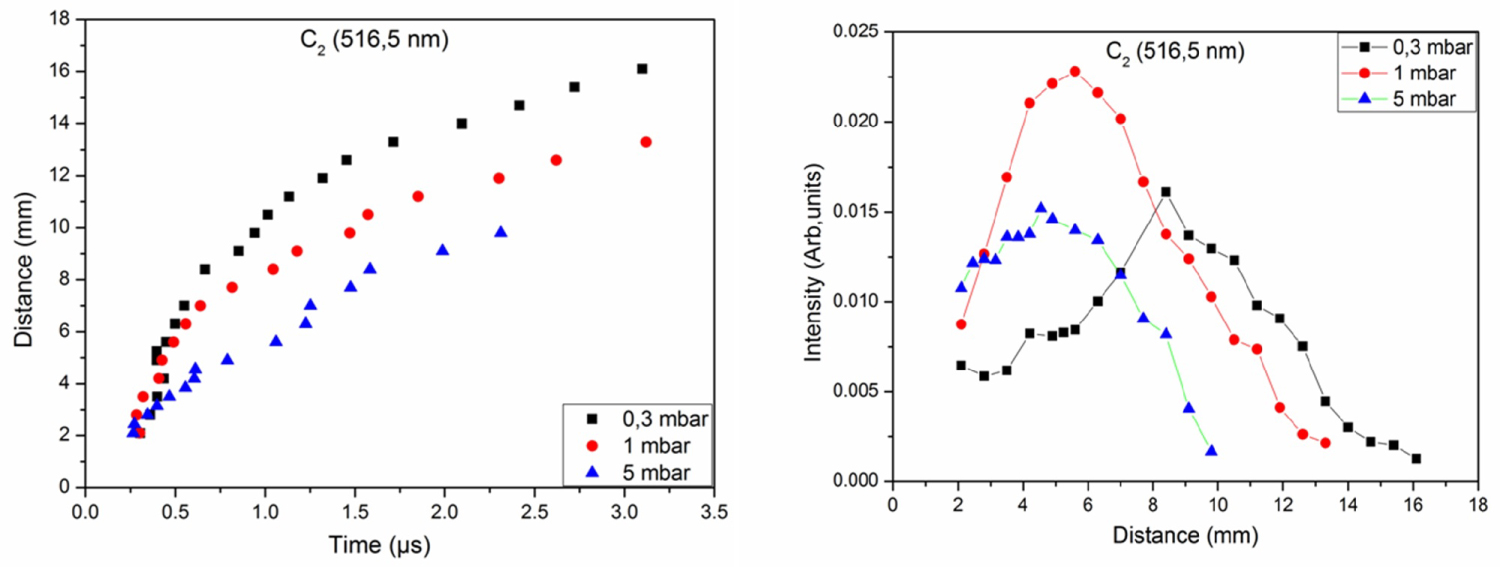
Figure 5: Distance-time and intensity-distance plots of the....
Distance-time and intensity-distance plots of the molecule C2 under 0.3, 1 and 5 mbar of CH4.
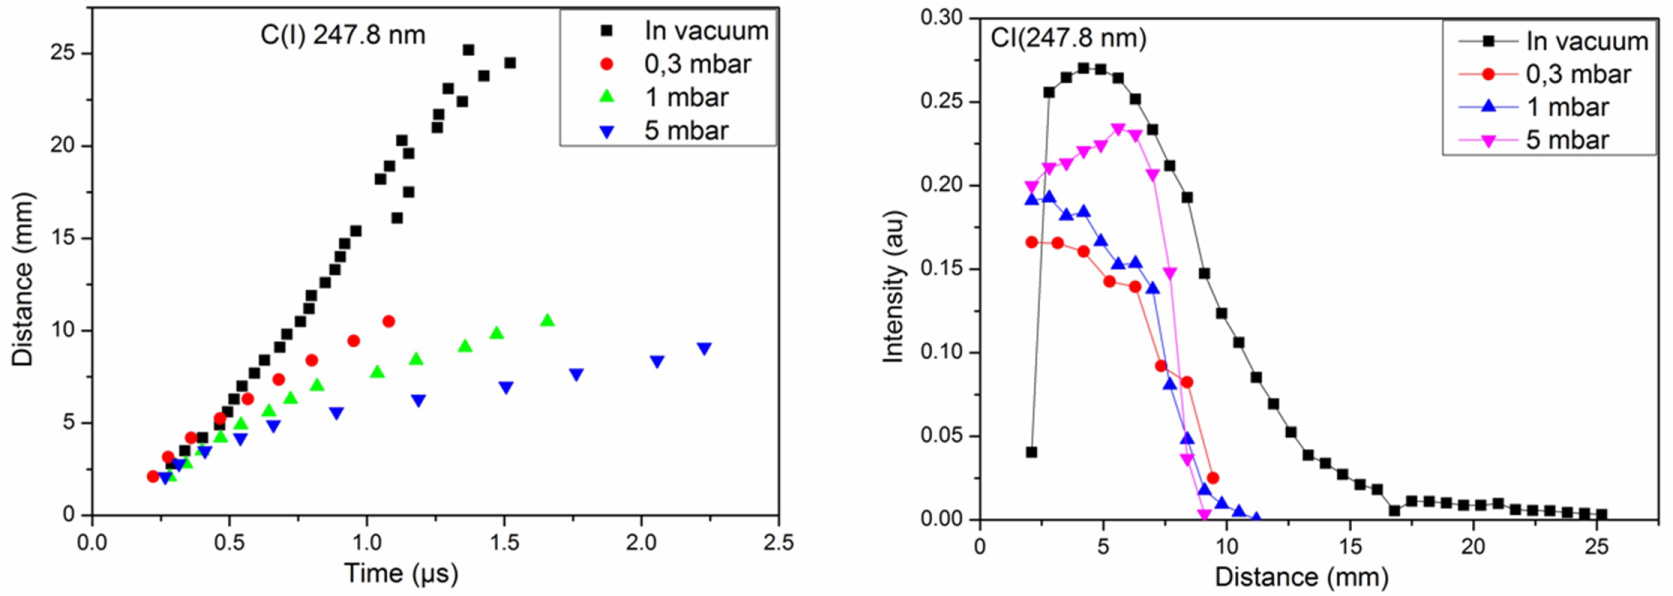
Figure 6: Distance-time and distance-intensity plots of....
Distance-time and distance-intensity plots of C (I) 247.8 nm under vacuum and at 0.3, 1 and 5 mbar of CH4.

Figure 7: Distance-time and intensity-distance plots...
Distance-time and intensity-distance plots of C, C+, C2, and CH at 0.3 mbar of CH4.
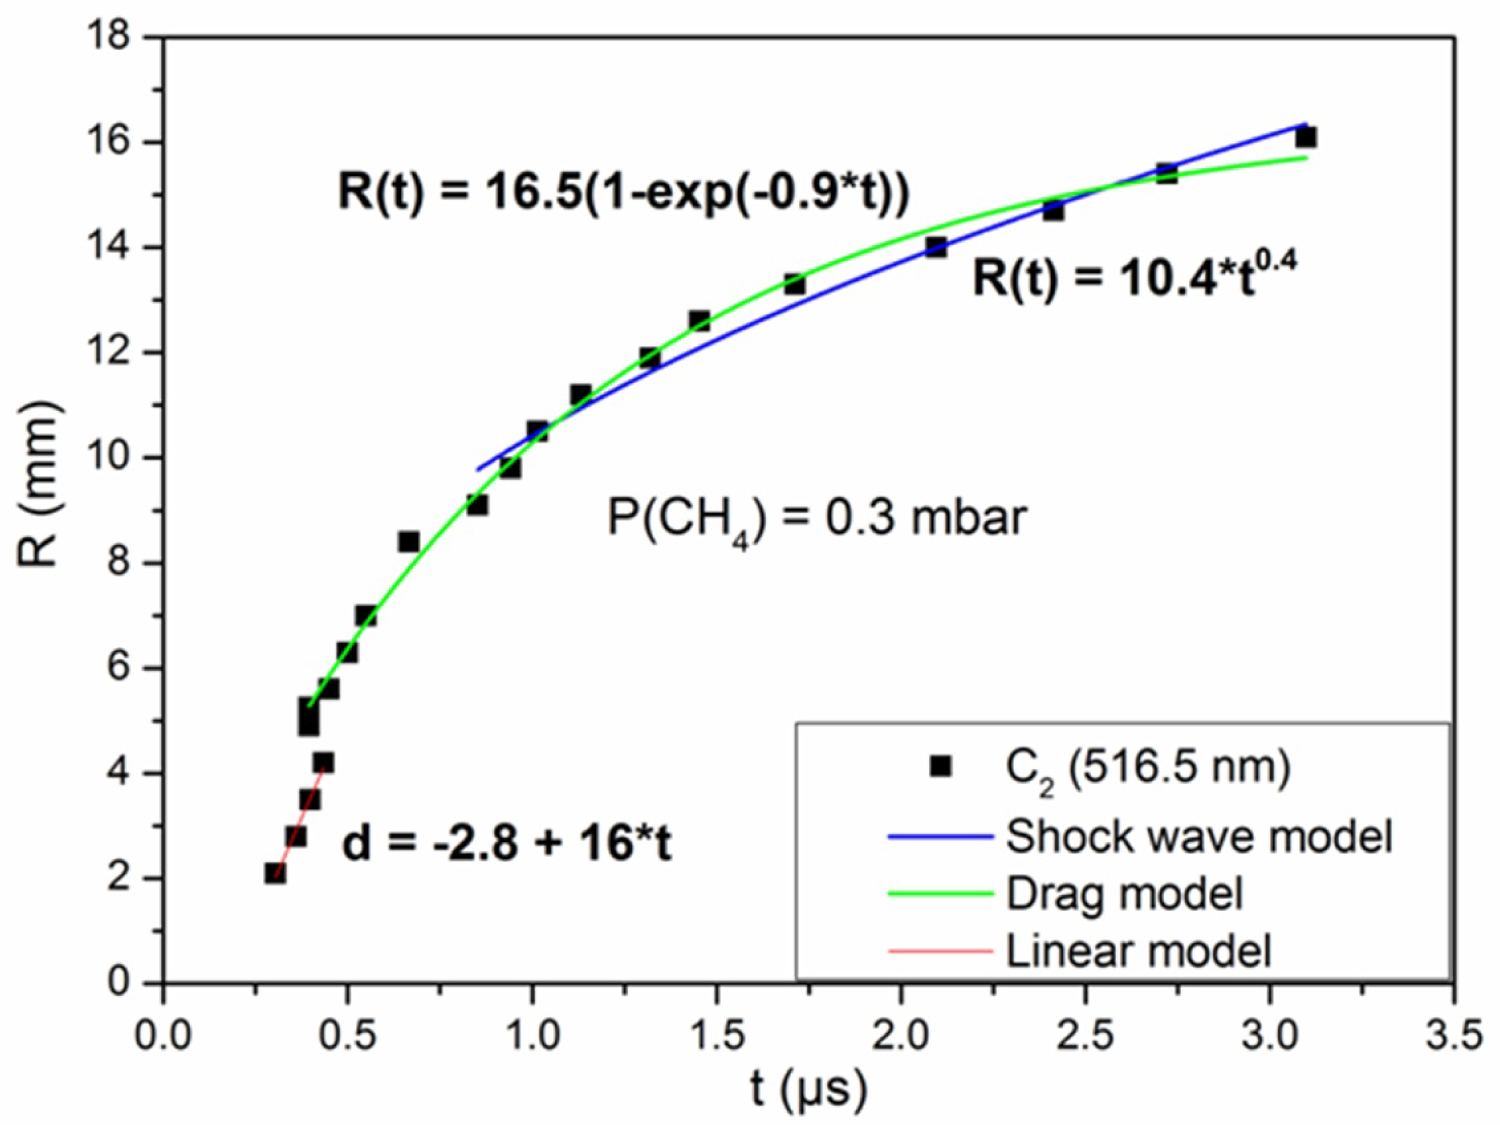
Figure 8: Distance-time plot of C2 with the shock wave, drag...
Distance-time plot of C2 with the shock wave, drag and linear models fits at 0.3 mbar of CH4.
References
- SS Harilal, BE Brumfield, BD Cannon, MC Phillips (2016) Shock wave mediated plume chemistry for molecular formation in laser ablation plasmas. Anal Chem 88: 2296-2302.
- CG Parigger, AC Woods, DM Surmick, G Gautam, MJ Witte, et al. (2015) Computation of diatomic molecular spectra for selected transitions of aluminum monoxide, cyanide, diatomic carbon, and titanium monoxide. Spectrochim Acta Part B At Spectrosc 107: 132-138.
- DA Cremers, LJ Radziemski (2013) Handbook of laser-induced breakdown spectroscopy. (2nd edn), A John Wiley & Sons, Ltd, Chichester.
- SS Harilal, GV Miloshevsky, PK Diwakar, NL LaHaye, A Hassanein (2012) Experimental and computational study of complex shockwave dynamics in laser ablation plumes in argon atmosphere. Phys Plasmas 19: 083504.
- J Budai, S Tóth, Z Tóth, M Koós (2007) Diamond-like carbon films prepared by reactive pulsed laser deposition in hydrogen and methane ambient. Appl Surf Sci 253: 8220-8225.
- S Abdelli-Messaci, T Kerdja, A Bendib, SM Aberkane, S Lafane, et al. (2005) Investigation of carbon plasma species emission at relatively high KrF laser fluences in nitrogen ambient. Appl Surf Sci 252: 2012-2020.
- S Abdelli-Messaci, T Kerdja, A Bendib, S Malek (2002) Emission study of C2 and CN in laser-created carbon plasma under nitrogen environment. J Phys Appl Phys 35: 2772-2778.
- J Hermann, C Vivien, AP Carricato, C Boulmer-Leborgne (1998) A spectroscopic study of laser ablation plasmas from Ti, Al and C targets. Appl Surf Sci 127-129: 645-649.
- A De Giacomo (2003) Experimental characterization of metallic titanium-laser induced plasma by time and space resolved optical emission spectroscopy. Spectrochim Acta Part B At Spectrosc 58: 71-83.
- JB Ahmed, N Jaïdane (2009) Temporal behavior of neutral and ionic lines emitted from a laser induced plasma on an aqueous surface. Spectrochim Acta Part B At Spectrosc 64: 442-447.
- H Yousfi, S Abdelli-Messaci, O Ouamerali, A Dekhira (2018) A comparative study of carbon plasma emission in methane and argon atmospheres. Spectrochim Acta Part B At Spectrosc 142: 97-107.
- D Bäuerle (2000) Laser Processing and Chemistry. Springer, Heidelberg, Germany.
- RK Singh, A Kumar, BG Patel, KP Subramanian (2007) Role of ambient gas and laser fluence in governing the dynamics of the plasma plumes produced by laser blow off of LiF-C thin film. J Appl Phys 101: 103301.
- YB Zel'dowich, YP Raizer (1996) Physics of shock waves and high temperature hydrodynamic phenomena. Academic Press, New York.
- D Bäuerle (2013) Laser processing and chemistry. Springer Science & Business Media.
Author Details
Houssyen Yousfi1,2*
1Laboratoire de chimie théorique computationnelle et photonique, Faculté de Chimie, Université des Sciences et de la Technologie Houari Boumediene, Algeria
2Centre de Développement des Technologies Avancées, Algeria
Corresponding author
Houssyen Yousfi, Laboratoire de chimie théorique computationnelle et photonique, faculté de chimie, Université des Sciences et de la Technologie Houari Boumediene USTHB, BP 32 El-alia, Bab ezzouar, Alger 16111, Algeria; Centre de Développement des Technologies Avancées, cité 20 août 1956, BP 17, Baba Hassen, Algiers, Algeria, Tel: +213-795589930.
Accepted: June 15, 2020 | Published Online: June 17, 2020
Citation: Yousfi H (2020) Emission Spectroscopy of Carbon Laser Ablation in Methane Atmosphere. Int J Exp Spectroscopic Tech 5:026
Copyright: © 2020 Yousfi H. This is an open-access article distributed under the terms of the Creative Commons Attribution License, which permits unrestricted use, distribution, and reproduction in any medium, provided the original author and source are credited.
Abstract
Understanding plasma chemistry in methane by measuring kinetic and thermodynamic features of the ionic, atomic, and molecular emission in laser ablation plume is crucial especially for thin film synthesis of hydrogenated carbon. We report the emission spectroscopy of carbon plasma produced by ultraviolet nanosecond laser in a methane atmosphere. Atomic and molecular emitting species including C, C+, C2, and CH were identified. The rate of the ablated mass of carbon increases gradually as a function of laser fluence. The time of flight signals of the emitting species are analyzed at different distances in a vacuum and 0.3, 1, and 5 mbar of methane gas. The methane pressure has a significant effect on translational temperatures and stream velocity of the C2 molecule. The spatiotemporal evolution of molecular C2 highlights the recombination character. The drag model agrees well with the spatiotemporal evolution of C2 in the early of the plasma expansion, whereas the shock wave is prevalent from 1 µs.
Keywords
Carbon plasma, Laser-induced plasma, Time of flight analysis
Introduction
Optical emission spectroscopy (OES) is an effective tool to analyze optical emission from laser-induced plasma. It is largely used to identify the elemental composition of solid, liquid, gas and aerosols samples in a vacuum or in a controlled atmosphere [1]. The emitting species in laser-induced plasma are characterized by their optical emission spectra. The later helps to determine plasma parameters and the kinetic properties of species in the plasma. Excitation, de-excitation, ionization, and recombination are among the main processes responsible for the signatures of the atomic and molecular species on the emission spectra [2].
The emission spectroscopy from plasma species is related to the laser ablation (LA) conditions. The LA processes are strongly connected to laser parameters (wavelength, fluence, and pulse duration) and the material properties (physicochemical properties) and the nature and pressure of the ambient gas [3]. Depending on the nature of the ambient gas, the physics and dynamics of the plasma change significantly. The expansion of plasma under a reactive atmosphere is very complex. Plasma species are held back by gas particles due to elastic and inelastic collisions [3]. In the expansion stage, the plasma can undergo the diffusion of particles, shock wave formation, hydrodynamic instabilities as well as chemical reactions [4]. To our knowledge, there are very few works have investigated the interaction of laser-induced carbon plasma and methane atmosphere by OES [5]. However, several authors have investigated the laser produced plasma from different materials like carbon, Titanium, Aluminum in vacuum as well as in controlled atmospheres [6-10]. In their works, they used time and space resolved optical emission spectroscopy to elucidate the kinetic and dynamic aspects in the laser induced plasma. We have used the OES technique to get information about physicochemical processes involved in carbon plasma in methane. In our previous work, a carbon plasma emission in methane and argon atmospheres has been investigated [11]. At a fluence of 9.6 J.cm-2, the spatiotemporal evolution of emitting species like C, C+, C2, CH, Ar was studied at a pressure of 0.3 mbar of methane and 0.3 and 1 mbar of argon. It was found that the C and C2 present a triple and double peaks respectively at 1 mbar of argon atmosphere in contrast to methane one. The multiple structures have been ascribed to the reflected shocks and the oscillation in the plasma. To continue investigating the effect of methane pressure on carbon plasma, we have studied its behavior at different methane pressures for a laser fluence of 7.8 J.cm-2. A comparison between the time-of-flight profiles of emitting species into different methane pressures is made. The evolution of the ablated mass of carbon versus laser fluence is presented. The temperature and stream velocity of C2 is determined by the shifted Maxwell distribution function (SMB). Spatiotemporal evolution of species provided from plasma, gas, and plasma-gas interaction is studied in vacuum and methane environments.
Experimental Setup
The experimental setup has been given in detail in our previous work [11]. In this experiment, carbon plasma was generated by a KrF excimer laser (Lambda Physik Compex 102, λ = 248 nm, 25 ns pulse duration). Using two cylindrical lenses, the laser beam was focused on the target surface at an angle of 45° with respect to the normal of the target surface. The laser fluence obtained on a spot size of 0.02 cm2 was 7.8 J.cm-2. The target is placed in a cylindrical stainless steel chamber under vacuum at a pressure of 10-6 mbar. We injected methane at pressures of 0.3, 1 and 5 mbar. For plasma diagnostic, we used an Acton spectrometer of Czerny-Turner optical configuration. The light emitted by the plasma is reproduced on the entry slit of the spectrometer (dimension 100 µm wide × 2 mm long) through mirrors. The resolution power of the spectrometer is of 10000 equipped with a holographic network of 1200 lines/mm and has a dispersion of 6 Å/mm, which leads to a spectral resolution of 0.06 nm. The image of the plasma plume is conveyed to the entrance slit of the spectrometer. The analysis of the plume is carried out slice by slice by moving the image of the plasma on the entrance slit of the monochromator with a step 0.3 mm to provide spatially resolved measurements. The spectrometer is coupled to a fast PM Photomultiplier (Hamamatsu R294) with a rise time of 2 ns. The PM is connected to an oscilloscope (Tektronix TDS3032, 5 GS/s, 300 MHz) to record the time of flight signals of the emitting species. The oscilloscope is triggered in external mode when the laser irradiates the target. This triggering is done using a photodiode illuminated by the reflection of the laser coming from the focusing lens. Figure 1a shows the time of flight signal of the neutral carbon C (I) at 247.8 nm obtained during the irradiation of a graphite target under vacuum. Using time-of-flight signals, time- and space- resolved characterization for each species detected is possible. We have recorded an emitting spectrum (Figure 1b) of carbon plasma in a methane atmosphere at a pressure of 0.3 mbar. The spectrum was obtained using an ICCD detector (Princeton instruments PI-MAX, 1024 × 256 pixels, pixel size = 24 × 24 μm) at a gate time of 10 μs for a delay of 100 ns. The spectrum is characterized by an emission from atomic lines C+ and molecular bands of C2 and CH for different vibrational sequences.
Measure of the Ablated Mass
Figure 2 presents the evolution of the rate of the ablated mass of carbon by laser pulse as a function of the laser fluence. We can see that the rate of ablated mass increases with laser fluence. Extrapolating the curve with the x-axis gives a threshold ablation fluence of 2.6 J.cm-2. This value is lower than the detection threshold of the C+ which is 6 to 10 J.cm-2 and higher than the detection threshold of the C and C2 species which is 1 J.cm-2 [6]. The removed mass of carbon on a spot size of 0.02 cm2 for a fluence of 7.8 J.cm-2 is 0.35 µg/pulse. In order for material to be ejected from the irradiated target, the surface energy density must be greater than a limit value called the threshold fluence. This value depends on the parameters of the laser and the physical properties of the irradiated target, it is given by the relation [12]:
Where τ is the laser pulse duration, Tvap the vaporization temperature, T0 the surface temperature, R the reflection coefficient, K the thermal conductivity, and D the thermal diffusivity.
We calculated the threshold fluence value for a carbon target, using the formula (1), we got for: Tvap = 4623 K, T0 = 300 K, Kth = 0.2 W.cm-1.K-1, R = 0.21, D = 12.58 cm2.s-1 and τ = 25 × 10-9 s [12], a threshold fluence of 0.0432 J.cm-2. The later value is very lower than that measured.
Time of Flight Analysis
Figure 3 shows the time of flight signals of C(I) at 247.8 nm recorded under vacuum and at 0.1, 0.3, 1, and 5 mbar of methane for different distances from the target surface. The emission intensity of the C decreases with the distance of the target. At 5 mbar, the time of flight signals are broad starting at 6 mm from the target surface. This broadening is due to the increase in the population of the excited species of C in the plasma plume. The effect of the ambient gas pressure on plasma expansion is manifested by the confinement of the plasma. Collisions multiply by increasing the pressure of the ambient gas, which promotes chemical reactions between the expanding species and the gas particles.
Study of the Distribution of C2 Molecules
The stream velocities and the translational temperatures of the C2 molecule are determined by the shifted Maxwell Boltzmann distribution function (SMB), which is given by the relation [13]:
Where f(t) is the intensity of emitting species, A is the normalization constant, kB the Boltzmann constant, m is the mass of the species, z is the distance from the target, V is the stream velocity, and T is the translational temperature.
Figure 4a shows the time of flight signal of C2 fitted by the SMB function at 0.3, 1, and 5 mbar of methane for a fluence of 7.8 J.cm-2. The signals are well fitted by the SMB function as shown in the figure. At 3.5 mm from the surface of the target, the temperatures obtained are of the order of 0.28, 0.6, and 0.97 eV for methane pressures of 5, 1, and 0.3 mbar respectively.
Figure 4b shows the evolution of the translation temperature of the molecule C2 as a function of the distance of the target surface for 0.3, 1, and 5 mbar of methane. The spatial evolution of the translation temperature of the C2 molecule decreases progressively away from the surface of the target for the different pressures. At 0.3 mbar of CH4 between 3.5-6.3 mm, the translation temperature of the molecule C2 remains constant then decreases. The figure indicates that the translation temperature values of the molecule C2 obtained at 0.3 mbar are greater than those observed at 1 mbar followed by the values at 5 mbar of methane.
Figure 4c shows the velocity of the populations of the C2 molecule as a function of the distance of the target surface for 0.3, 1 and 5 mbar. This velocity increases to a maximum then decreases for the three applied pressures. This maximum is 8.4, 6.3, and 2.8 mm from the target surface for 0.3, 1, and 5 mbar respectively. This shift can be explained by the braking of the particles by the pressure force. The effect of the ambient gas pressure slows down the expansion of the plasma, which decreases the translational speed of the particles in the plasma. Moreover strong collisions could be formed between plasma species. These collisions lead to the decrease of the temperature and the velocity of the different populations excited in the plasma.
Spatiotemporal Study of Species
Spatiotemporal evolution allows explaining the behavior of the emitting species in the plasma and to predict its origin. Figure 5 shows the distance-time and intensity-distance curves of the molecule C2 observed in carbon plasma under 0.3, 1, and 5 mbar of CH4 for a fluence of 7.8 J.cm-2. For t < 0.5 μs, the velocity of the molecule C2 is the same for the three applied pressures. Beyond this time, the molecule C2 is faster in the pressure of 0.3 mbar of CH4 followed by 1 and then 5 mbar. We also observe that its spatiotemporal evolution is relatively confined for 5 mbar. The intensity-distance curves indicate that the maximum emission intensity of molecule C2 is close to the surface of the target (5 mm) for 1 mbar and 5 mbar. For 0.3 mbar, the maximum emission intensity of the molecule C2 is 8 mm from the target surface. Plasma expands to great distances at low pressure because the plasma pressure is greater than that of the ambient gas.
Figure 6 shows the distance-time and intensity-distance plots of C(I) at 247.8 nm under vacuum, and at 0.3, 1, and 5 mbar of the CH4 for a fluence of 7.8 J.cm-2. In vacuum, the C behaves linearly in the plasma indicating a free expansion of plasma. The velocity of neutral C is less important at 5 mbar than that of 0.3 and 1 mbar. The intensity of C increase to reach a maximum then decreases continually. The maxima are situated at 4.2, 5.6, 2.8, 2.1 mm for vacuum, 0.3, 1, and 5 mbar, respectively.
Figure 7 shows the distance-time and intensity-distance plots of the species C, C+, C2, and CH observed in carbon plasma under 0.3 mbar of methane gas. We note that C and CH have similar emission rates and intensities. The molecular C2 behaves like C up to 4 mm from the surface of the target and like C+ beyond this distance. The maximum emission intensity of C+ and C2 is 7 and 9 mm from the target surface respectively. The behavior of C2 molecules returns to the different origins of C2 formation. It can be formed directly from the surface of the target by dissociation of clusters and/or by recombination processes of atomic species in the plasma.
Drag and Shock Wave Models
To highlight the dynamics of the plasma expansion in the methane gas, we investigate the deal of spatiotemporal evolution of species with the linear, theoretical shock wave model and empirical drag model.
Shock wave model is giving by [14]:
Where R is the propagation distance, is the constant related to both geometric and thermodynamic quantities, is the background gas density and is the plume energy, n is a constant depending on the symmetry of the shock wave.
Drag model equation [15]:
Where is the stopping distance of the plume and β is the slowing coefficient.
Figure 8 shows the distance-time plots of C2 fitting with linear, shock wave and drag models, at 0.3 mbar of methane atmosphere. For 2.1-4.2 mm from the target, the curve agrees well with the linear model. In this first stage of expansion, the effect of the methane is negligible and the plasma easily expands under its strong internal pressure. The drag model exhibits a good agreement with the R-t plot between 5.2-16.1 mm. The evolution of the R-t plot of C2 depends on t0.4 in the region 10.5-16.1 mm from the target surface, which corresponds to the spherical shock wave. When the mass of the ambient gas is greater than that of the plasma, a shock wave is formed. This is explained by the difference in pressure and density between the two media. Collisions, which occur in the mixing zone, slow down the expansion of the plasma.
Conclusion
The emission spectroscopy of carbon laser ablation in a methane atmosphere is investigated by optical emission spectroscopy. The rate of the ablated mass carbon increases gradually as a function of laser fluence. The time of flight signals clearly showed that the pressure of methane has a great influence on the evolution of the emitting species. The spatiotemporal evolution of molecular C2 highlights the recombination character in the plasma. The CH radicals are coming from the dissociation of methane gas by electronic impact processes. Collisions multiply by increasing the pressure of the ambient gas, which promotes chemical reactions between the expanding species and the gas particles. The good agreement of the R-t plot of C2 proves that a spherical shock wave could be formed in the mixing zone between plasma and methane gas.