International Journal of Experimental Spectroscopic Techniques
(ISSN: 2631-505X)
Volume 5, Issue 1
Research Article
DOI: 10.35840/2631-505X/8527

Article Formats
Potential of the Direct Current Arc Optical Emission Spectroscopy for the Determination of Elements in Naturally Mature Gram Seed
Table of Content
Figures
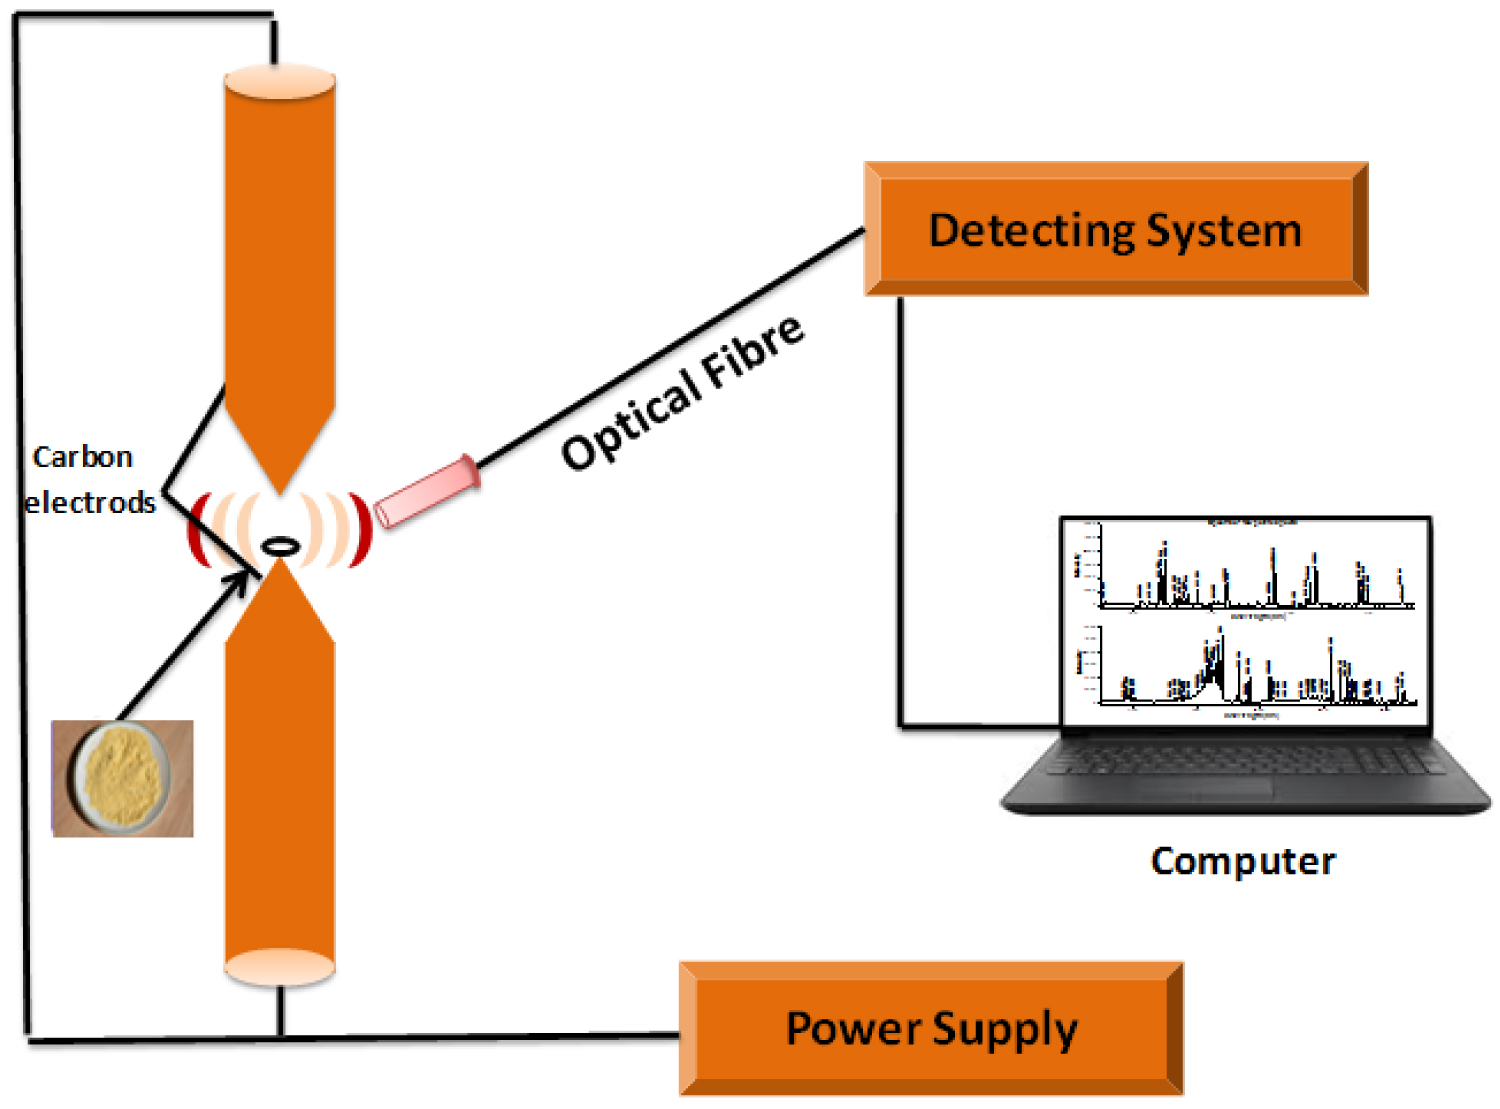
Figure 1: Schematic arrangement of the direct current....
Schematic arrangement of the direct current arc optical emission spectroscopy.
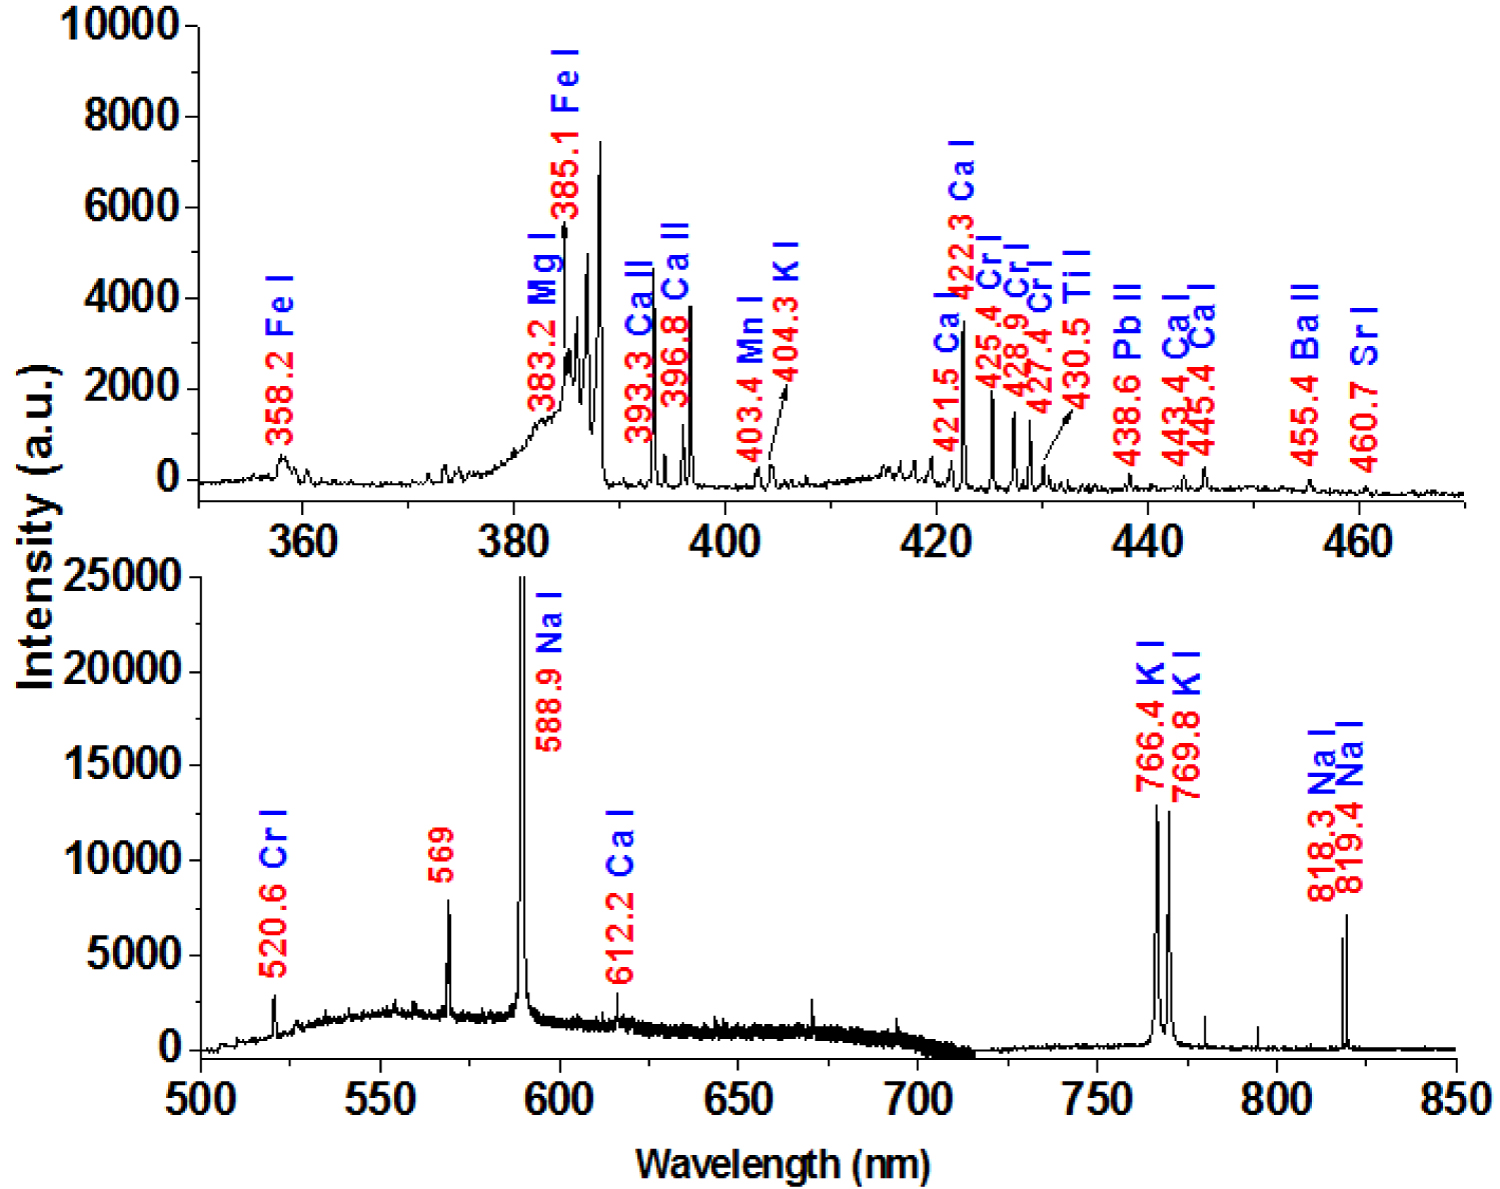
Figure 2a: Representative recorded optical emission.....
Representative recorded optical emission spectrum of the gram seed powder excited by direct current arc.

Figure 2b: Recorded emission spectrum of the blank carbon.....
Recorded emission spectrum of the blank carbon electrodes (without sample) excited by direct current source.
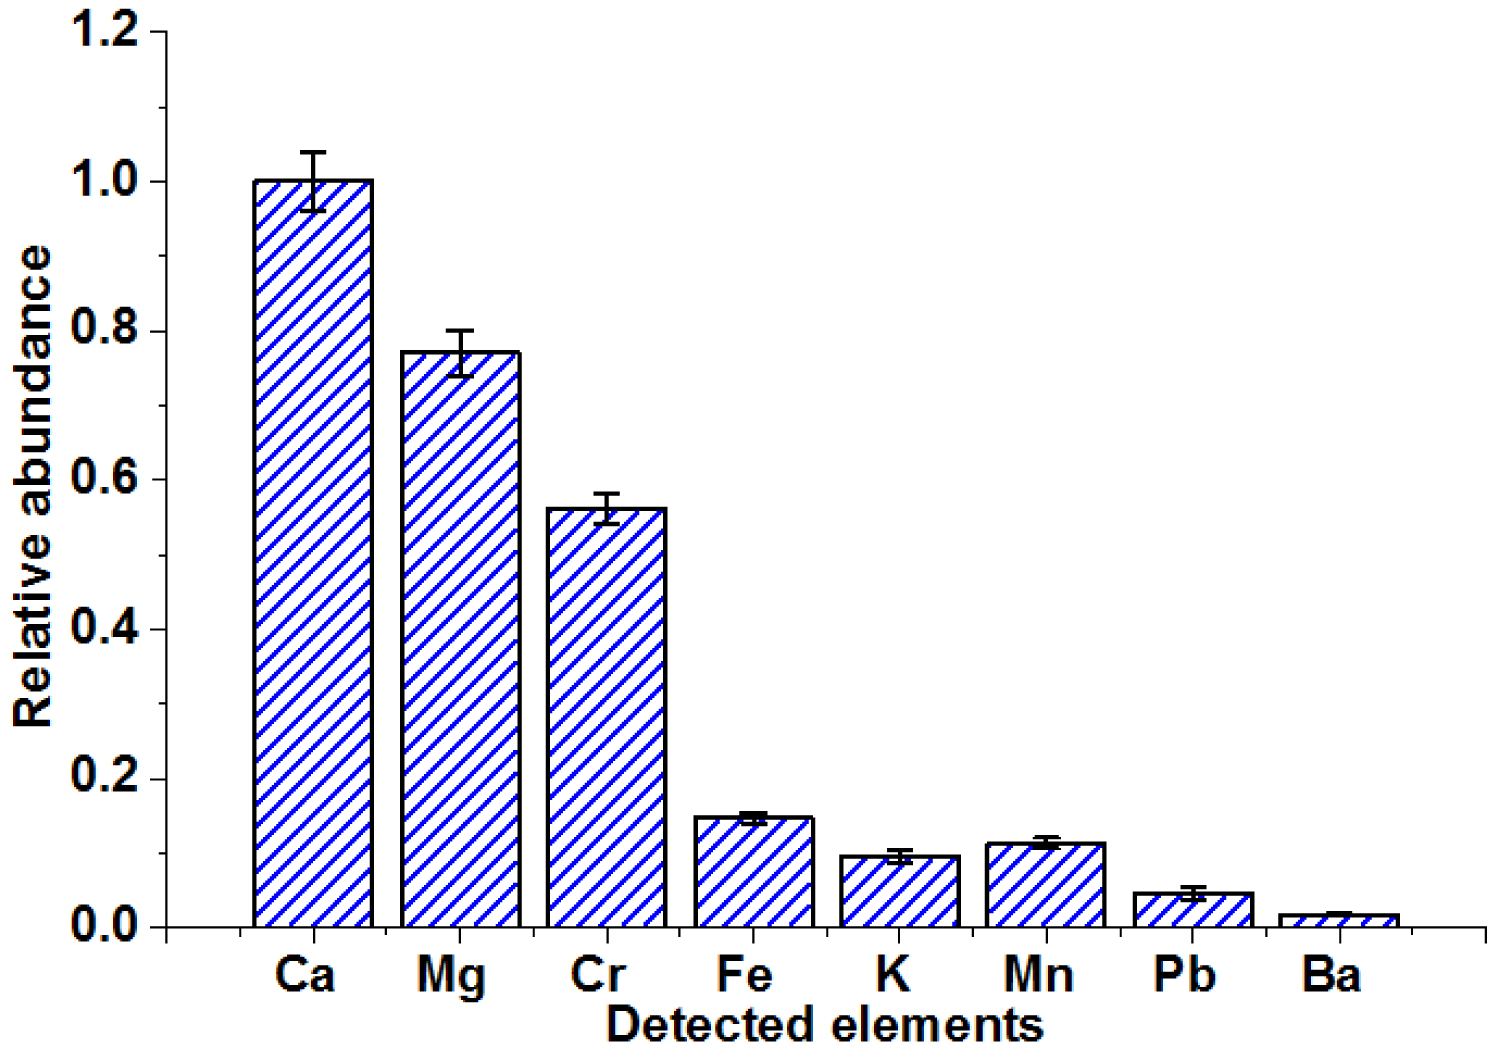
Figure 3: Relative fraction of the abundance of the....
Relative fraction of the abundance of the detected elements in the gram seed.
References
- Miguel de la Guardia, Salvador Garrigues (2015) Handbook of mineral elements in food. John Wiley & Sons Ltd, New Jersey, USA.
- Tarek A El-Adawy (2002) Nutritional composition and antinutritional factors of chickpeas (Cicer arietinum L.) undergoing different cooking methods and germination. Plant Foods Hum Nutr 57: 83-97.
- Shuchi Srivastava, Pavitra Tandon, Renu Singh, HC Gupta, KN Uttam (2013) Elemental composition of gallstone by dc arc optical emission spectroscopy. Natl Acad Sci Lett 36: 397-402.
- Shuchi Srivastava, Pavitra Tandon, Renu Singh, S Kumar, KN Uttam (2013) Elemental composition of radish by dc-arc optical emission spectroscopy. Science and Technology Journal 1: 41-44.
- Sweta Sharma, Nidhi Shukla, Abhi Sarika Bharti, KN Uttam (2018) Simultaneous multielemental analysis of the leaf of moringa oleifera by direct current arc optical emission spectroscopy. Natl Acad Sci Lett 41: 65-68.
- Abhi Sarika Bharti, Sweta Sharma, KN Uttam (2020) Elemental assessment of the leaf and seed of Rauwolfia serpentina (Sarpagandha) by direct current arc optical emission spectroscopy. Natl Acad Sci Lett. doi.org/10.1007/s40009-019-00872-4.
-
http://www.physics.nist.gov/PhysRefData
/ASD/lines_form.html. - Abhi Sarika Bharti, Sweta Sharma, Nidhi Shukla, MK Tiwari, KN Uttam (2017) Elemental investigation of the leaf and seed of coriander plant by synchrotron radiation X-ray fluorescence spectroscopy. Natl Acad Sci Lett 40: 373-377.
- Syed Mohammad Taghi Gharibzahedi, Seid Mahdi Jafari (2017) The importance of minerals in human nutrition: Bioavailability, food fortification, processing effects and nanoencapsulation. Trends in Food Science & Technology 62: 119-132.
Author Details
Sweta Sharma1, Aishwary Awasthi1, Aradhana Tripathi1, Chhavi Baran2, Aarti Jaiswal3, Rahul Uttam3, Abhi Sarika Bharti1, Renu Singh4 and K. N. Uttam1*
1Saha's Spectroscopy Laboratory, Department of Physics, University of Allahabad, Allahabad, India
2Centre for Environmental Science, IIDS, University of Allahabad, Allahabad, India
3Centre for Material Science, IIDS, University of Allahabad, Allahabad, India
4School of Basic and Applied Sciences, GD Goenka University, Gurugram, Haryana, India
Corresponding author
Dr. K. N. Uttam, Saha's Spectroscopy Laboratory, Department of Physics, University of Allahabad, Allahabad 211002, India, Tel: 91-532-2460993.
Accepted: June 15, 2020 | Published Online: June 17, 2020
Citation: Sharma S, Awasthi A, Tripathi A, Baran C, Jaiswal A, et al. (2020) Potential of the Direct Current Arc Optical Emission Spectroscopy for the Determination of Elements in Naturally Mature Gram Seed. Int J Exp Spectroscopic Tech 5:027
Copyright: © 2020 Sharma S, et al. This is an open-access article distributed under the terms of the Creative Commons Attribution License, which permits unrestricted use, distribution, and reproduction in any medium, provided the original author and source are credited.
Abstract
The study explores the potential of direct current arc optical emission spectroscopy for the assessment of nutrients present in the gram seed. For this, emission spectrum of the powder of the gram seeds has been recorded in the spectral region 300-900 nm excited by direct current source at a resolution of 0.3 nm. The spectrum shows the presence of macro-elements: Calcium, potassium, magnesium, sodium, and micro-elements: Manganese, iron, chromium and titanium. The role of detected elements has been discussed towards the human health.
Keywords
Direct current arc emission spectroscopy, Elemental analysis, Mineral elements, Gram seed
Introduction
Pulse industry and its derived products have great economic and social importance worldwide as they are an excellent source of protein, carbohydrate, fibres and minerals. Gram is a highly nutritious food which provides a large number of health benefits. It has high protein content; it can easily be consumed by vegetarians to fulfil their protein needs [1]. This necessitates the determination of nutrients profile in pulses for the quality control. Several analytical techniques such as mass spectrometry, inductively coupled plasma atomic emission spectroscopy, graphite furnace atomic absorption spectroscopy, flame photometry and X-ray fluorescence spectroscopy are being used conventionally for the nutrient analyses [1,2] but these techniques are limited by time consuming sample digestion procedures prior to the analysis of sample and are expensive. Sample processing and digestion procedures are complex, laborious, time consuming, and increase the chance of sample contamination during pre-treatment. Therefore such technique is required which is free from sample processing and digestion, fast, reliable, cost-effective, user friendly, eco-friendly, free from spectral interference and having simultaneous multi-elemental capability. One such technique is direct current (dc) arc optical emission spectroscopy. It works on the principle of detection of optical radiation emitted by the sample on excitation using direct current source. The characteristic radiation is produced between two carbon electrodes separated by small gap connected with direct current source. The resulting glow is recorded with the help of spectrometer. The recorded pattern gives atomic lines of different elements present in the sample that can be identified with the help of reference spectral database [3-6].
In the present study, potential of the direct current arc optical emission spectroscopy technique has been examined for investigating the elemental profile of the naturally mature gram seeds by recording its optical emission spectrum.
Material and Method
Sample collection
The naturally matured grains of the gram were procured from the local seed market of Allahabad. The uniform sized grains of gram were selected and washed with double distilled water to remove the surface contamination and then dried at room temperature. After that, the grains were grounded in powder form using mechanical pestle and mortar arrangement so that homogeneous powder of the sample can be obtained. This powdered sample was used for the experimental purpose.
Direct current arc optical emission spectroscopy arrangement
The schematic arrangement of the direct current arc optical emission spectroscopy technique is shown in Figure 1. The arrangement consists of direct current arc system, controlling resistance, fibre optic coupled spectrometer attached with a signal processing unit. The direct current arc system consists of two carbon electrodes connected with the direct current power supply (~140 V) together with a controlling resistance called Ballast resistance. The carbon electrodes are fabricated by using high purity material each of length about 15 cm and diameter 1 cm in the departmental workshop. One end of each carbon electrode is made pointed with the help of lathe machine while the other remains blunt. In the lower electrode, at the pointed end a cavity of the diameter 2 mm and 5 mm length was created to fill the sample. The fiber optic coupled Multi-Channel Spectrometer [Photon Control, Canada] was used for acquiring the emitted radiation. The computer controlled spectrometer consists of three gratings producing the spectral regions 300-500, 500-700 and 700-900 nm and is attached with 2 m long and 600 μm fiber optic cable. SpecSoft MSS 3.0 software was used for procuring the emission signal.
Procurement of the optical spectrum of the gram seed
For recording the emission signal of the gram seed powder, the spectrometer was calibrated with the help of mercury arc and helium neon laser. The spectrum of the blank carbon electrode (without sample) was recorded in the identical experimental conditions that have to be used for procuring the spectra of the gram sample. A small amount of powder sample of the gram (10 mg) was kept inside the cavity of the lower carbon electrode. As the voltage was built up across the electrodes, it excited the powder sample which emitted characteristic radiation. These emitted radiations were collected with the help of fiber optic cable and fed to the slit of the Multi-Channel Spectrometer in the spectral region 300-900 nm at a resolution of 0.3 nm. The spectra of the blank carbon electrode and gram seed powder were recorded by varying experimental conditions such as electrode distance, amount of the gram seed sample, applied voltage and current, and collection angle. The spectra of the sample has been recorded by varying the electrode separation (1-5 mm), sample amount (10-1000 mg), voltage (65-90 V) and current of 2 Amp and collection angle 30-90°. The well developed and intense emission signal was obtained at the electrode separation of 5 mm at an effective voltage 70 V and current 2 Amp and collection angle of 90°.
Signal processing and statistical analysis
In order to extract the meaningful information from the acquired spectral data, the data were exported to the Origin 8.0. The spectral data were processed for the base line correction using piece wise correction method. Thereafter, the spectral profiles were identified with the help of NIST spectral database [7]. In order to estimate the peak parameters such as areal intensity, width and area of the spectral profile, the curve fitting procedure in Gaussian mode was adopted. The goodness of the fit was assessed by observing the Chi-square values. In order to check the reproducibility of the results, three spectra of 18 samples were recorded and the intensities calculated from curve fitting of the persistent lines were averaged. In order to find the relative abundance of the detected elements, the intensity ratio of the detected elements were estimated by using the ratio of averaged intensities of the persistent and strong lines of the elements with the averaged intensities of the persistent and strong line of the most abundant elements. The resultant standard error was used for deriving the uncertainty determination for the ratio of intensities. The results have been reproduced in the form of averaged value ± standard error.
Results and Discussion
In order to identify the presence of micro- and macro-elements in the sample, the emission spectrum of the powder sample of the gram seeds and blank carbon tube has been recorded in the spectral region 300-900 nm at a resolution 0.3 nm. The acquired emission spectrum is reproduced in the Figure 2a while Figure 2b depicts spectrum of the blank carbon electrodes. The spectrum shows number of spectral lines of varying intensities. The position of the spectral line gives the identity of the element while the intensity of the line provides content of the identified element present in the naturally mature gram seed. These atomic lines have been identified with the help of NIST spectral database [7]. The identified elements are marked in Figure 2a. The absence of the organic elements is due to high temperature of the arc arrangement while most of the inorganic elements present in the gram seed sample are displayed in the spectrogram. The amount of the detected element present in the gram seed sample is displayed in form of intensity. This means that greater is the intensity of atomic line, larger is the amount while weaker is the intensity smaller its quantity. The presence of the persistent lines of the elements such as potassium (404.4, 766.4 and 769.8 nm), sodium (588.9, 818.3 and 819.4 nm), calcium (393.3, 396.8, 421.5, 422.3, 443.4, 445.4 and 612.2 nm), iron (358.2 nm), magnesium (383.2 nm), manganese (403.4 nm), chromium (425.4, 427.4 and 428.9 nm), titanium (430.5 nm) and strontium (460.7 nm) in the acquired spectrum confirms the occurrence of these elements in the sample of the gram seed.
In the direct current arc excitation, mostly the persistent lines of neutral atoms appear as they arise from the ground state. The direct current arc excitation is a low energy excitation process and in general, the transitions involve from low lying upper excited states to the ground state. These transitions mostly belong to the neutral atoms. Being a low energy excitation source, thermal equilibrium prevails and Maxwell-Boltzmann distribution law holds for the intensity distribution. This is useful for the determination of the concentration of the detected elements. These lines clearly assure the presence of the elements in the sample. Sometimes lines of the ionised atoms may also appear but they lead to ambiguous identification and therefore lines of ionised atoms are not considered in the analysis.
The apparent intensity of the atomic lines in the yellow and red region (sodium and potassium) is enhanced due to the overlapping of the impurity and black body radiation emitted by the carbon tube therefore the atomic lines in this region are not considered for the estimation of the level of the elements detected. In order to determine the relative abundance of the detected elements in the gram seed, the atomic lines free from overlapping of the black body radiation of the carbon electrode have been considered. The elements like calcium, iron, potassium and magnesium are seen to be present in significant proportion. Due to its high calcium content, it is used to combat malnutrition in developing countries.
When a series of spectra is recorded by varying the experimental condition such as electrode separation, applied voltage and current together with the diameter of the cavity in the lower electrode, then the intensity of the emission signal varies. However the intensity ratio (normalized intensity) always remains constant in a given sample and is always independent of the experimental condition. Therefore it is customary to determine the intensity ratio for the qualitative and semi-quantitative analysis. Curve fitting has been applied for the estimation of the areal intensity of the spectral signature which has been used for the determination of fraction of the concentration of respective element detected in the gram seeds. The ratio of intensity of the calcium to calcium (I422.3/I422.3), magnesium to calcium (I383.2/I422.3), chromium to calcium (I425.4/I422.3), iron to calcium (I358.2/I422.3), potassium to calcium (I404.4/I422.3), manganese to calcium (I403.4/I422.3), lead to calcium (I438.6/I422.3) and barium to calcium (I455.4/I422.3) has been evaluated from the obtained intensity and found to be 1 ± 0.00, 0.77 ± 0.03, 0.56 ± 0.02, 0.15 ± 0.07, 0.09 ± 0.009, 0.11 ± 0.007, 0.04 ± 0.008 and 0.02 ± 0.001 respectively. The relative fraction of the abundance of the detected elements in gram seeds is shown in Figure 3. The intensity ratio of the minerals calcium, iron, magnesium and potassium are quite high compared with the other minerals therefore; their abundance is large in the gram seed. A small deviation from the reported findings might be due to change in various factors like water quality, soil condition, and environmental factors [2].
Calcium is important for healthy bones and teeth, nerve functioning, health of immune system, blood clotting and blood pressure regulation and helps to relax and contract the muscles. Potassium is needed for proper fluid balance, nerve transmission, muscle contraction, suitable maintenance of blood pressure and waste elimination. Magnesium is found in bones, needed for the formation of protein, muscle contraction, immune system health and nerve transmission and assists in avoid constipation. Sodium is needed for appropriate maintenance of electrolyte balance and fluid balance, heart function and specified metabolic activities, muscle contraction and nerve transition. Manganese is a part of many enzymes, important for the normal functioning of the brain and proper activity of nervous system throughout the body, vital for proper and normal growth of human bone structure, useful for post-menopausal women and preventing osteoporosis. Iron is needed for the formation of hemoglobin in red blood cells, which carries oxygen from the lungs to the body cells, needed for energy metabolism, a transport medium for electrons within cells, an integrated part of important enzyme systems in various tissues. Chromium is important in the metabolism of fats and carbohydrates, important for brain function and other body processes, stimulates fatty acid and cholesterol synthesis, works closely with insulin to regulate blood sugar (glucose) level [8,9]. Strontium helps in boosting the formation of collagen and cartilage in joints in humans. It is used for treating thinning bones (osteoporosis) and arthritis. Radioactive strontium-89 is given intravenously for prostate cancer and advanced bone cancer. Compounds of strontium are also added to toothpaste to reduce pain in sensitive teeth. There are no reports about the significant role of titanium in human body.
Conclusion
The study demonstrates the capability of direct current arc optical emission spectroscopy technique for the elemental analysis of the food grains like cereals and pulses. This technique is useful for the assessment of elements present in the pulses due to its simplicity, rapidity, accuracy, low cost, user friendly, reproducibility, and multi-element detection capability. This technique provides qualitative and semi-quantitative estimate of nutrients, unknown element and contaminant (if any) present in the material rapidly.