
International Journal of Experimental Spectroscopic Techniques
(ISSN: 2631-505X)
Volume 6, Issue 1
Research Article
DOI: 10.35840/2631-505X/8528

Article Formats
Modulation-Sensitive Spectroscopy of Noble Gases in Plasma
Table of Content
Figures
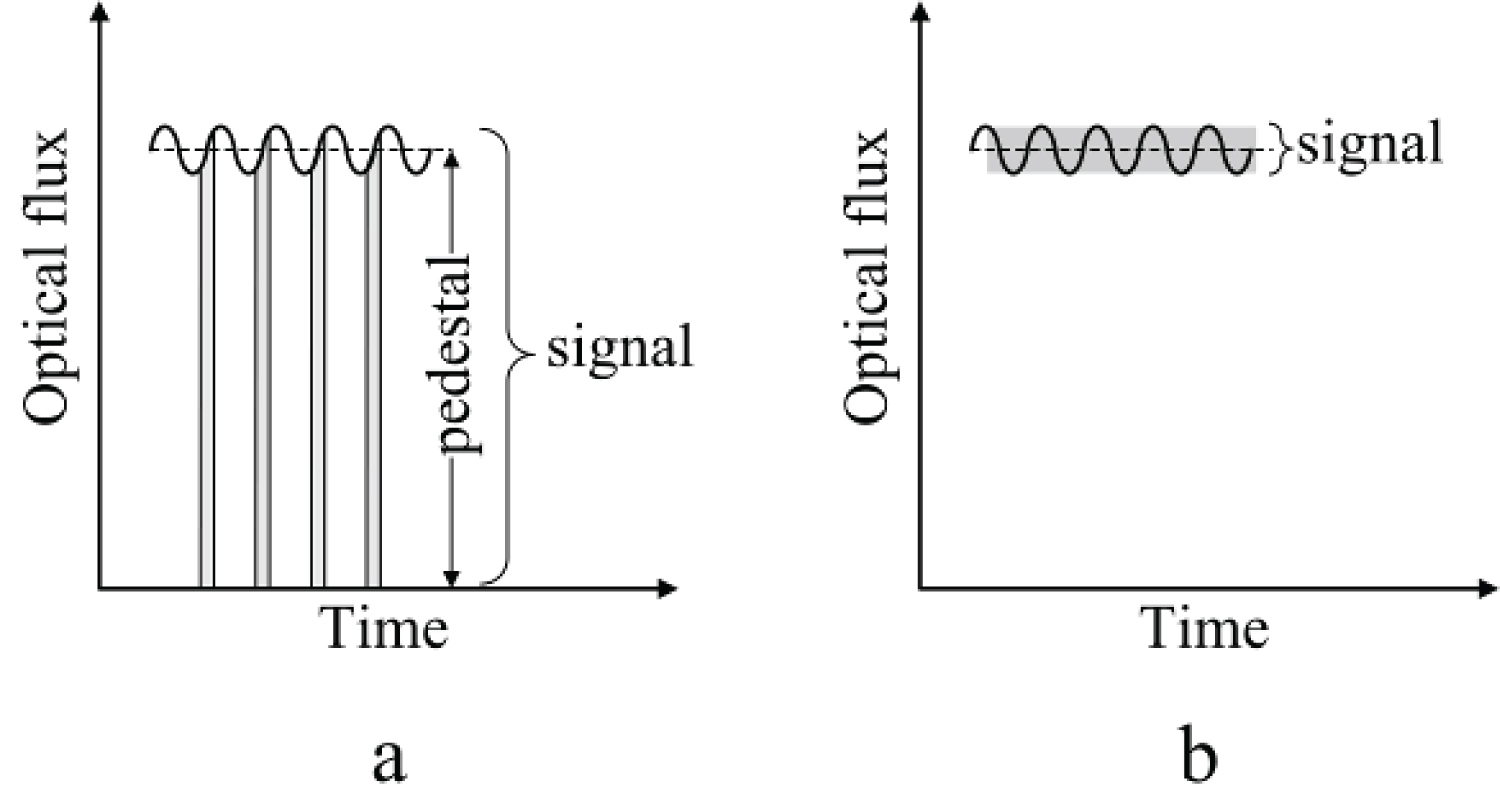
Figure 1: In gated spectrometers, the signal....
In gated spectrometers, the signal contains both the pedestal and the modulated component (a). In modulation-sensitive spectrometers, the signal is formed only by modulated optical component of light (b).
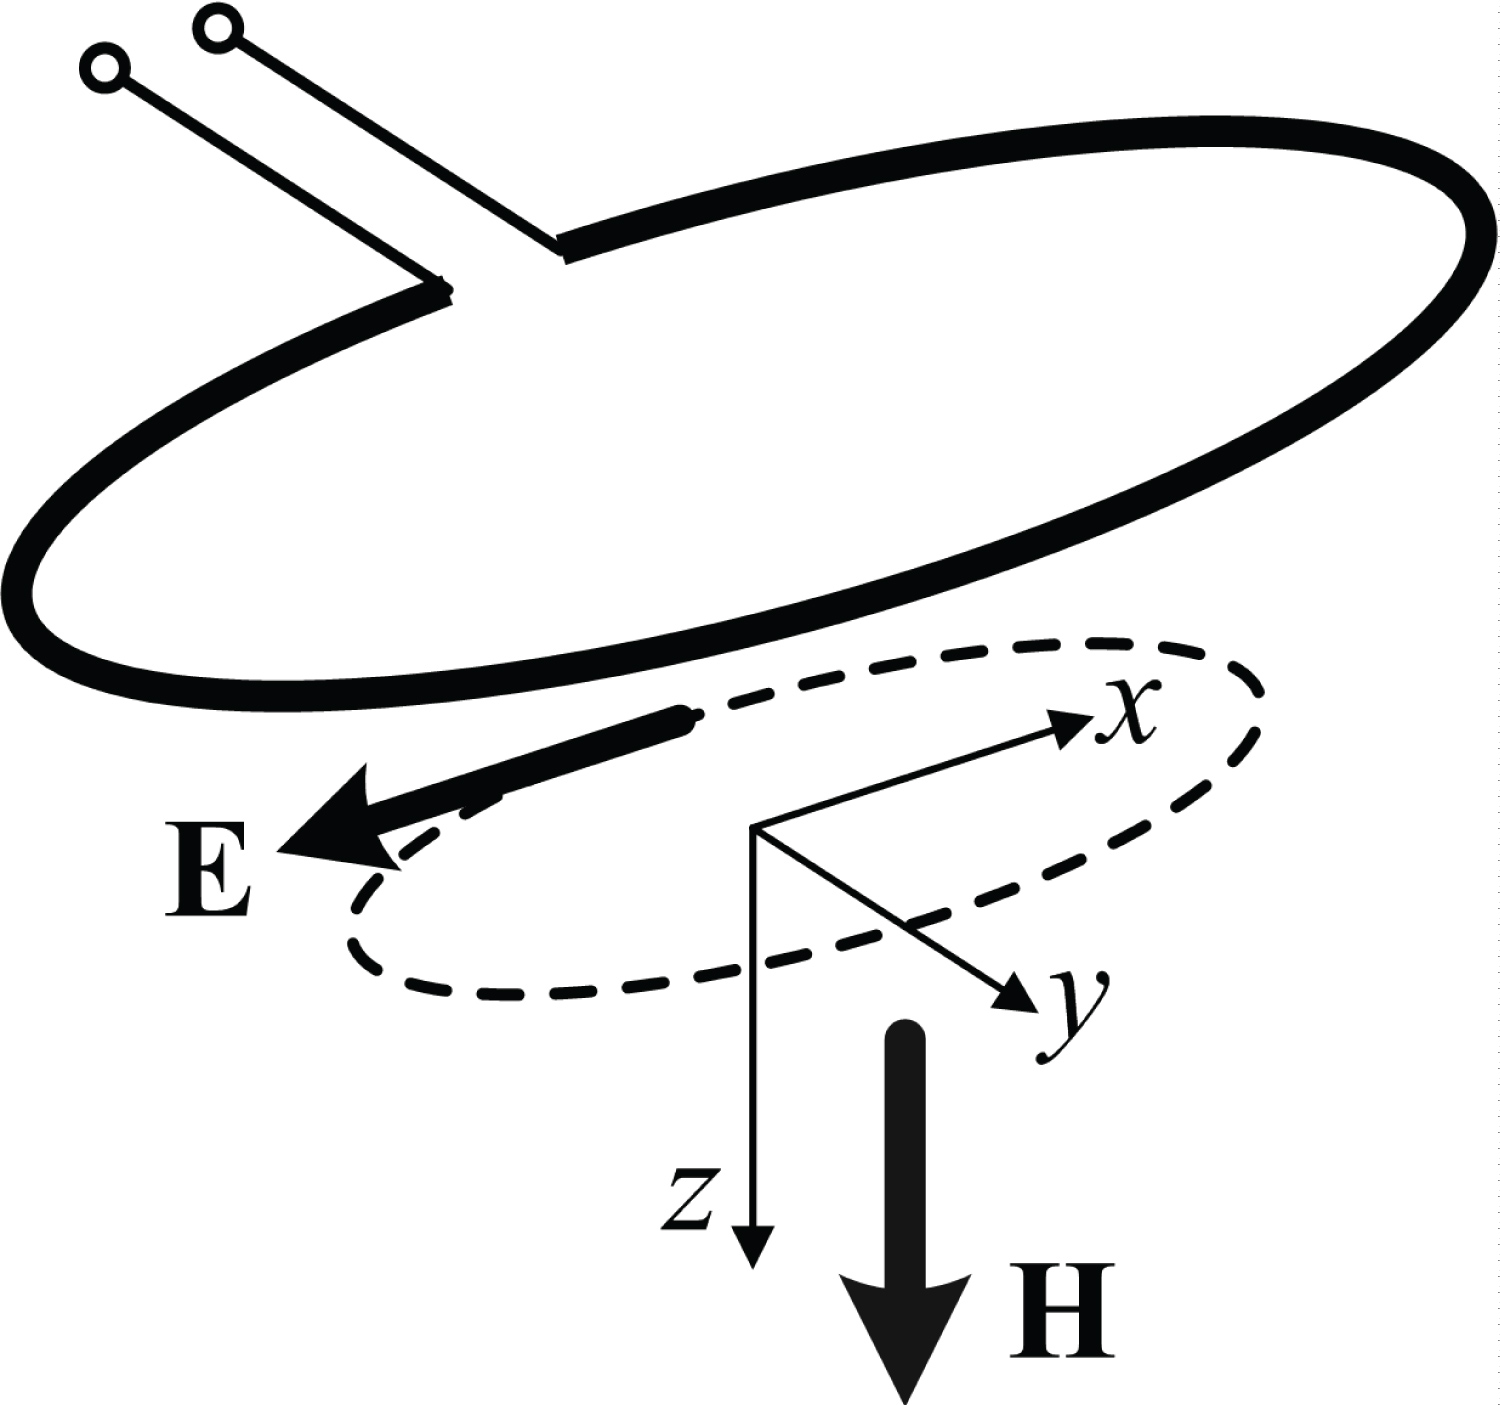
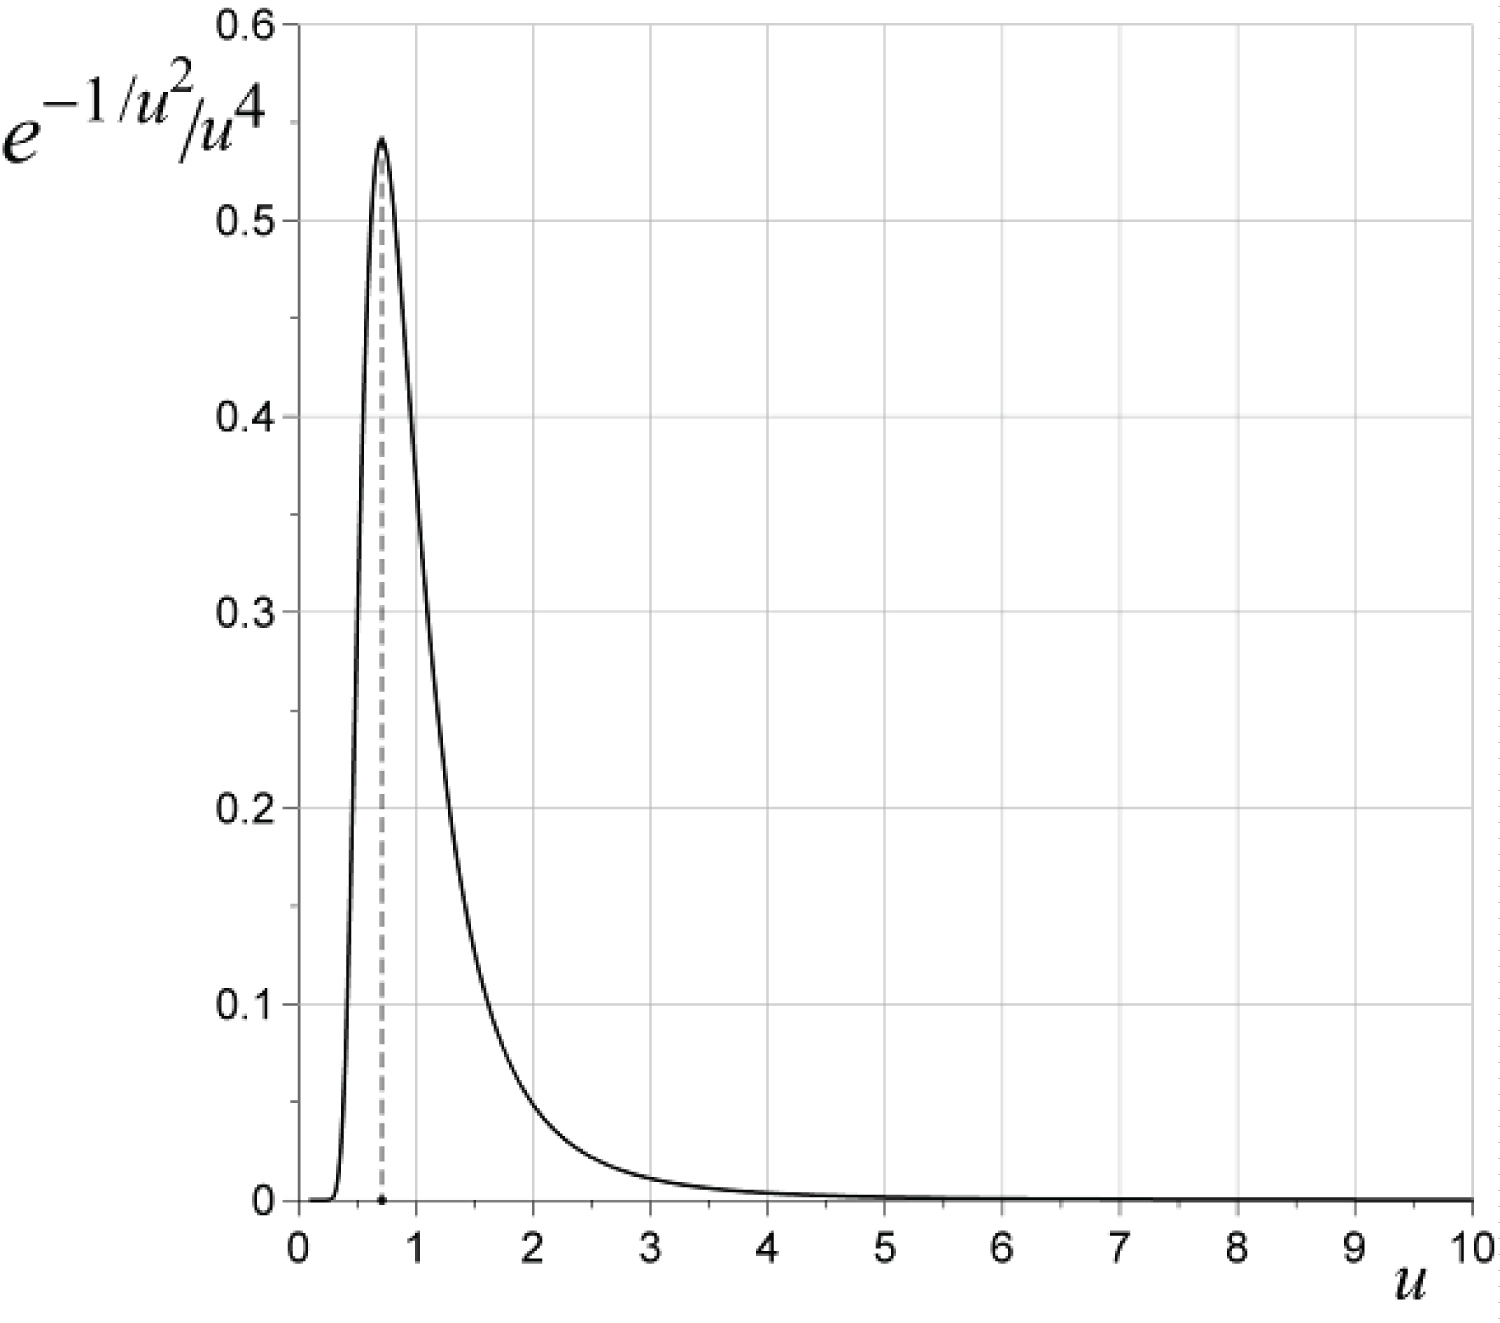
Figure 3: Probability density of the....
Probability density of the inter-collision interval τ as a function of the parameter u. The maximum probability is reached at um = 2-1/2.
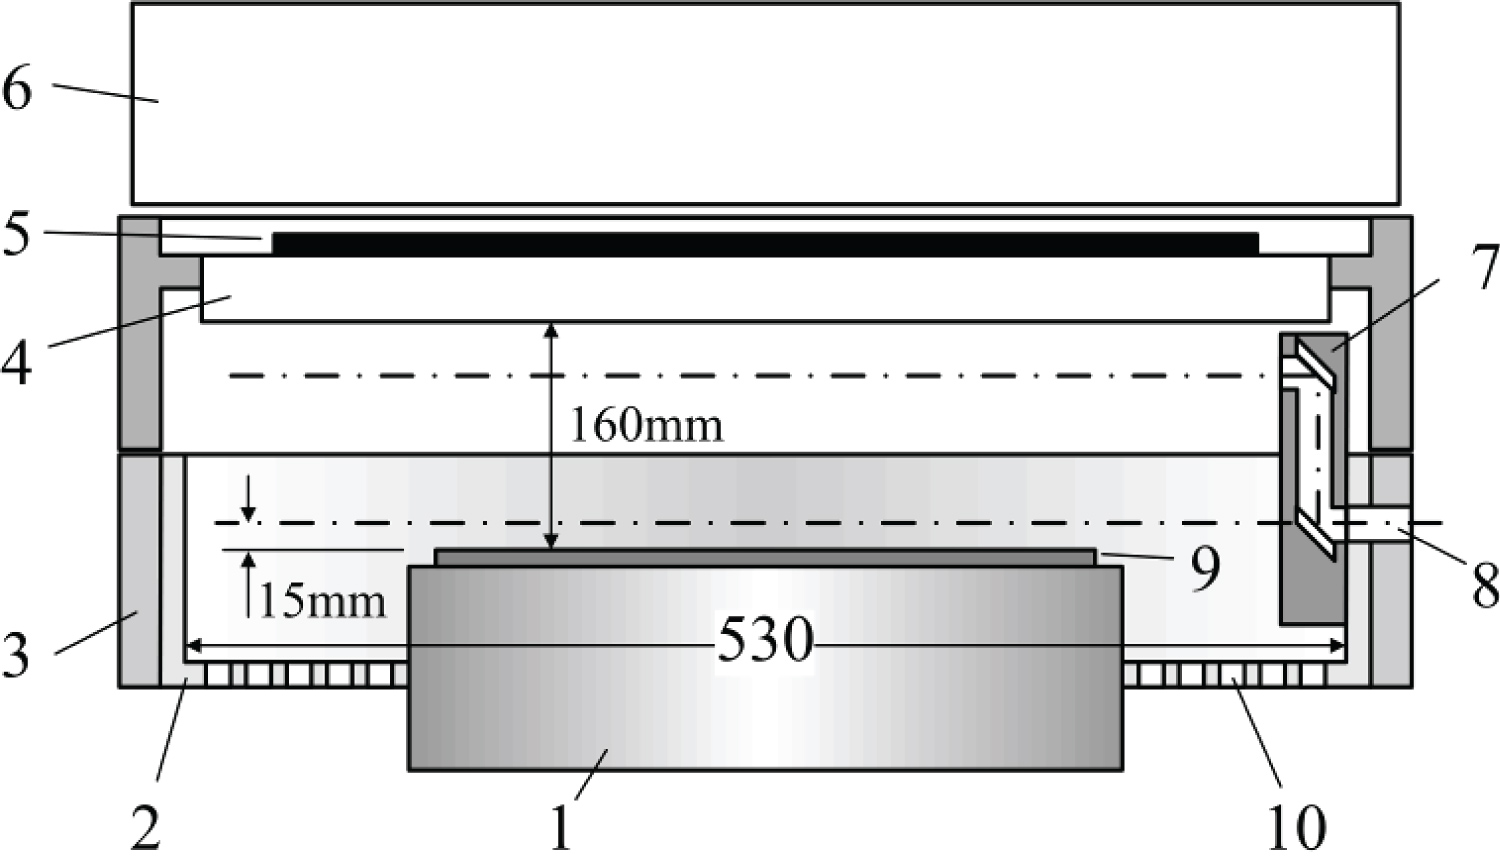
Figure 4: Schematic diagram of 13.56 MHz....
Schematic diagram of 13.56 MHz inductively coupled plasma chamber. 1) Pedestal; 2) Liner; 3) Lower wall; 4) Quartz plate; 5) Antenna; 6) Matcher; 7) Periscope; 8) Viewport; 9) Wafer; 10) Pumping canals.
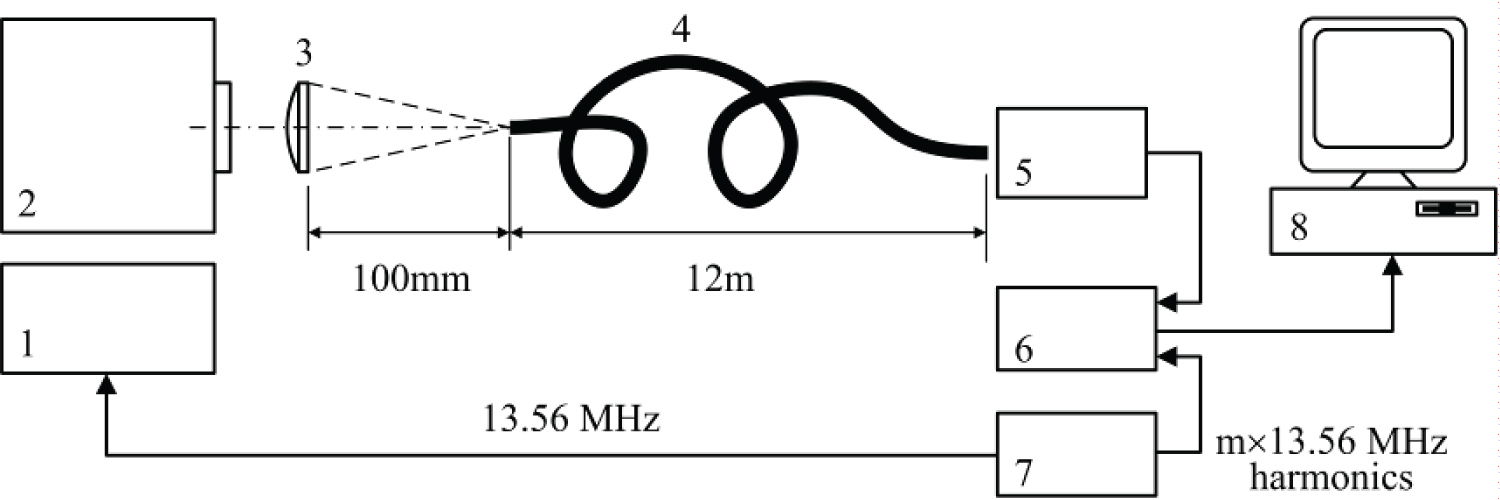
Figure 5: Generalized scheme of measurements....
Generalized scheme of measurements. 1) Power generator; 2) The chamber; 3) Collecting lens; 4) Optical fiber bundle; 5) Modulation-sensitive spectrometer; 6) Lock-in amplifier; 7) Function generator; 8) Computer.

Figure 6: Modulation-sensitive spectrometer....
Modulation-sensitive spectrometer: 1) Lateral aligner; 2) Corner-cube reflector; 3) Photodetector; 4) Optical fiber; 5) Connector for the piezo-stage.
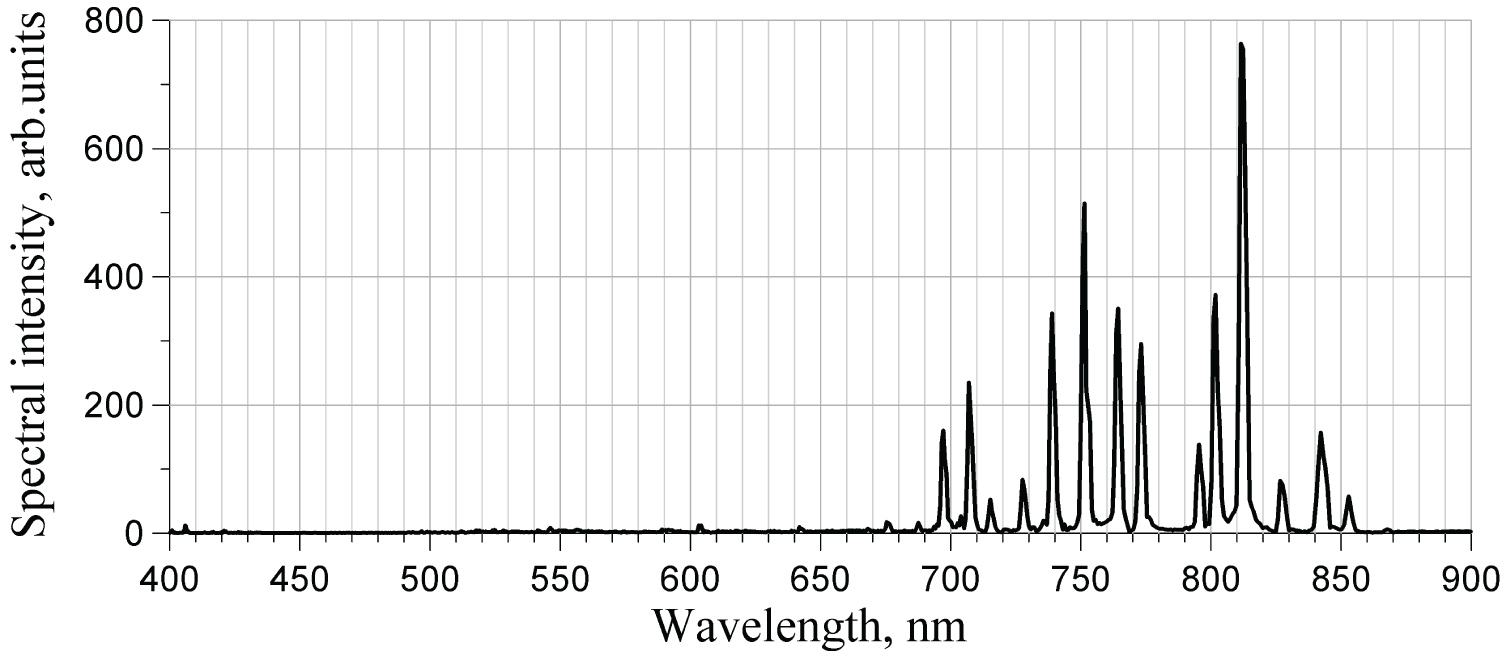
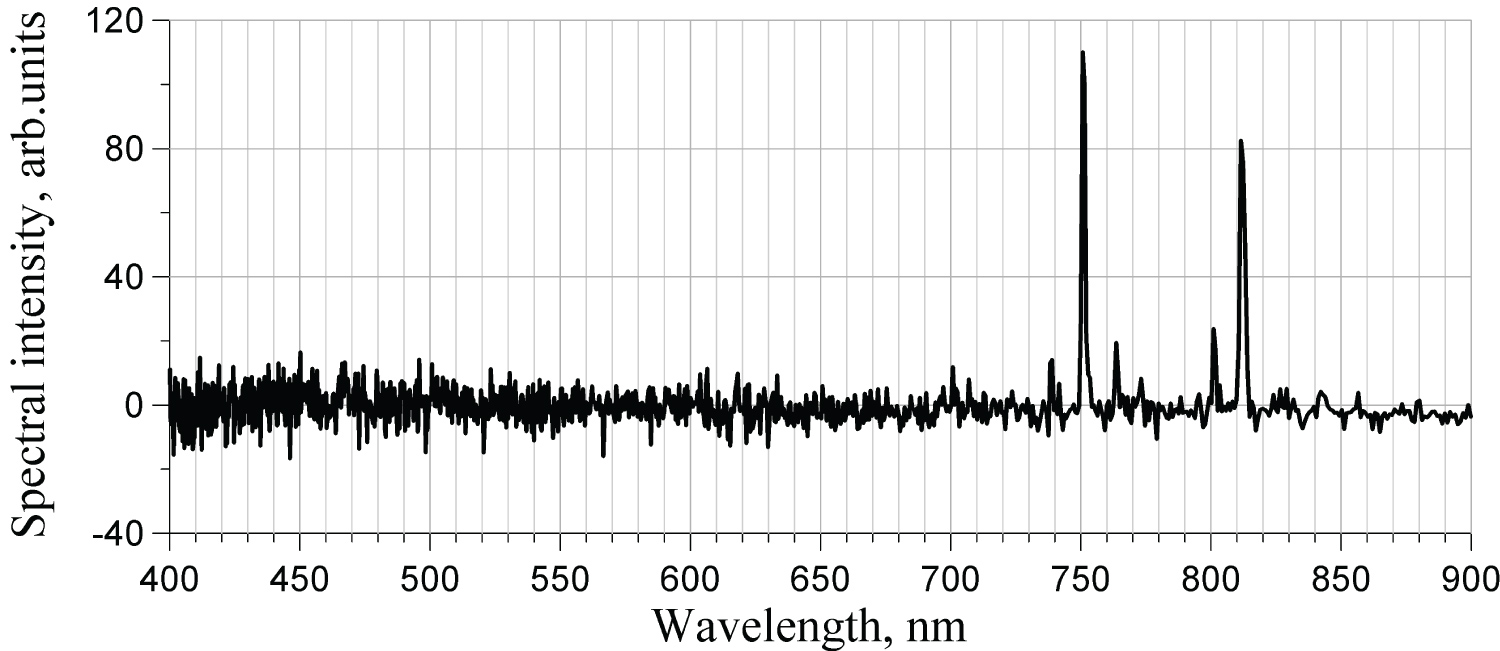
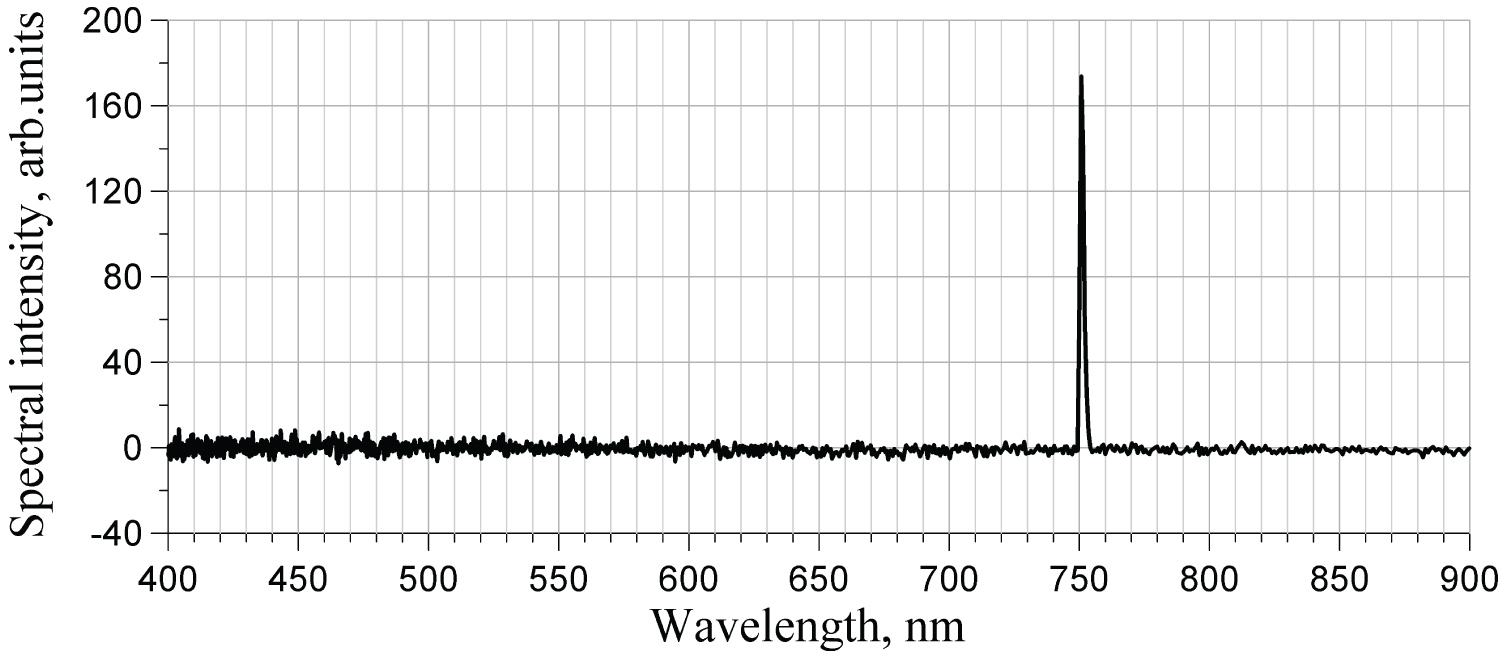
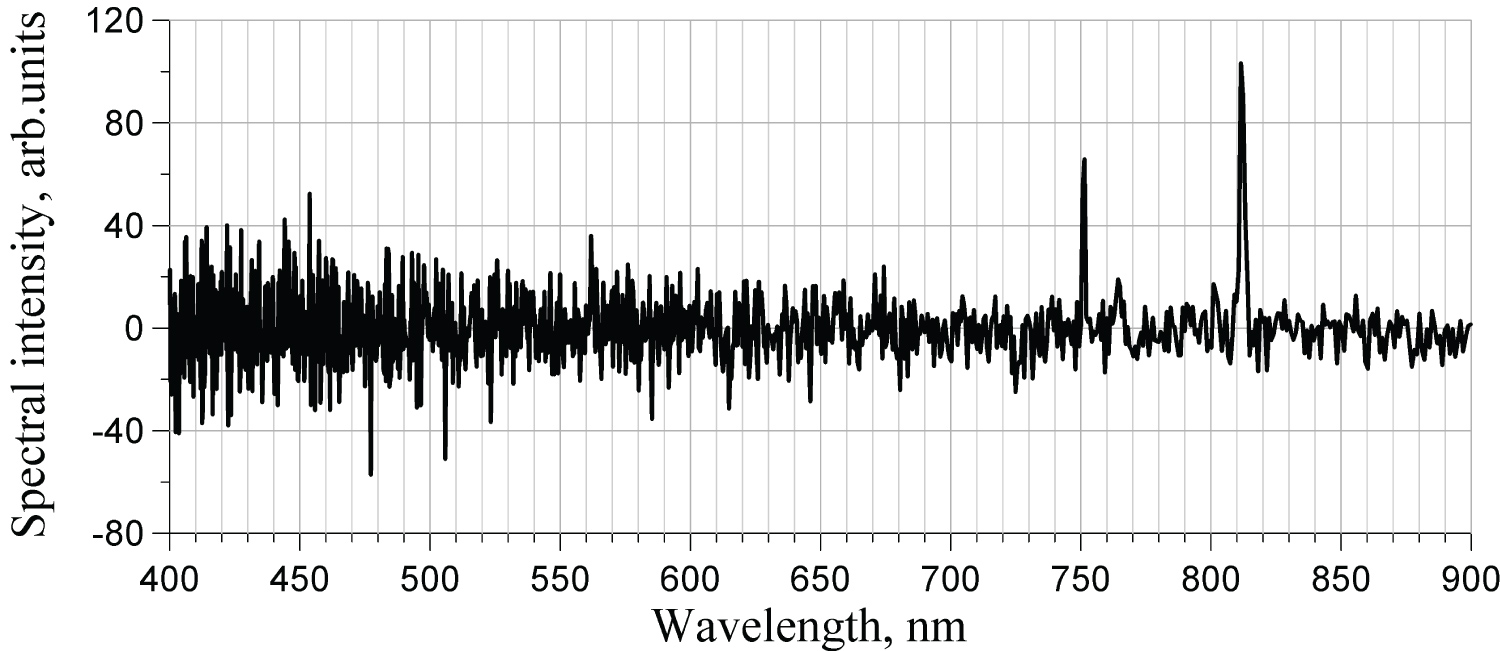
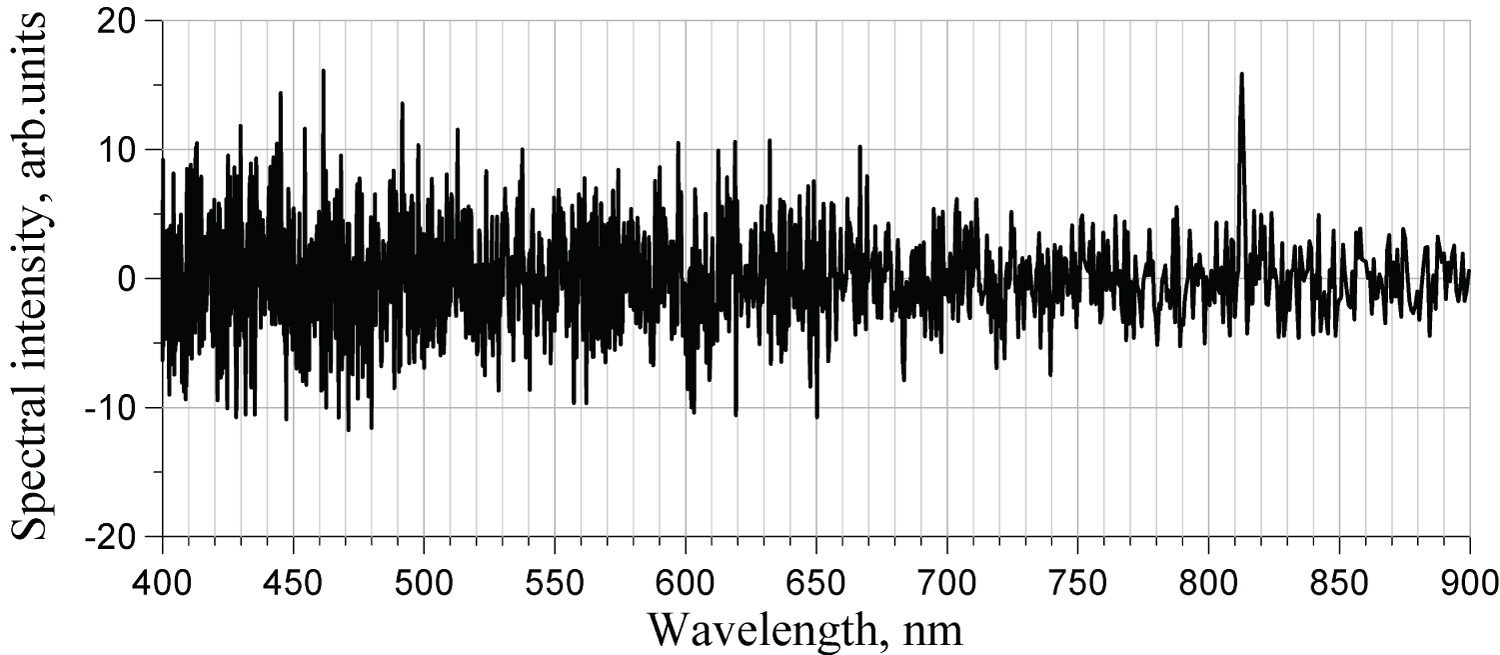

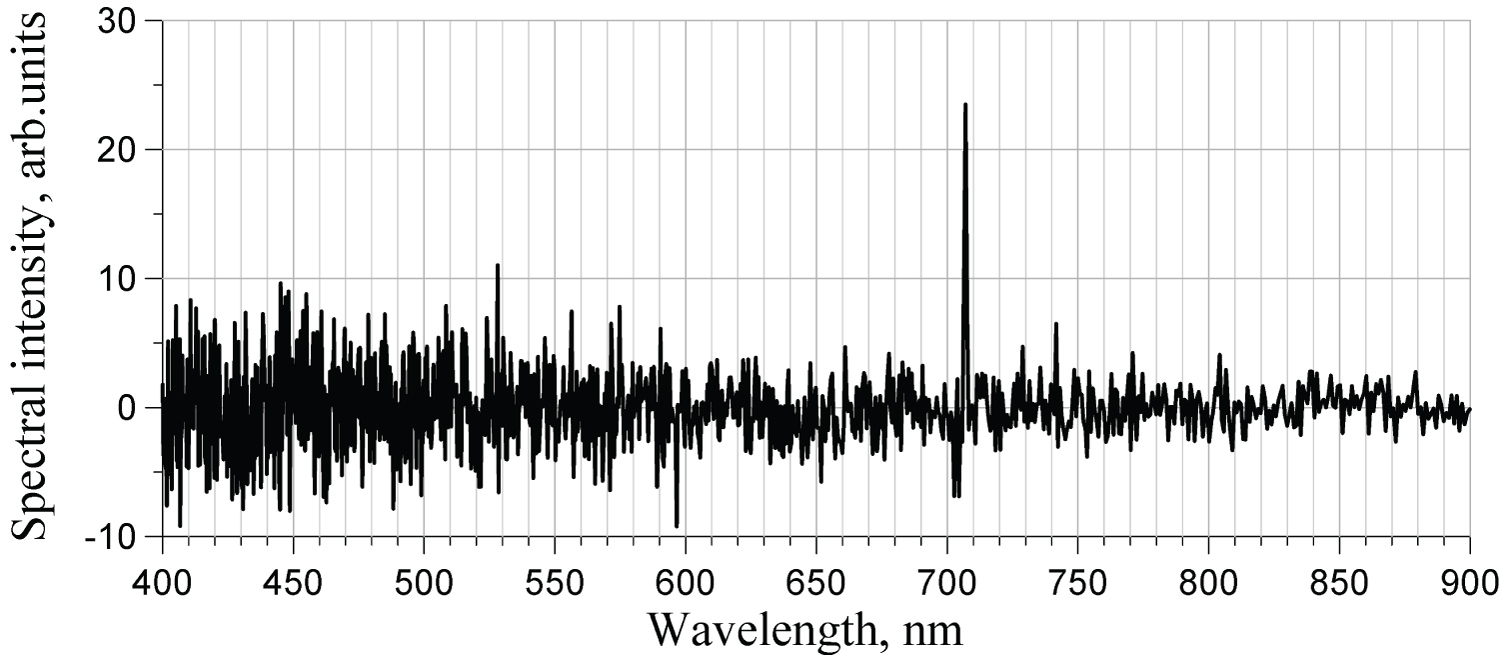
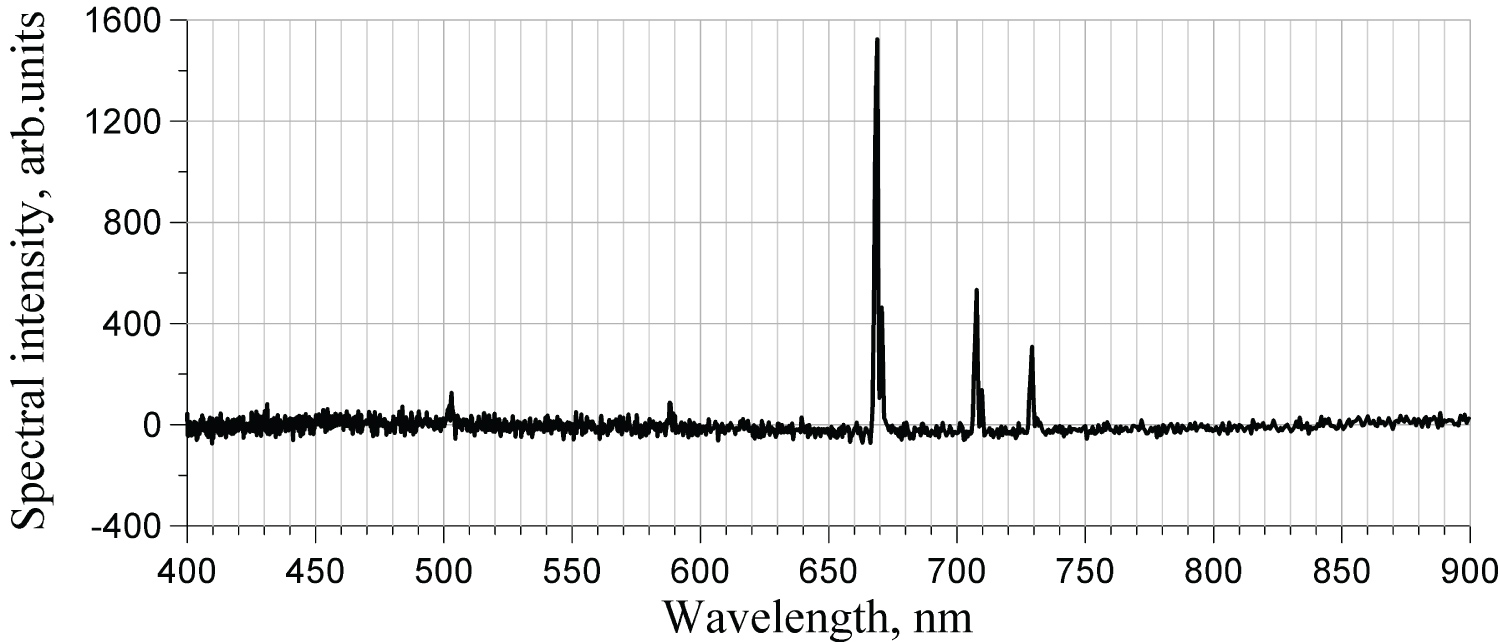
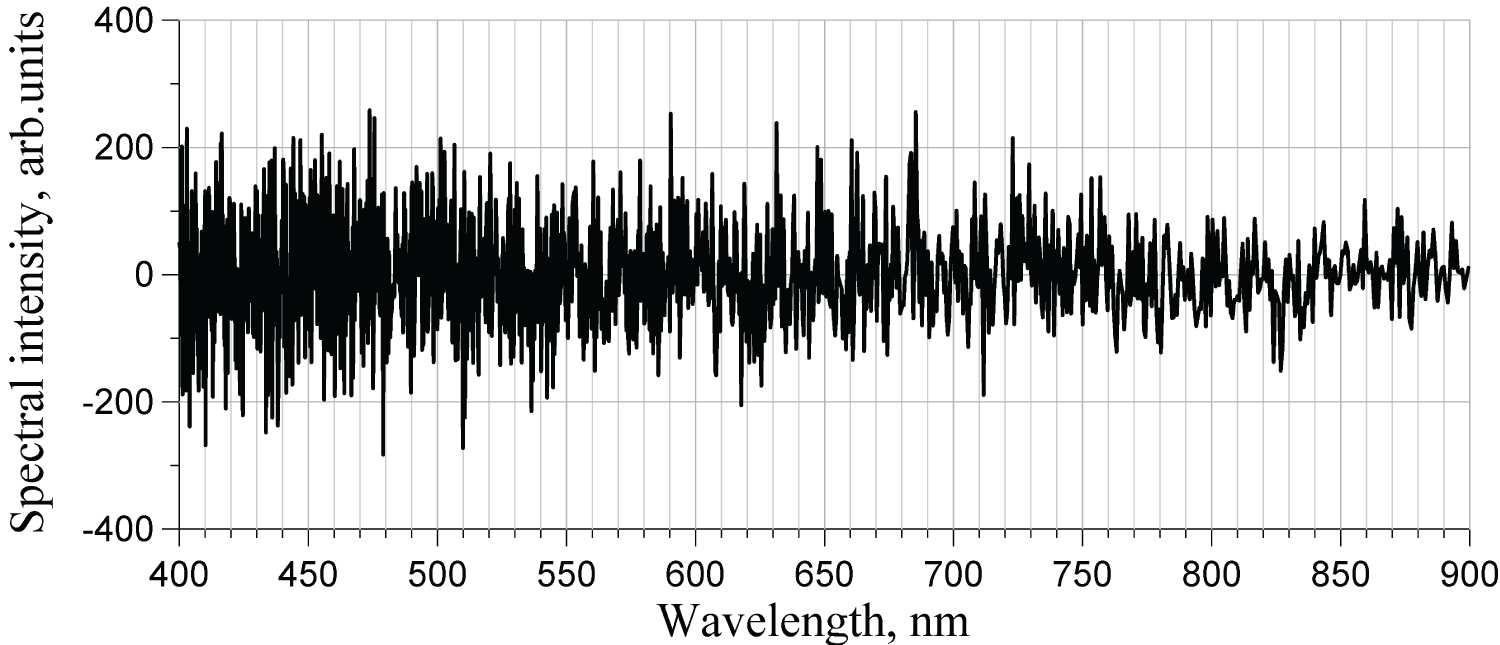
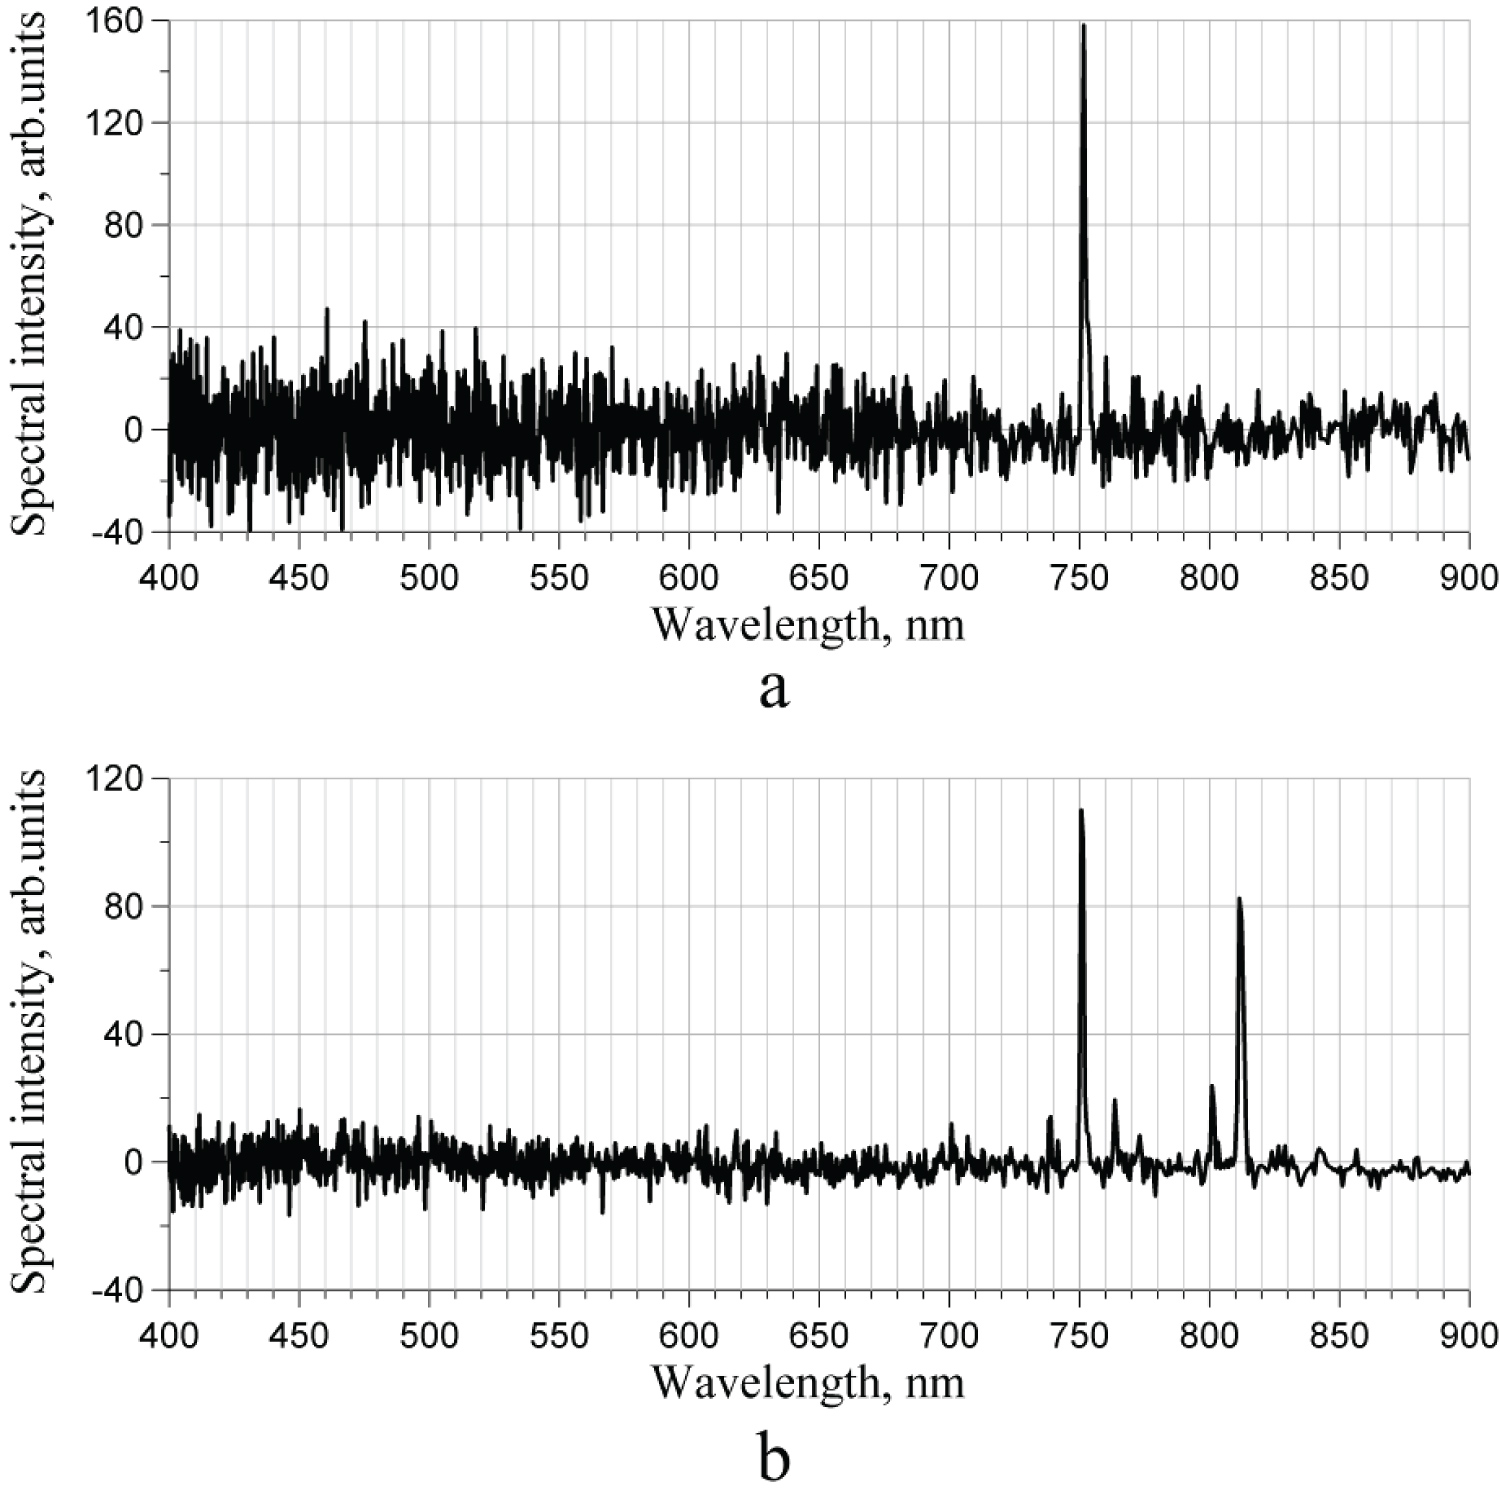
Figure 16: Two Ar spectra of the 1st....
Two Ar spectra of the 1st harmonics before (a) and after (b) opening the chamber.
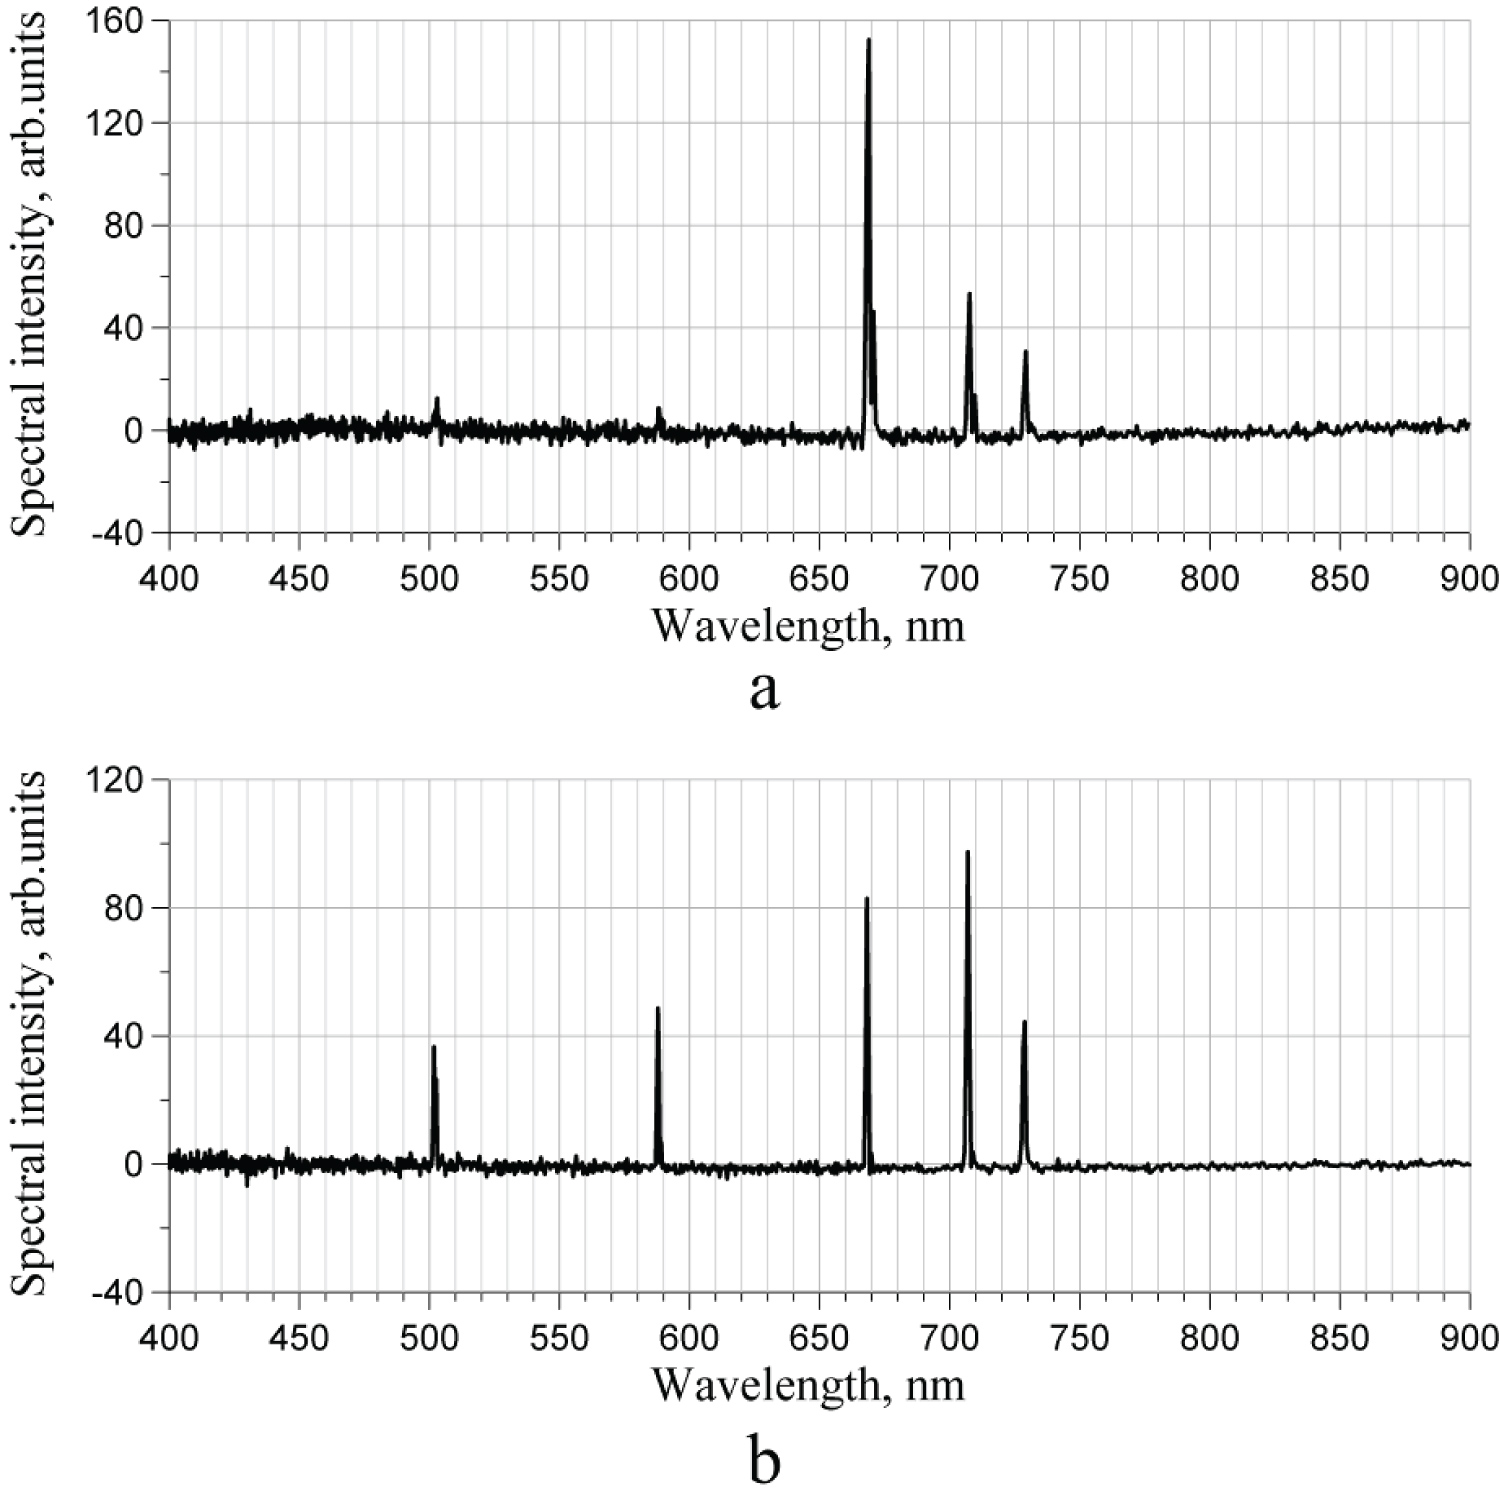
Figure 17: Two He spectra of the 2nd...
Two He spectra of the 2nd harmonics before (a) and after (b) opening the chamber.
Figure 18: 1) Optical signal...
1) Optical signal; 2) Spectrometer; 3) Electrical signal; 4) Fourier transform; 5) Spectrum; 6) Function generator; 7) Electrical signal at frequency ω0 ; 8) Lock-in amplifier; 9) Variable attenuator. The left panels of this figure show optical measurements, and the right ones - their electrical simulation.
References
- Lieberman MA, Lichtenberg AJ (2005) Principles of plasma discharges and materials processing. (2nd edn), Wiley.
- O'Connell D, Niemi K, Zaka-ul-Islam M, Gans T (2009) Space and phase resolved optical emission in mode transitions of radio-frequency inductively coupled plasmas. 2nd Int, Int Workshop on Non-equilibrium Processes in Plasmas and Environmental Science Journ of Phys Conference Series 162: 012011.
- Mahony CMO, Wazzan RAl, Graham WG (1997) Sheath dynamics observed in a 13.56 MHz-driven plasma. Appl Phys Lett 71: 608.
- Gzaretzki U, Luggenholscher D, Dobele HF (1999) Space and time resolved electric field measurements in helium and hydrogen RF-discharges. Plasma Sources Sci Technol 8: 230-248.
- Abdel-Rahman M, Gans T, Schulz-vonder V, Dobele HF (2005) Space and time resolved rotational state populations and gas temperatures in an inductively coupled hydrogen RF discharge. Plasma Sources Sci Technol 14: 51-60.
- Protopopov V (2014) Practical opto-electronics. Optics & Lasers, Springer.
- Protopopov V (2020) Imaging fourier spectrometer in visible domain. Int J Exp Spectroscopic Tech 59: 6252.
- Moisan M, Pelletier J (2012) Physics of collisional plasmas. Physics of Collisional Plasmas, Springer.
- Raiser YP, Shneider MN, Yatsenko NA (1995) Radio-frequency capacitive discharges. CRC Press.
- Polyanin AD, Zaitsev VF (2003) Handbook of exact solutions of ordinary differential equations. (2nd edn), Chapman and Hall.
- Gudmundsson JT, Lieberman MA (1998) Magnetic induction and plasma impedance in a planar inductive discharge. Plasma Sources Sci Technol 7: 83-95.
Author Details
V Protopopov*
Samsung Electronics, Hwaseong-si, Gyeonggi-do, South Korea
Corresponding author
V Protopopov, Samsung Electronics, Hwaseong-si, Gyeonggi-do, 18448, South Korea.
Accepted: May 22, 2021 | Published Online: May 24, 2021
Citation: Protopopov V (2021) Modulation-Sensitive Spectroscopy of Noble Gases in Plasma. Int J Exp Spectroscopic Tech 6:028.
Copyright: © 2021 Protopopov V. This is an open-access article distributed under the terms of the Creative Commons Attribution License, which permits unrestricted use, distribution, and reproduction in any medium, provided the original author and source are credited.
Abstract
There are special applications of spectroscopy when only modulated components of optical flux have to be measured on the background of a non-modulated component. In those cases, a Fourier spectrometer with high-speed photodetector coupled to a narrow-pass radio filter may be used. This technique, which is named the «modulation-sensitive spectroscopy», makes it possible to measure extremely weak modulations on the level of 10-2-10-6, like those observed in inductively coupled plasmas excited by high-frequency electromagnetic fields. The present work describes the basic theory of this phenomenon, experimental arrangement, the spectrometer itself, and presents experimental spectra of the first four harmonics of the modulated optical emission of plasma.
Keywords
Fourier spectroscopy, Modulation-sensitive spectroscopy, Inductively coupled plasma, Nobel gases, Plasma optical emission
Introduction
Rapid advance of semiconductor industry is a driving force for research of inductively excited plasma-a tool for manufacturing electronic components by means of plasma-chemical etching [1]. Among numerous fundamental questions of plasma physics, which were addressed and studied on plasma etching machines in recent years, there is the one that was not fully resolved: Whether or not the optical emission of plasma is modulated at excitation frequency, and if it is then what the modulation depth is and how the spectra of modulated components differ from the static spectrum. A series of research was done on the gases with low ionization energies, like hydrogen, oxygen, and krypton [2-5]. It was shown that modulation depth of optical emission of these gases may reach 20% at various excitation frequencies, ranging from 2 MHz to 13.56 MHz, thus making measurements possible with traditional time-resolved spectroscopy. In this technique, optical emission is sensed during short pulses, locked in phase with excitation or modulation frequency of plasma. Changing this phase, it is possible to study optical spectra of plasma emission as a function of phase, obtaining versatile information about plasma dynamics. Referencing optical spectra to the phase of plasma modulation gave birth to another name of the same technique-the phase-resolved spectroscopy.
Although very popular among researches, accurate, and versatile tool for plasma diagnostics, the phase-resolved spectroscopy cannot be applied to weakly modulated plasma phenomena because strong constant background (pedestal) suppresses weak modulated component (Figure 1a). Recently, the concept of modulation-sensitive spectroscopy was practically verified as a reliable technique, in which only modulated component of light is analyzed, excluding constant background from measurements [6,7] (Figure 1b). In this technique, the Fourier-transform spectrometer with narrow-pass radio-frequency filter at its output is used to select solely the modulated component of the spectrum. The modulation-sensitive spectroscopy is capable of measuring modulated component of spectra with coefficients of modulation below 10-4 -the values completely unattainable for ordinary phase-resolved spectrometers. Such high sensitivity opened a possibility to study gases with high ionization energies, like argon and helium-the gases widely used in semiconductor processing.
The present publication reports on measuring modulation of Ar and He optical emission spectra in inductively-coupled plasma at excitation frequency 13.56 MHz and its harmonics. For the convenience of readers, the detailed description of the results, which are presented in the sections below, is prefaced by their summary:
• Modulation depth of all spectral lines of Ar and He is on the scale of 10-3-10-6 or less;
• Only very few specific spectral lines-typically one or two of the entire set of lines-are modulated;
• Spectra of modulated optical components are very sensitive to the condition of the chamber, i.e., to its aging.
This publication is structured as follows. After introduction, the brief qualitative theory is outlined, followed by description of experimental installation and experimental results. The concluding remarks are summarized in the last section.
Qualitative Theory
In inductively coupled plasma, a circular coil creates magnetic field H, directed normally to the coil and oscillating with radio frequency, which creates he orthogonal electric field E (Figure 2). In simplified qualitative theory, z-component of the electric field may be assumed zero. Between collisions, the equations for the components of the velocity of an electron are
Where q and m are the charge and mass of the electron. The energy of the electron is
The electric field oscillates with angular frequency ω independently of the motion of the electron:
Here the time origin is chosen at zero phase. If the electron collided the last time at t = t0, then the system (1) can be easily solved:
This solution is valid until the next collision of the electron.
Evolution of the electron energy (2) as a function of time t can be found, substituting formula (4) into formula (2). We do not know, how long time will pass until the next collision, therefore, it is necessary to average formula (2) over all possible inter-collision intervals τ = t - t0:
Here the angle brackets denote averaging over this parameter. Since the real probability density of this parameter is never known, it is logical to estimate it from the probability density of the electron velocity v, assuming it to be Maxwellian [8]:
Physically, there must be inverse proportionality between τ and v
With the proportionality coefficient l having the meaning of a free electron path. On this basis, it is possible to compose an equation, connecting the unknown with the known , using equality of the probability function P(τ) computed over the two variables τ and v:
From formula (8)
This function is shown in Figure 3. Its narrowness greatly simplifies calculations because the averaging of formula (5) may be approximated as setting τ equal to its most probable value
and dropping the index «m» for conciseness.
Additional simplification comes from the fact, that in practice, at the standard excitation frequency 13.56 MHz and pressures 10 mTorr or higher, [9], so that As a result,
With and being unimportant phases. Here we used
Formula (11) has clear physical meaning: Between two consecutive collisions, an electron acquires additional energy (heating-the second term in formula (11)) and its energy becomes modulated with the first (the third term in formula (11)) and second harmonics of excitation frequency (the last term in formula (11)). These three additional components of the electron density tend to zero when the average inter-collision time tends to zero.
After long time after plasma ignition, the heating term in formula (11) becomes compensated by dissipative processes, and the stationary form of electron energy may be written as
Where coefficients a, b, and c depend on the electron charge and mass, the strength of electric field, and oscillating frequency.
Electrons in plasma excite optical emission of atoms with optical flux being proportional to the number of excited transitions n. Consider a single spectral line, corresponding to the transition with the decay time T. This spectral line may be excited by electrons with various energies , and the efficiency of excitation depends on . Denoting the excitation rate the differential equation for n takes the form
According to formula (13), the energy of electrons oscillates with time. Therefore, the integral in the right-hand side of formula (14) may be written as a time-dependent function
Such an equation may be solved analytically [10]:
In formula (13), parameters b and c are small, comparing to a. Therefore, formula (15) may be expanded in McLaurin series over powers of the sum These powers will create cross-products that, eventually, create the entire spectrum of harmonics m = 1,2,3,.... Thus,
Substitution of formula (17) into formula (16) gives time dependence of the optical flux:
The first conclusion that follows from this formula is that all harmonics of the excitation frequency are expectable in the optical flux of plasma emission. The second conclusion is that it is almost impossible to predict which particular harmonic will dominate: coefficients depend on numerous physical parameters, such as average electron energy , inter-collision time interval , excitation efficiency and decay time T of a particular spectral line, and others. Such uncertainty of the above qualitative theory and the absence, to the extent of our knowledge, of the quantitative theory, makes experimental study of the phenomenon even more interesting and challenging.
Experimental Installation and Measurement
The experiments were made at a standard etching chamber that is routinely used in production lines for manufacturing electronic devices at 300 mm silicon wafers. Its schematic diagram with basic dimensions is shown in Figure 4.
Electric field under the antenna decreases exponentially towards the wafer [11]. Therefore, in order to measure modulation of optical emission at different distances from the antenna, a periscope, consisting of two 45° parallel elliptical glass mirrors (ThorLabs BBE1-E02) fixed inside the dielectric body, was installed inside the chamber. With it, the observation axis passed 160 mm above the wafer, sensing the areas of plasma with strong electric field. The mirrors have dielectric coating. With the periscope removed, the viewing axis passed 15 mm above the wafer, sensing the areas of plasma with weaker electric field.
Three types of gases were available for the experiments: Argon, neon, and nitrogen. The chamber was pumped out by a turbomolecular pump to a base pressure 0.2 mTorr, after which the gases could be added in a range of pressures between 1 and 100 mTorr. A typical range of electric powers that could sustain plasma discharge at these pressures was 50-500 W.
The scheme of measurements is outline in Figure 5. Its key component is the modulation-sensitive spectrometer 6, which is portayed in Figure 6. Basically, it is a fourier spectrometer, designed for visible domain and described in detail in elsewhere [7]. Its dispersive element is the Michelson interferometer with two corner cube reflectors.
The concept of modulation-sensitive fourier spectroscopy was explained in full detail elsewhere [6]. In traditional Fourier spectroscopy, information about spectrum of light is encoded in modulation of the amplitude of the output electrical signal of the photodetector. Performing the Fourier transform of this signal, it is possible to reconstruct the spectrum. When light is modulated at high frequency, the photodetector signal is combined of two independent components: The so-called static part, containing information only about non-modulated component, and high-frequency part with information about modulated component. These two components can be effectively separated, using the high-frequency lock-in amplifier 6 (Stanford Research Systems, SR844, 200 MHz upper limit). The lock-in amplifier is actually a synchronous detector, requiring reference signal that is strictly in phase with the modulated signal. This reference signal is created by the function generator 7 (Keysight 81150 A, 120 MHz upper limit) that has additional capability of generating phase-locked harmonics of the fundamental harmonic 13.56 MHz at its second output, which is connected to the lock-in amplifier 6. The fundamental harmonic from its first output is used to synchronize the power generator 1 that delivers high-power electrical signal to the antenna on the chamber 2. Thus, modulation of optical emission of plasma and reference electrical signal at the input of the lock-in amplifier 6 are always in phase, making efficient filtering of electrical signal from the spectrometer 5. The output signal of the lock-in amplifier 6 is a slowly varying analog electrical signal, containing information about spectrum of only one modulated optical component, namely the one that is referenced by the signal from the function generator 7. This slowly varying analog electrical signal is converted into digital form and reconstructed digitally in the computer 8 to obtain the spectrum. Thus, choosing the harmonic number at the second output of the function generator 7, it is possible to measure optical spectra of any harmonic of the light, emitted from the chamber 2.
In order to ensure good collection of light, coming out of the chamber, the one-inch plano-convex lens 3 (ThorLabs LA4380) was coupled to the optical fiber bundle 4. Optical diameter of the fiber bundle was 8 mm (customized product from ThorLabs).
High-quality spectral measurements could be obtained only with averaging of many consecutive spectra. Each individual spectral measurement required 3 seconds to complete. Although the total number of averaged spectra was not limited by technical reasons, not more than 100 accumulations were usually made. Thus, the total measurement time was 5 minutes-the interval, during which plasma did not change noticeably, owing to excellent stability of the chamber.
Experimental Results
The entire amount of experimental data obtained on Ar and He at various pressures from 1 mT to 500 mT, and various powers from 20 W to 500 W is summarized in two subsections: Typical spectra of the four first harmonics within spectral interval 400-900 nm, and the effect of chamber conditions.
Typical spectra
Typical spectra are presented for Ar and He for the same experimental conditions: 10 mT pressure and 200 W power. The term «static» used in captions below refers to an ordinary function of the spectrometer, when it measures spectrum of the sum of non-modulated and modulated components. Values of the signal, plotted along the vertical axes as «arbitrary units», have different scales for the static and harmonic spectra: Gains of amplifiers in these two modes of operation are different. Nonetheless, for the harmonic spectra, the vertical scales are the same, which makes it possible to compare strength of various harmonics (Figure 7, Figure 8, Figure 9, Figure 10, Figure 11, Figure 12, Figure 13 and Figure 14).
The second harmonic of helium was its last visible harmonic. All higher harmonics were not visible on the level of noise, as shown in Figure 15.
From the figures above it may be seen that spectra of some harmonics display more noise than the others. The reason for that is not understood yet, may be associated with several factors like high-frequency interference within the lock-in amplifier or plasma noise.
Effect of chamber condition
We found that condition of the chamber strongly affects the spectra of harmonics. For example, Figure 16 and Figure 17 show the spectra of the first and the second harmonics of argon and helium before and after opening the chamber.
In principle, this phenomenon may be used for detecting aging of plasma chambers.
Measurement of Modulation Depth
For measuring the values of modulation depth below 10-4, a very sensitive two-stage technique was developed (Figure 18).
In order to understand it, it must be explained that every single spectral line develops sinusoidal oscillations of light at the output of the scanning Michelson interferometer, depending on the speed of scanning. The frequency of oscillations is a fingerprint of a particular spectral line and scanning speed. Specifically, for the spectrometer used in this work, the spectral line at 750 nm developed oscillations at 355.9 Hz. Therefore, low-frequency electrical signal from a function generator at exactly 355.9 Hz simulates the spectral line 750 nm, measured by the fourier spectrometer. At the first stage of measurements, the amplitude of this low-frequency electrical signal has been adjusted to equalize the amplitude of any chosen spectral line in the static (not modulation-sensitive) mode of the spectrometer (Figure 18a). This adjustment was done by varying the amplitude of electrical signal, using controls on the front panel of the function generator. At the second stage (Figure 18b), the function generator has been switched to high-frequency modulation mode, in which the 13.56 MHz signal was modulated at 355.9 Hz. This modulated electrical signal, being connected to the lock-in amplifier, simulated the modulated spectrum at the same spectral line 750 nm. However, the minimum resolvable amplitude that the function generator could provide (on the scale of millivolts) was orders of magnitude higher than real signal from the spectrometer. Therefore, in order to equalized them, and additional variable attenuator was used. Thus, adjusting the amplitude of electrical modulation at the output of the function generator, it was possible to equalize the amplitudes of both the real and simulated modulated spectra. Comparing these electrical amplitudes-adjusted at the first and second stages-it was possible to estimate the modulation depth of a particular spectral line. With this technique, as small modulations as 10-6 were measured and the conclusion was made that in all cases, described in the section 4, the depth of modulation was in the interval 10-2-10-6.
Discussion
According to general physical phenomenology of inductively coupled plasma, its optical emission is expected to be modulated at the fundamental excitation frequency and its harmonics. For gases with low ionization energies, like hydrogen, oxygen, and krypton, this modulation is quite observable with standard phase-resolved spectroscopic techniques. For other gases, like argon, neon, and nitrogen, the modulation is very weak-below capabilities of standard spectrometers. To experimentally explore this problem, a new technique was developed for measuring modulated components of plasma optical emission at high frequencies up to 100 MHz. In it, a Fourier transform spectrometer with high-frequency photodetector is connected to a lock-in amplifier to select any specific harmonic. Using this technique, not only modulation of certain spectral lines of argon and helium was measured at excitation frequency 13.56 MHz and its harmonics, but the entire spectra of modulated components were measured within spectral interval 400-900 nm. The modulation depth turned out to be very low: from several percents to 10-6. It was found that not each spectral line of the traditional spectra of these gases is modulated: There are certain lines that are modulated dominantly, for instance 750 nm of Ar and 670 nm and 707 nm of He. Also, it turned out to be the rule that the odd harmonics are modulated weaker than the even ones. It was also the finding of this work that modulated spectra strongly depend on conditions of the chamber: Both the specific set of spectral lines that are modulated and their modulation depth. A comprehensive explanation to all these phenomena cannot be suggested at the moment, hoping that further experimental and theoretical studies may shed additional light on it.
Acknowledgements
The plasma chamber, at which the experiments were done, was professionally operated by Dr. V Pashkovskiy, with whom the author had numerous deep scientific discussions of plasma physics and who turned the author's attention to some specific publications in this area. Some mechanical parts were designed by Hoonseop Kim, who also supervised purchasing of necessary equipment. Also, this work could not be done without support and attention of Caleb Yang and Kuyhee Han, to whom the author addresses deep appreciation.