
International Journal of Astronautics and Aeronautical Engineering
(ISSN: 2631-5009)
Volume 2, Issue 2
Research Article
DOI: 10.35840/2631-5009/7511

Article Formats
Design and Testing of a Cooling Fan for Electro-Mechanical Actuators for Aerospace Applications
Table of Content
Figures
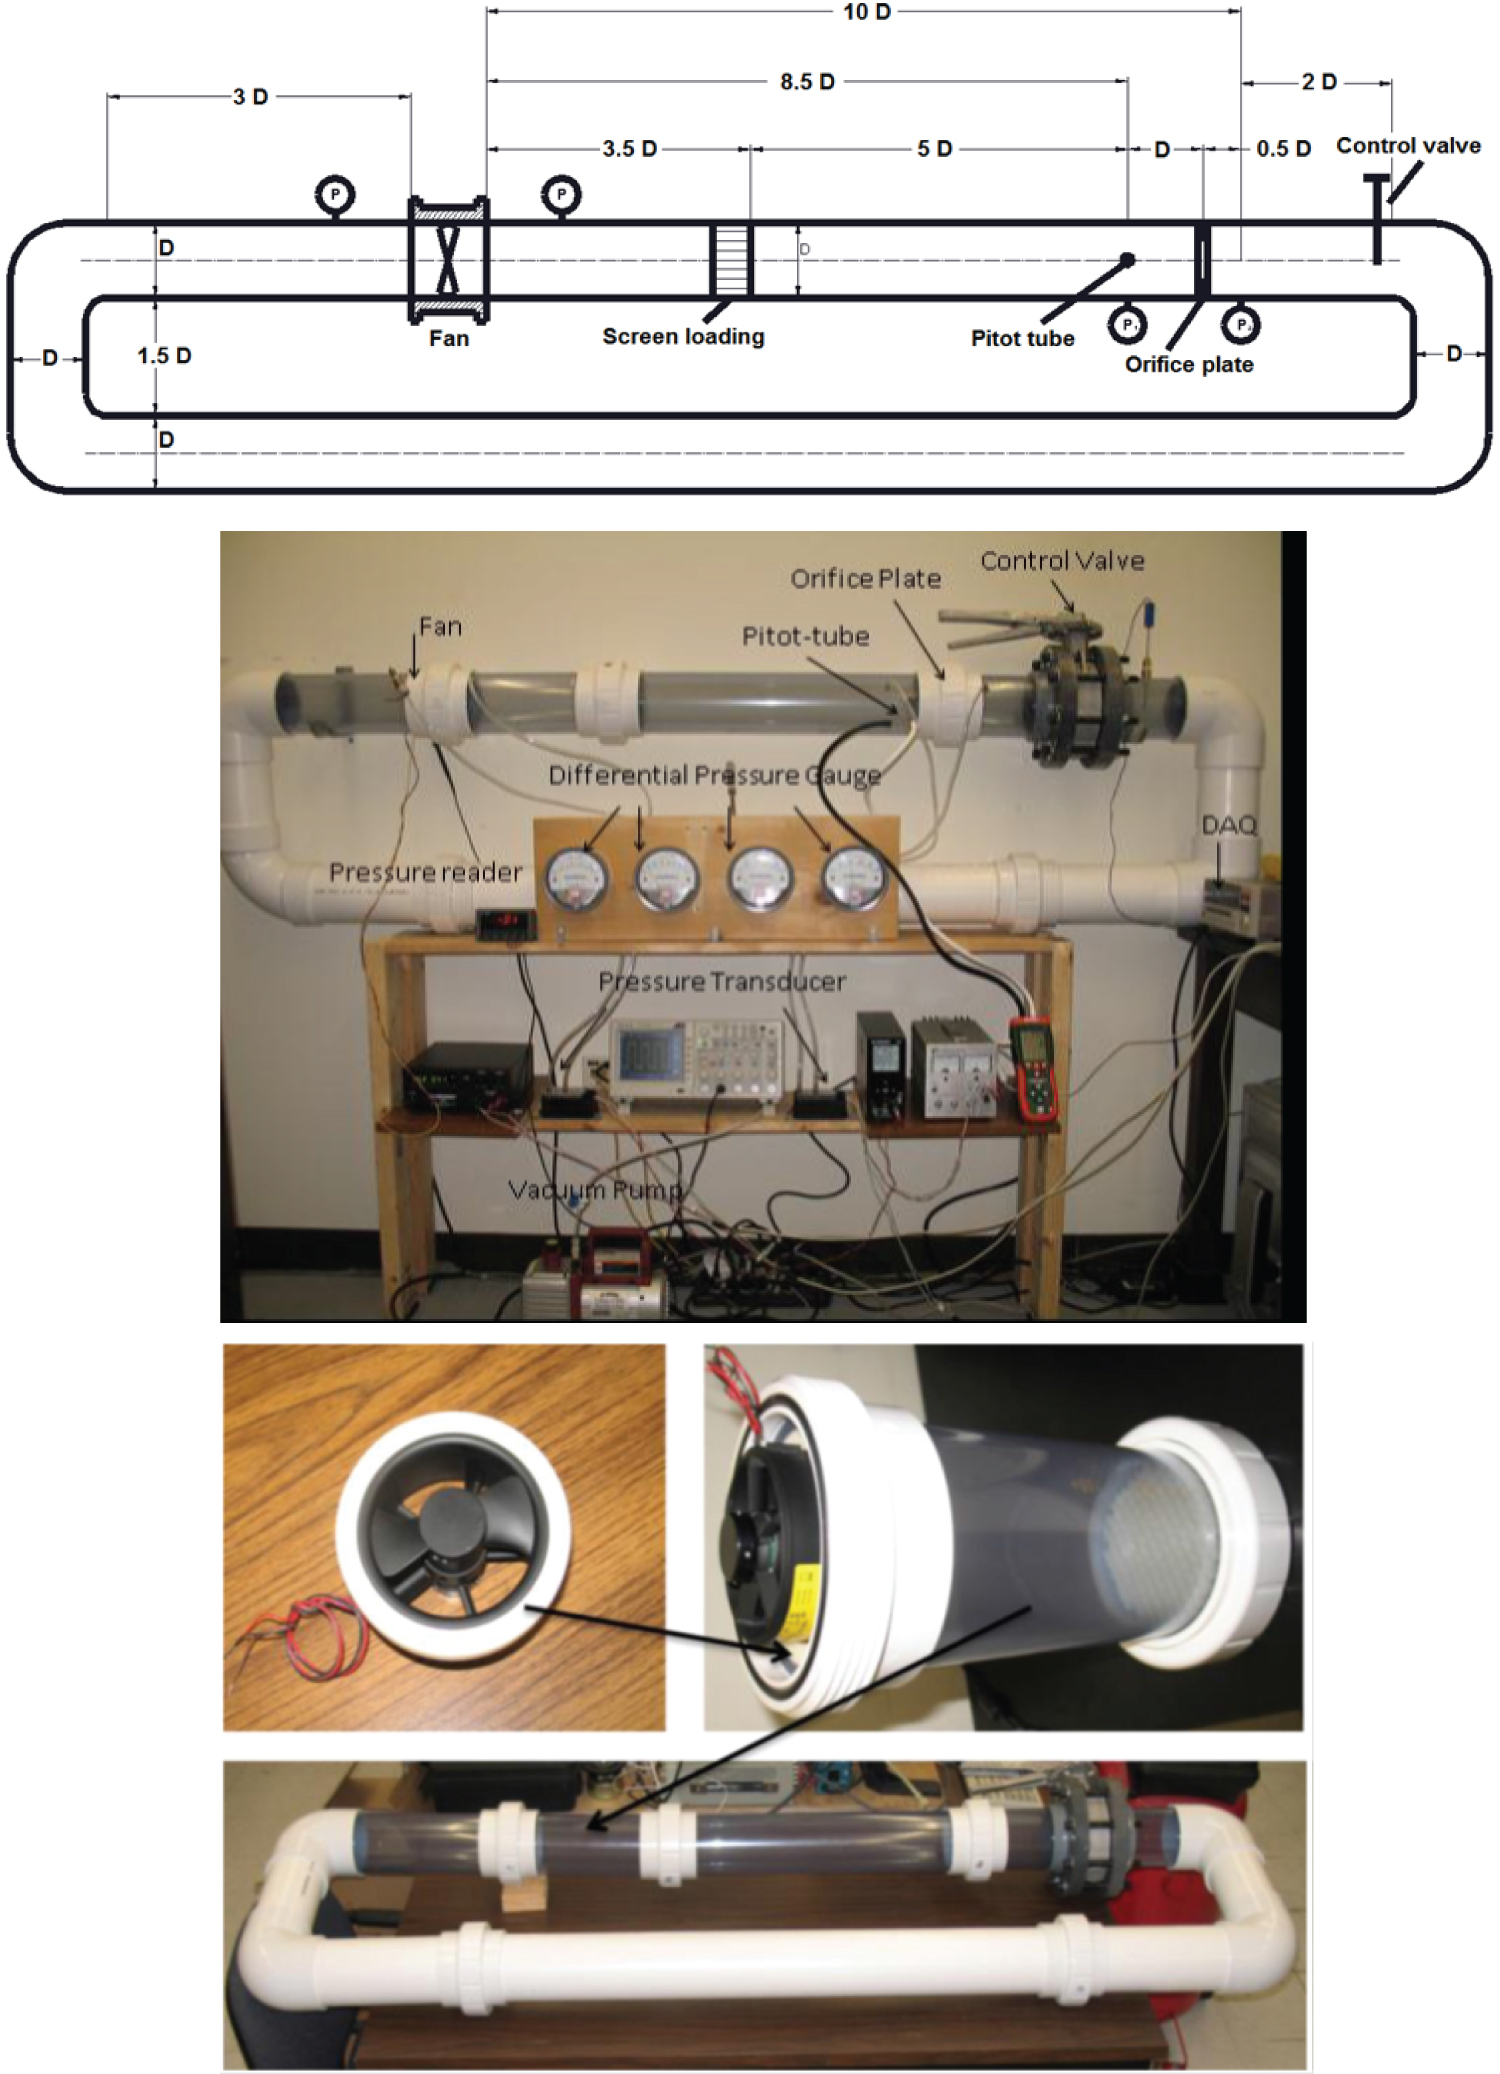
Figure 1: a) Schematic of the Fan test...
a) Schematic of the Fan test loop; b) Fan test loop with instrumentation; c) Fan holder and flow straightener.
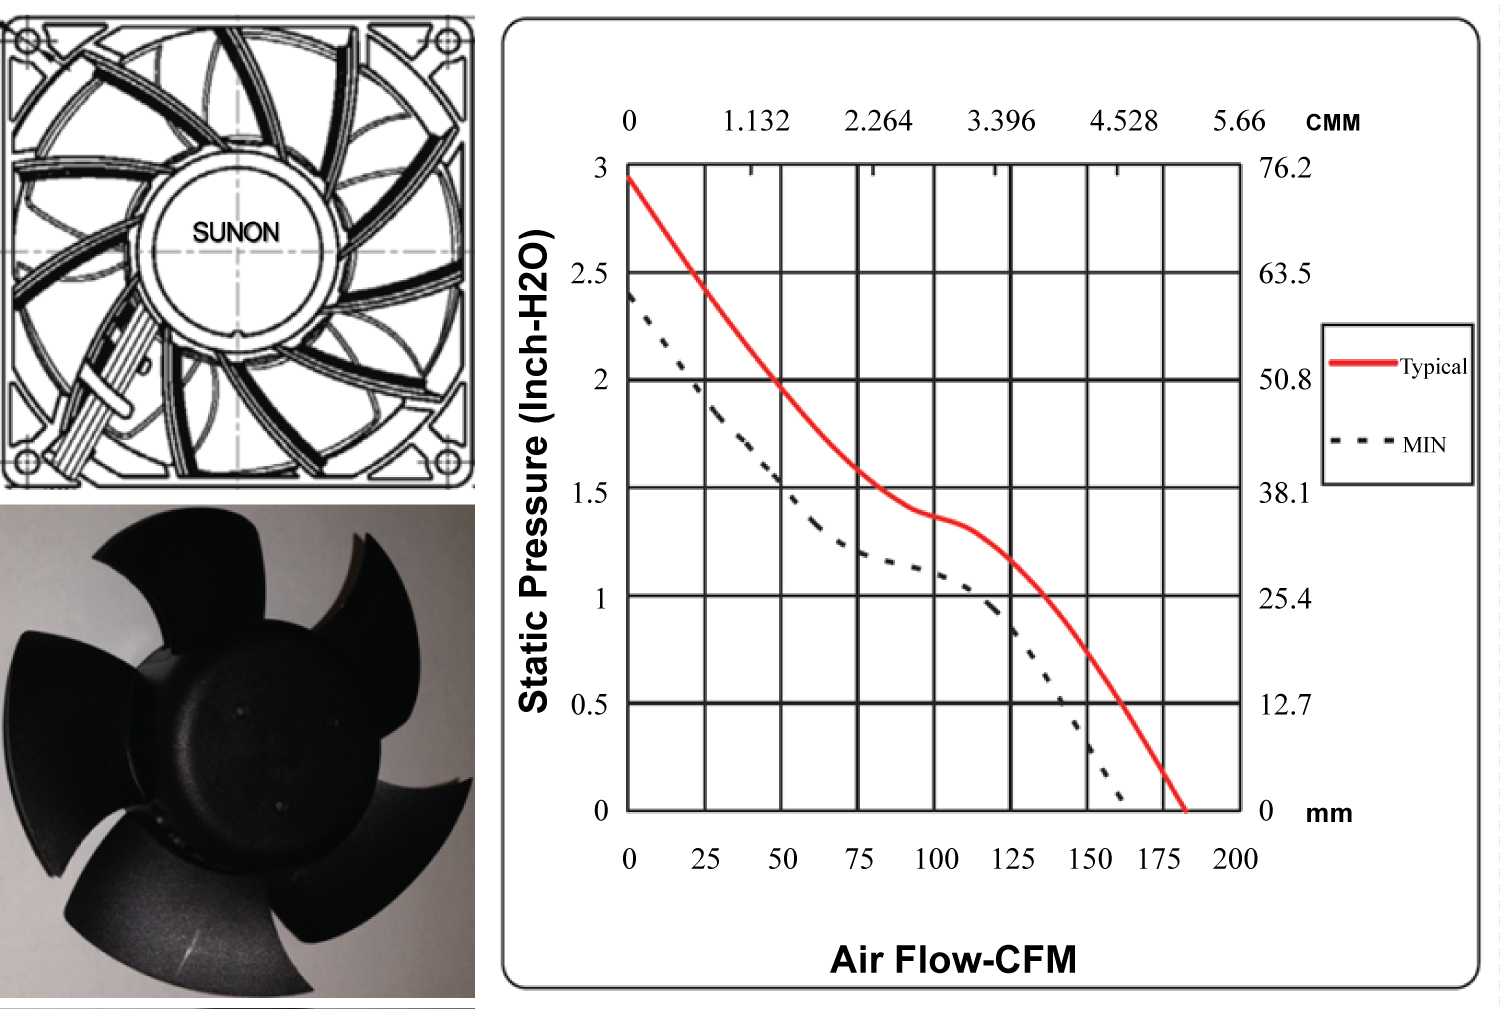
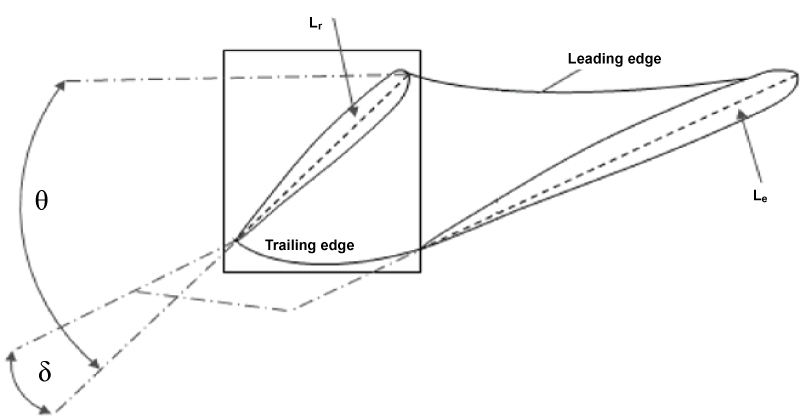
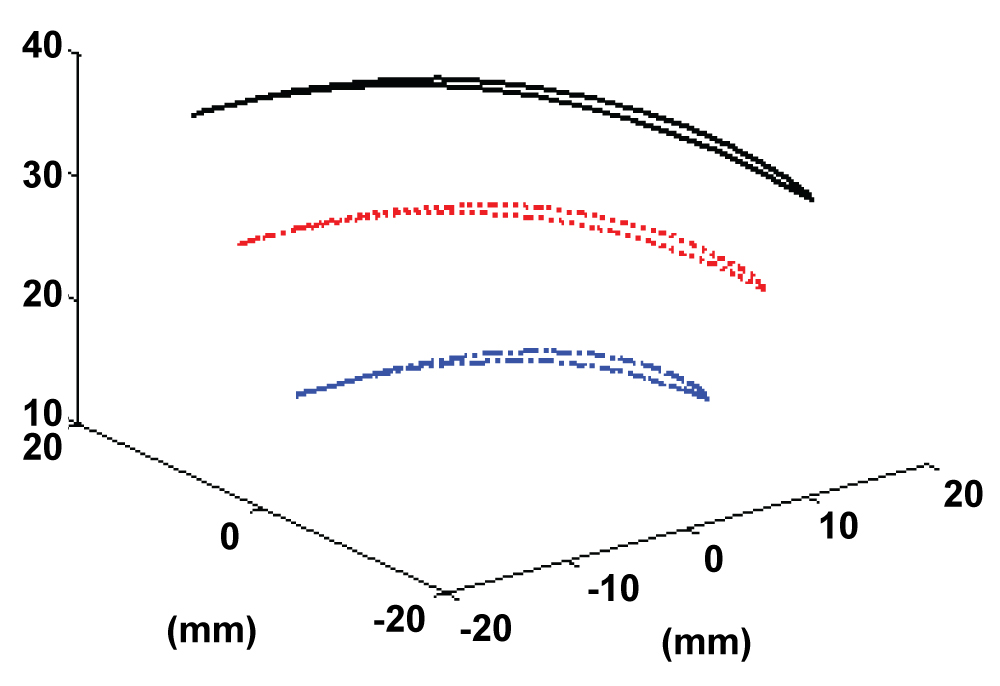
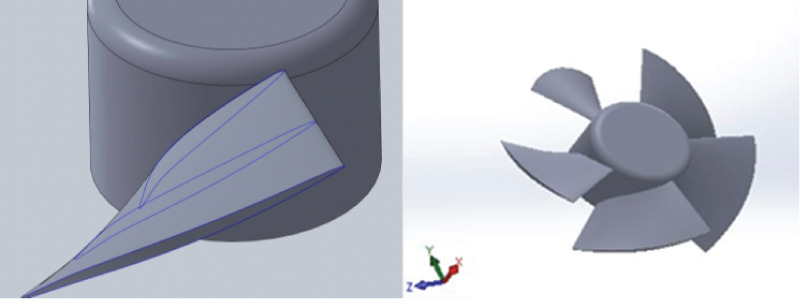
Figure 5: Drawing of the preliminary design...
Drawing of the preliminary design of the blades attached to the fan hub.
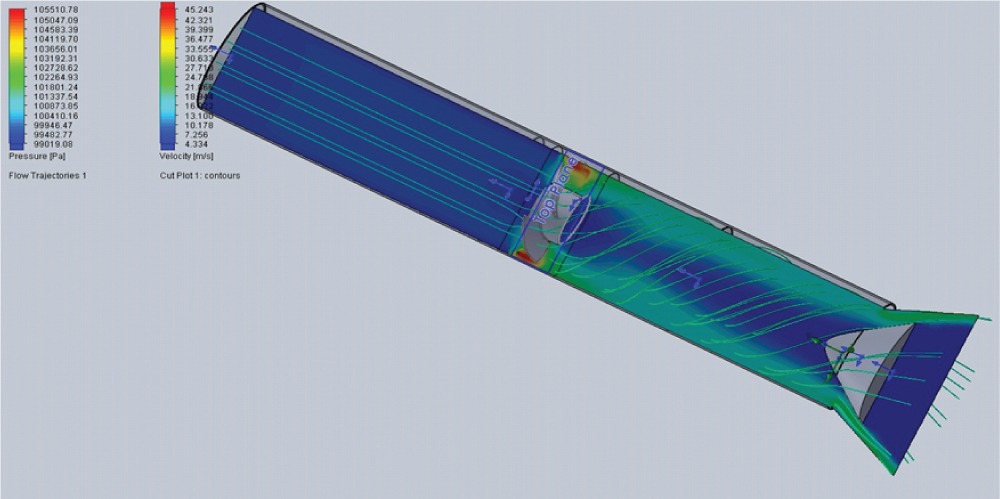
Figure 6: Velocity contours and streamlines...
Velocity contours and streamlines in the computational domain.
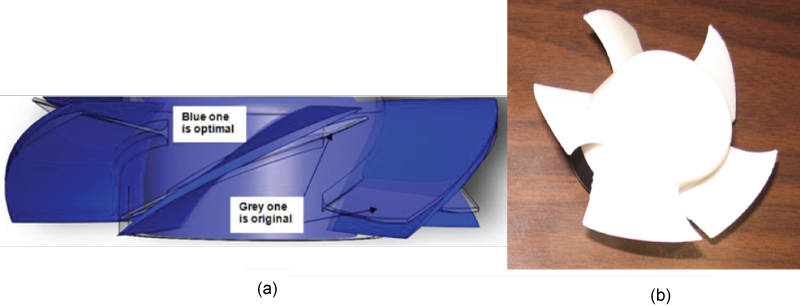
Figure 7: a) Preliminary and optimized blade...
a) Preliminary and optimized blade design; b) 3-D printing of the designed fan.

Figure 8: Measured Sunon fan curves at...
Measured Sunon fan curves at different rotational speed and different ambient pressure.
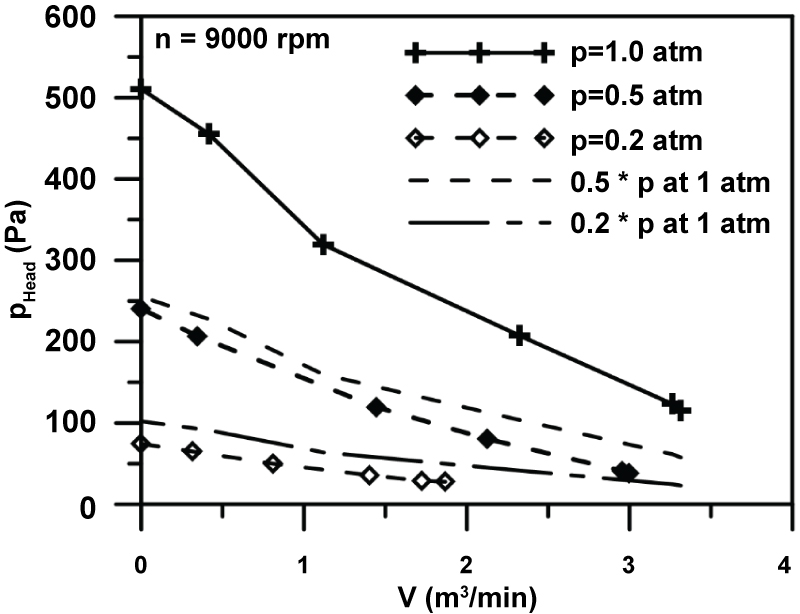
Figure 9: Comparison between scaled and measured...
Comparison between scaled and measured curves of Sunon fan at n = 9000 rpm.
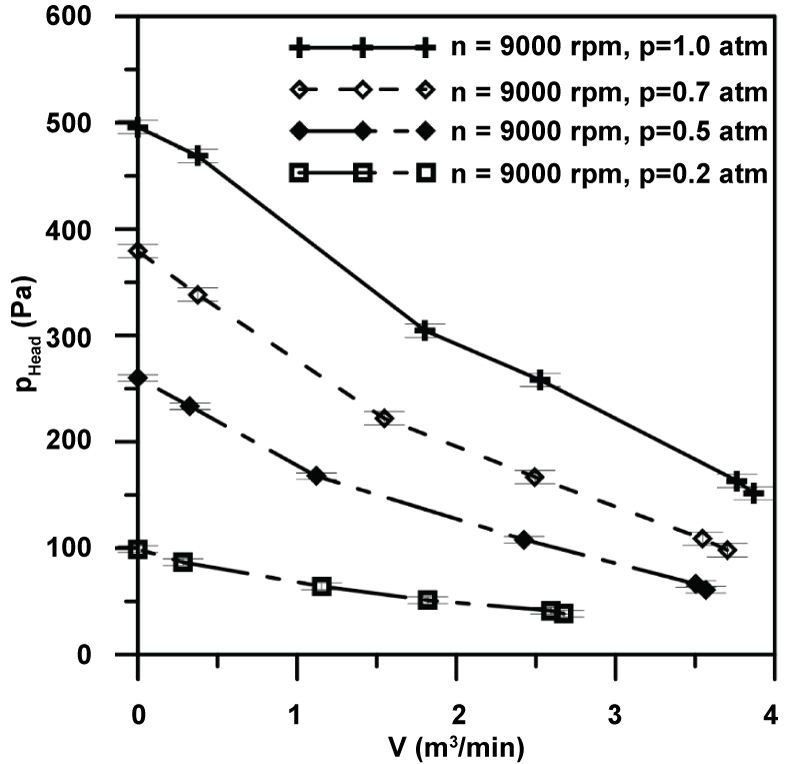
Figure 10: Measured curves of the designed...
Measured curves of the designed fan at different ambient pressure and 9000 rpm.
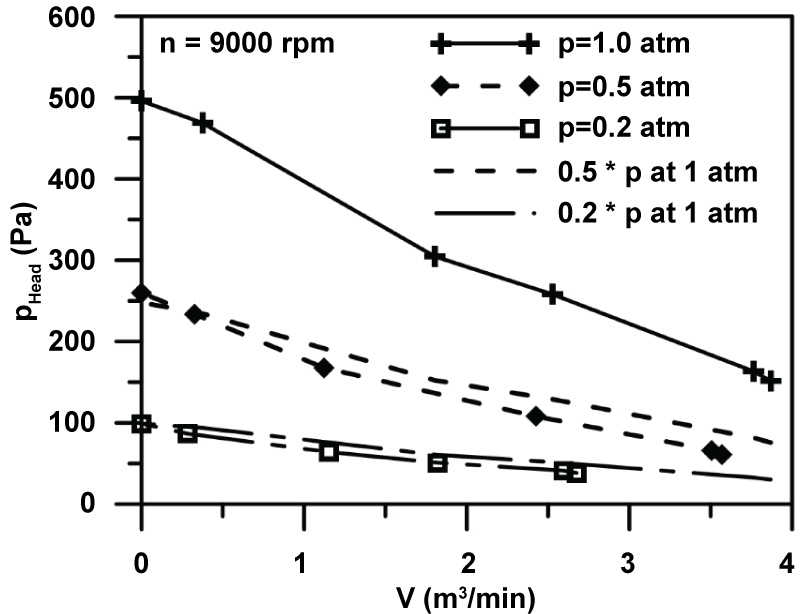
Figure 11: Comparison between scaled and ...
Comparison between scaled and measured curves of the designed fan at n = 9000 rpm.
Figure 12: Sunon and designed...
Sunon and designed fan performance at ambient pressures of 0.2 atm and 1 atm.
Tables
Table 1: Estimated errors.
Table 2: Hydraulic losses estimate.
Table 3: Commercial fans.
Table 4: Variables for various fan blades considered in this work.
Table 5: The variable combinations considered in the optimization process.
References
- D Woodburn, T Wu, L Zhou, Y Hu, YR Lin, et al. (2014) Dynamic heat generation modeling of high performance electromechanical actuator. IEEE Transactions on Aerospace and Electronic Systems 50: 530-541.
- K McCarthy, A Heltzel, E Walters, J Roach, S Iden, et al. (2010) A reduced-order enclosure radiation modeling technique for aircraft actuators. SAE Power Systems Conference.
- YR Lin, Y Hu, L Zhou, D Woodburn, T Wu, et al. (2012) A reduced-order model for electromechanical actuator. SAE Power Systems Conference.
- JH Zhou, CX Yang (2010) Parametric design and numerical simulation of the axial-flow fan for electronic devices. IEEE Transactions on Components and Packaging Technologies 33: 287-298.
- JH Zhou, CX Yang (2008) Design and Simulation of the CPU Fan and Heat Sinks. IEEE Transactions on Components and Packaging Technologies 31: 890-903.
- MF Holahan (2005) Fins, fans, and form: Volumetric limits to air-side heat sink performance. IEEE Transactions on Components and Packaging Technologies 28: 255-262.
- W Wu, Y Lin, L Chow, Q Leland (2014) Fan performance characteristics at various rotational speeds and ambient pressures. SAE Technical Paper.
- W Wu, Y Lin, L Chow, E Gyasi, JP Kizito, et al. (2017) Electromechanical actuator fan failure analysis and safety-critical design. IEEE A&E Systems Magazine 32: 18-25.
- ISO 5801 (2007) Industrial fans -Performance testing using standardized airways. International Organization for Standardization.
- PG Kiselev (1972) Hand-Book on Hydraulic Calculations. Energy 312, Moscow.
- E Idelchik (1975) Hand-Book on Hydraulic Resistances. Machinery 560, Moscow.
- M Turner (1996) All you need to know about fans, Electronics Cooling.
- B Eck (1973) Fans: Design and operation of centrifugal, axial-flow and cross-flow fans. Pergamon Press, New York.
- http://airfoiltools.com.
- Star CCM + user's manual, Cd Adapco Inc.
- TL Bergman, AS Lavine, FP Incropera, DP Dewitt (2011) Fundamentals of heat and mass transfer. (7th edn), John Wiley & Sons.
Author Details
W Wu1, YR Lin1, O Mesalhy1,2, JP Kizito3, QH Leland4 and LC Chow1*
1Department of Mechanical and Aerospace Engineering, University of Central Florida, USA
2Department of Mechanical Power Engineering, Zagazig University, Egypt
3Department of Mechanical Engineering, North Carolina Agricultural and Technological State University, USA
4Power and Control Division, Aerospace Systems Directorate, Air Force Research Laboratory, USA
Corresponding author
LC Chow, School of Engineering, Australian College of Kuwait, Mishref, Kuwait, E-mail: louis.chow@ucf.edu
Accepted: October 11, 2017 | Published Online: October 13, 2017
Citation: Wu W, Lin YR, Mesalhy O, Kizito JP, Leland QH, et al. (2017) Design and Testing of a Cooling Fan for Electro-Mechanical Actuators for Aerospace Applications. Int J Astronaut Aeronautical Eng 2:011.
Copyright: © 2017 Wu W, et al. This is an open-access article distributed under the terms of the Creative Commons Attribution License, which permits unrestricted use, distribution, and reproduction in any medium, provided the original author and source are credited.
Abstract
Air cooling with wing bay air circulated by axial flow fans is the most suitable and viable way in cooling aircraft Electro-mechanical Actuators (EMAs) used for flight control surfaces. The main objective of the cooling fan is to deliver high static pressure head and high volumetric flow rate overall operating ambient conditions (ambient pressure from 0.2 to 1 atm). In this paper, a preliminary axial flow fan design is first established with the size restriction to fit in the wing bay (diameter of fan is 86 mm). This design is then optimized by conducting a parametric CFD simulation to study the effect of changing the fan blade cord length and blade setting angle. The optimized design is 3D printed and mounted on the motor of a commercially available fan made by Sunon. Both the designed and Sunon fans are tested in a fan loop that has been designed and constructed following the ISO standards. The volume flow rate and the static pressure head are measured at different ambient pressures and different fan rotating speeds. Comparing the performance of the two fans, it is found that the designed fan produces higher pressure head at all ambient pressures. This means that for the same system friction curve, the designed fan can deliver more volume flow rate for cooling purpose. In addition, it is found that the designed fan follows accurately the fan scaling laws when it is working under different ambient pressures.
Introduction
In recent years, attention has been focused on switching from hydraulic actuator to electro mechanical actuators in aerospace applications. Electro-mechanical actuators (EMAs) have the advantages of lower weight, higher performance, and lower maintenance cost. But due to the high power density of the motors and power electronics devices they are prone to overheating. So, it is critical to manage the waste heat generated by electromechanical actuation systems.
Failure to properly dissipate the waste heat generated by aircraft EMAs and other electronic devices during all flight missions can lead to catastrophic failures of aircraft [1]. Fans can remove waste heat from the aircraft EMAs components and transport the heat to the entire bay surfaces. The entire bay surfaces area can act as a heat sink, thus avoiding the need to mount a condenser or cold plate to the bay wall. The EMAs waste heat is generated at the motor, associated control electronics (E-box), gear box, and drive train. The major heat generation source is the motor and it has fins and a cooling fan attached. The fan is structurally integrated with the motor, but is powered and controlled independently with temperature sensors so that the fan is turned on whenever a certain temperature of the actuator is exceeded [2,3]. The drive train and gear box are cooled by recirculating air within the bay. Enclosing the fins with an outer shell creates an annular duct for air to pass through. This way the forced air produced by the fan can move through the annular duct at a high velocity and creating effective heat transfer.
The fans used to move the air are either axial or perpendicular (centrifugal) to the rotational axis. Centrifugal fans tend to deliver air in a direction that is perpendicular to the rotational axis with high pressure but at a relatively low flow rate. Axial flow fans can deliver a high flow rate, but tend to work with low static pressure head. Axial fan is preferred in EMAs and other electronic devices cooling on aircraft due to their high flow rate and compact size and light weight. There are progresses to improve the axial fan blade design and cooling performance using CFD simulations. Zhou, et al. [4,5] studied axial fan blades to enhance greatly fan design efficiency. Their methods are based on the procedure of the parametric design and numerical simulation, the influences of various design parameters on the aerodynamic performance of the fan. Holahan [6] proposed to use method to identify "fin-fan combinations" to achieve maximum system volumetric conductance levels. The methodology is extendable to other volumetrically constrained "fin-fan" problems with numerical methods.
Scaling laws can be used to predict the fan performance under different speeds and ambient pressures [7]. Although fans may not be reliable enough for cooling aircraft EMAs, it was found that using dual-fans can reduce the failure probability in one hour of flight from 10-5 to 10-9 without adding heavy weight and high cost [8]. To the best of our knowledge, there are no documented literatures on design of high speed axial fan working effectively at a low pressure environment of 0.2 atm.
In this study, an up-to-date Sunon fan that can fit in a wing bay which limits it to < 90 mm in diameter, is 0 the fan characteristic curve at different rotational speeds and different ambient pressures. Then, newly improved axial fan blades are designed and installed on the motor of the original Sunon fan. The new designed fan is tested in the same loop and compared with the original one.
Experimental Test Loop Design
For measuring fan static pressure head, volume flow rate, and rotational speed at different ambient pressure environment, a fan test loop was assembled and equipped with the required instrumentation. The test loop, shown in Figure 1a and Figure 1b, was designed according to the ISO (International Organization for Standardization) 5801 standard [9]. The test loop was built with two types of PVC materials. The entire loop is about 6 meters long and has an inner diameter 0.1 meter throughout to avoid hydraulic expansion and contraction losses. One material is a white PVC pipe which can hold pressure up to 1500 kPa at 23 ℃. The second material is a transparent PVC pipe which can hold the pressure up to 760 kPa at 23 ℃. Both pipes can handle temperature up to 60 ℃. A fan, control valve and screen loading are inserted inside the test loop. The screen loading (or flow straightener) is used to eliminate the swirl produced by the axial fan. The screen loading, shown Figure 1c, consists of square cells of equal size, and is fabricated with a 3-D printer. The flow straightener has a very low pressure loss. The overall system flow resistance is dominated by the control valve which is used to vary the volume flow rate.
The loop is equipped with two different types of pressure measurement instruments. One is the Dwyer Magnehelic's differential pressure gauge. The gauge has an accuracy of 2% of full scale. To ensure adequate accuracy, Dwyer Magnehelic's differential pressure gauges with four different ranges are used. These gauges are used for the convenience of obtaining direct readings of the pressure differentials. They are also used to compare with the pressure differentials measured with the electrical pressure transducers (Setra's 264 series). The transducers are connected to a 24-V power supply and have voltages in the range of 0.05 V to 5.05 V DC as output signals. The accuracy of all the differential pressure transducers is 0.25% of their full scales which is 8 times more accurate than that of Dwyer Magnehelic direct reading gauges. For accuracy over a wide range of volume flow rate, we also use 5 pressure differential ranges for the pressure transducers, 0-250, 0-625 and 0-1250 Pa. The pressure transducers are connected to a Data Acquisition (DAQ) system through a personal computer in order to obtain and record the data. The fan rotating speed is measured by a sensor embedded in the fan, and is recorded by the DAQ as well. An oscilloscope is connected to the sensor so the rotational speed can also be monitored visually. The power supplied to the fan is recorded. The DAQ system is a Keithley 2700 series (6½-digit, 22-bit resolution) with a switch board inside. The rotational speeds were carefully controlled by adjusting the voltage from the power supply. A vacuum pump is used to evacuate the air inside of the test loop and maintain the pressure inside the loop at 0.7, 0.5 and 0.2 atm. Based on the utilized instruments and their measuring ranges, the uncertainties in the measurements of static pressure head and volume flow rate are estimated. These uncertainties are shown in Table 1.
Hydraulic losses estimate
The fan test loop can work under normal ambient pressure (1 atm) and sub-ambient pressure (down to ∼0.2 atm). The flow resistance inside the duct has been considered and calculated as shown in Table 2. The pressure drop is 32 Pa at 1 atm with a 3 m3/min volume flow rate, and 32 Pa at 0.2 atm with a 6 m3/min volume flow rate by using following references [10,11].
Where,
ρ: Air density (proportional to pressure if temperature is constant)
U: Flow speed
D: Duct diameter
μ: Dynamic viscosity (1.7 × 10⁻⁵ kg/m-s @ 20 ℃)
k: Duct surface roughness (∼7 × 10⁻⁶ m)
L: Total length of loop (∼6 m).
Experimental procedure
All the measurements were conducted three times and the averaged data were reported. The fan static pressure was measured by the differential pressure transducer; the volume flow rate was measured by obtaining the velocity distribution at a suitable cross-section of the flow loop with a Pitot-tube anemometer.
Experiments were carried out at different fan rotational speeds with the pressure inside the loop kept at 1, 0.7, 0.5, and 0.2 atmospheres. The rotational speed varies from 6000 to 12000 rpm. These rotational speeds were carefully controlled by adjusting the voltage from the power supply. Each fan curve was obtained by carefully adjusting the flow control valve to change the overall flow resistance inside the fan test loop.
Fan Scaling Laws
The scaling laws of fans express basic relationships among the variables of fan static pressure head, volume flow rate, air density, rotational speed, fan diameter, and power. These relationships make it possible to compare the performance of geometrically similar fans in dissimilar conditions. The fan laws were derived from dimensionless analysis of the equations for volumetric flow rate, static pressure head, and power as a function of fan diameter, air density and rotational speed. It is best to select a fan that will give an operating point toward the high flow, low pressure end of the performance curve to maintain fan blade efficiency and avoid fan blade stall. Fans can be characterized by the following equations:
Volumetric flow rate:
Q = kQnd3 (4)
Static pressure head:
p = kpρn2d2 (5)
Power:
P = kpρn3d5 (6)
kQ,p,P: Constants for geometrically and dynamically similar operation
n: Fan speed in rpm
d: Fan diameter
ρ: Air density (air density is proportional to the ambient pressure when the temperature is constant)
From these relationships, it is possible to calculate a fan performance at a second condition compared to a baseline condition [12].
Fan Motor Selection
An existing fan motor is selected based on the rotating speed range and the size requirements of the experimental test rig and the wing bay. The fan motor from the Sunon PF92381 fan fits the requirements. Sunon fan is picked out of three state-of-the-art commercial fans: Sunon, abmpapst and Delta. The selection is based on the size, voltage-rating, rpm, air flow, static pressure and availability. All the fans have a frontal area of 92 mm × 92 mm, and run at 12 V. It is desirable to have a motor that can run at a high rpm (13,000 rpm). As shown in Table 3, Sunon fan has the highest pressure head compared to the other two fans. Figure 2 shows the Sunon PF92381 fan and its characteristic curve. The minimum operating voltage is 10.2 V (the black dashed line). Normally, the fan is operated at 12 V which is the red solid line shown in Figure 2.
The fan blades can be removed from the motor and replaced with any fan blade design. The above consideration imposes a constraint on the blade design. The hub should have thickness of 25 mm and a diameter of 45 mm. To fit within the housing of the Sunon fan, the diameter of the designed fan blade should equal to 86 mm.
Preliminary Fan Blade Design
Figure 3 illustrates the definition of the fan blade geometry where, Lr is the cord length at the hub, Le is the cord length at the blade tip, θ is the blade setting angle, and δ is the blade twist angle. As a starting point for the new design, we choose the number of blades as 5, which is similar to the Sunon fan. The number of blades can be changed later if necessary after completing the optimal 5-blade design. The Sunon fan blade has wide chords and it can generate high volume flow rate at a given rotational speed. Choosing a desired static pressure, volume flow rate, rotational speed, and working within the size constraints mentioned above (hub height = 25.4 mm, hub diameter = 48 mm, and fan diameter-86 mm), we follow the fan blade design guidelines of Eck [13].
For a typical EMA cooling application, we choose the following requirements for the fan desired working point (rotational speed n = 220 rev/s; pressure head H = 20.4 m of air column, volumetric flow rate V = 0.1 m3/s). For an axial-flow fan without inlet guide vanes, the velocity function coefficient σ is calculated as follows [13]:
Based on the value of σ, the pressure coefficient ψ and flow coefficient φ are defined from [13]. Then the blade speed, cord length, and blade setting angle are calculated at three sections along the blade span (hub, middle, and tip). NACA airfoil (65A-010) [14] is used as the blade profile. After the calculations, three main curves have been generated to form the single blade by geometry projection using Matlab. Figure 4 shows the three basic main curves of the 86-mm diameter fan. Here the blue, red and black curves are the root, middle and tip curves of the blade profile, respectively.
After generating the blade from the 3 main curves, the blade shape is exported to SolidWorks (SWx), repeated and attached to the hub to form the designed fan. Figure 5 shows the drawing from SWx of the blades which were generated in MATLAB attached to the fan hub.
Blade Design Optimization Using CFD Simulation
After obtaining the preliminary fan blade profile as described in the previous section, a CFD simulation is performed for the designed fan to test its performance. The designed fan blades are assumed to sit in an 88 mm diameter tube equipped with a cone-shape valve to control the volume flow rate. The computational geometry is imported into the CFD code, STAR-CCM+ [15] where the grid is generated and the flow model is selected. The grid has been refined near the rotor region to accurately predict the physical phenomena in that specific portion. The flow is considered to be incompressible and turbulent. After solution convergence, the values of the fan volume flow rate and the fan pressure head are obtained from the numerical solution. Figure 6 shows the flow streamlines and the velocity contours in the computational domain when the fan rotates at 13,200 rpm.
By changing the opening of cone-shape valve from 0 to 100%, the fan curve can be obtained. The results of the numerical simulation are used to optimize the fan design to produce higher volume flow rate and high pressure head. Several design parameters are changed. These parameters include: Blade setting angle (θ), cord length at the hub (Lr), and cord length at the blade tip (Le). Table 4 and Table 5 show the preliminary and optimized fan blade parameters and the variable combinations considered in the optimization process. First, Lr and Le are fixed at 24.5 mm and 39.0 mm, respectively while the setting angle is varied from 22-32 degrees. Then the blade root and end chords are fixed at 24.5 mm and 39.2 mm, respectively and the setting angle is varied from 22-32 degree and so on.
Figure 7a shows the preliminary and the optimized blade shapes. It is found, as shown in Table 4, that the blade with (θ = 29.5°, Lr = 25.2 mm, and Le = 41 mm) produces a higher maximum pressure head. After completing the blade design optimization, the optimized fan design is 3-D printed as shown in Figure 7b. This 3-D printed fan is mounted on a separate Sunon fan motor and is tested in the test loop.
Experimental Results
Sunon fan testing
First, experiments were carried out to test Sunon fan in our closed flow loop at a rotational speed ranging from 6,000-12000 rpm with the ambient pressure inside the loop ranging from 0.2-1 atmosphere. The rotational speeds were carefully controlled by adjusting the voltage from the power supply. At each rotational speed, a fan curve was produced by measuring the pressure head (pHead) and the velocity distribution inside the flow loop to determine the volume flow rate (V) produced by the fan. The volumetric flow rate can be controlled independently by adjusting the control valve which determines the overall flow resistance of the loop. The uncertainties in the pressure head and volume flow rates are given earlier in Table 1. The fan curves at rotational speeds 6000, 9000, and 12000 rpm atdifferent ambient pressures are shown in Figure 8. In the case of n = 6000 rpm, it was difficult to obtain the fan curve at p = 0.2 atm because the percentage of error in measuring static pressure head was high.
To check the accuracy of the fan scaling laws, the performance curves at low ambient pressures can be compared with the scaled curve at ambient pressure 1 atm. Figure 9 shows the comparison between the scaled fan curves at 0.2 and 0.5 atm with the measured data at the corresponding ambient pressures. The figure shows that the scaling laws can be used to accurately predict the fan curve at different ambient pressures.
As shown from the data, it can be seen that both the fan pressure head and the flow rate decrease significantly during the fan operation at low pressure environment. In aerospace applications, the fan often operates at high altitude (40,000 ft) where the ambient pressure is about 0.2 atm and the ambient temperature is about -56 ℃. The relationship between forced convection heat transfer between a heat generating component and the ambient air at high altitude and one atmospheric pressure is given as [16]:
Where QA is the heat carried away at high altitude and Q0 is the heat carried away by air at sea level. The exponent n typically ranges from 0.5 to 0.8 based on the flow type: Laminar or turbulent. At high altitude, the low ambient temperature offers an advantage of having a higher temperature difference but the lower density at such high altitude usually leads to a reduction in QA/Q0 at the same RPM. This means that, air cooling in an aerospace environment needs new fan designs that can provide higher pressure head and consequently higher flow rate when it is operated in a low pressure environment. The design is often constrained by stringent mass and volume requirements.
Experimental results for the optimized fan
The 3-D printing of the optimized blades are mounted on the motor of the original Sunon fan and tested in the closed flow loop at a rotational speed 9,000 rpm and ambient pressures from 0.2-1 atm. At each case, a fan curve is produced by measuring the pressures and velocity distributions inside the flow loop. The volumetric flow rate is controlled independently by adjusting the control valve. The fan curves at these ambient pressures are shown in Figure 10. By scaling the fan curve at p = 1 atm, the data show that the designed fan follows the scaling laws when it is operated at different ambient pressures. This can be seen by comparing the fan curves at pressure 0.2 and 0.5 atm with the scaled fan ones from the curve at pressure 1 atm as shown in Figure 11.
The performance of the optimized designed fan is compared with the original Sunon fan at low and atmospheric pressures at the same rotational speed, 9000 rpm. The results are shown in Figure 12. It can be seen that the new optimized fan design generally performs significantly better than the original Sunon fan when it is working in low pressure environment (0.2 atm). At atmospheric pressure, the designed fan produces a higher pressure head than the Sunon fan except in the low volume flow rate region. Since the operating point of axial flow fans usually lies in the high volume flow rate region, the new design of the fan can deliver higher volume flow rate for cooling of aircraft Electro Mechanical Actuators compared to the state-of-the-art Sunon fan at all ambient pressures.
Conclusions
In this paper, the fan design procedure described in Eck textbook has been followed to obtain a preliminary design of a 5 blade axial fan to cool aircraft EMAs using the same dimensions of the Sunon fan. The preliminary design is optimized by conducting a parametric study using CFD simulation to check the effect of changing the blade cord length and setting angle on fan performance. A fan loop test rig is designed and constructed based on ISO standards to measure the fan curve under different operating conditions of ambient pressure and fan rotating speed. Both the Sunon and a 3-D printing of the optimized fan design are tested in the fan loop. It is found that both fans follow the scaling laws and the optimized design performs better than the Sunonfan at all ambient pressures between 0.2 and 1 atm.
Acknowledgements
This research is sponsored by Air Force Research Laboratory via a subcontract with UDRI, Inc., under agreement FA8650-12-2224/0002. The U.S. Government is authorized to reproduce and distribute reprints for Governmental purposes notwithstanding any copyright notation there on.