International Journal of Astronautics and Aeronautical Engineering
(ISSN: 2631-5009)
Volume 3, Issue 1
Research Article
DOI: 10.35840/2631-5009/7515

Article Formats
Numerical Study of Virus Droplet Transport in Civil Aircraft Cabin
Table of Content
Figures
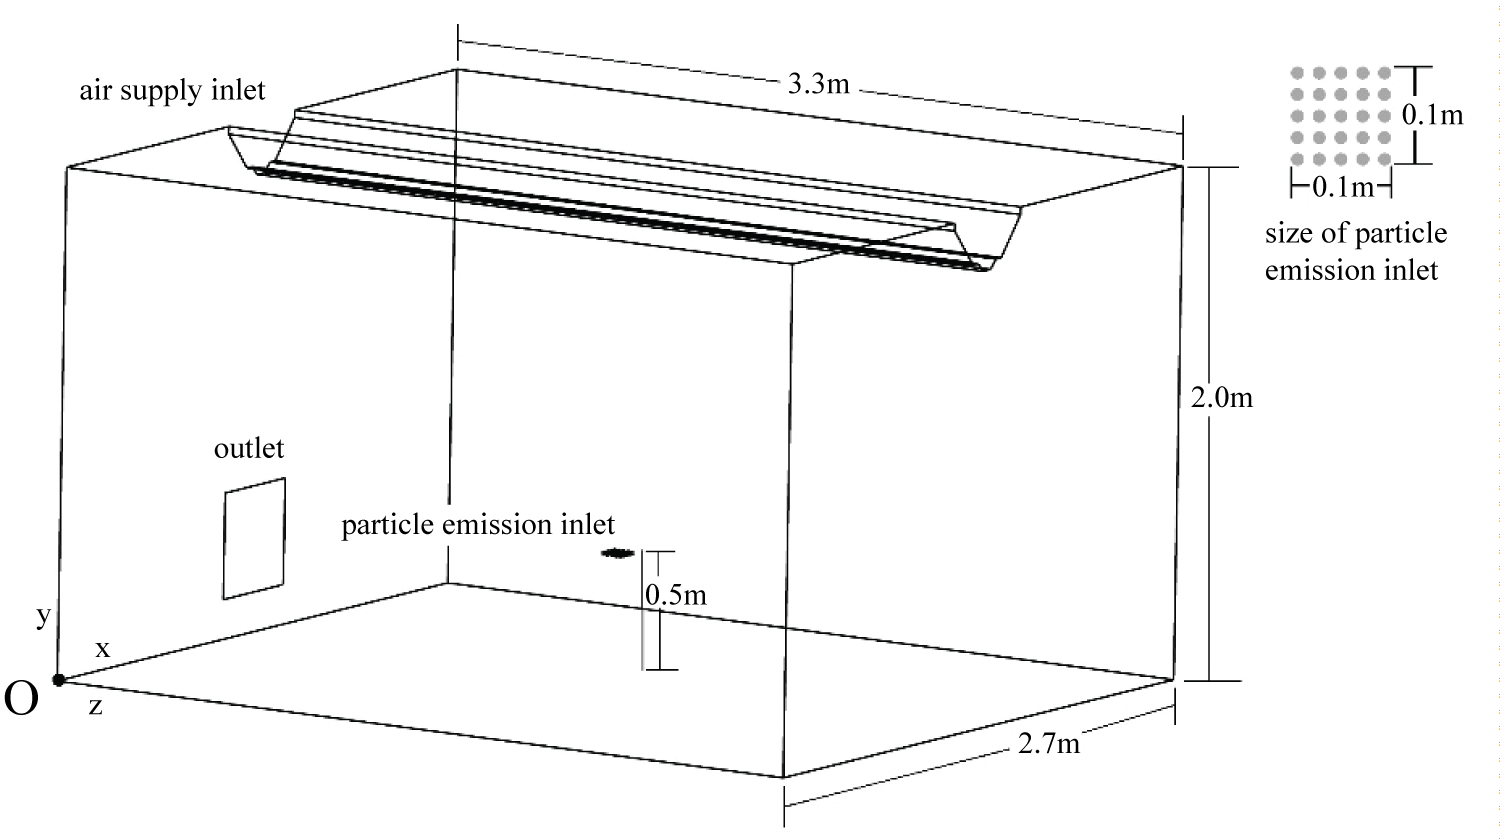
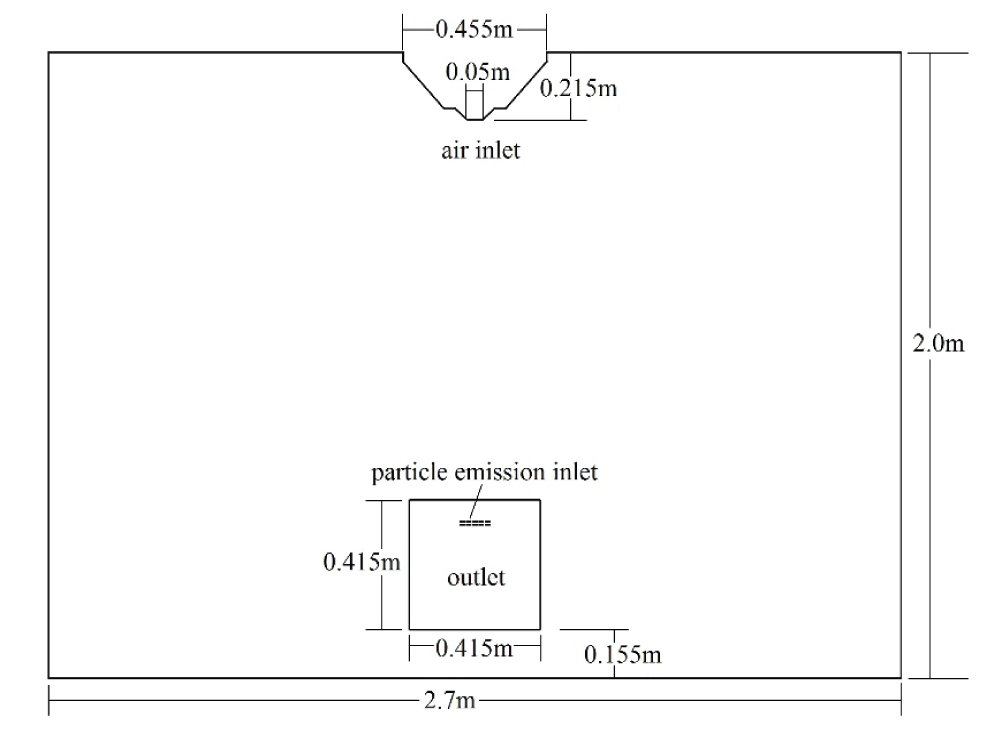
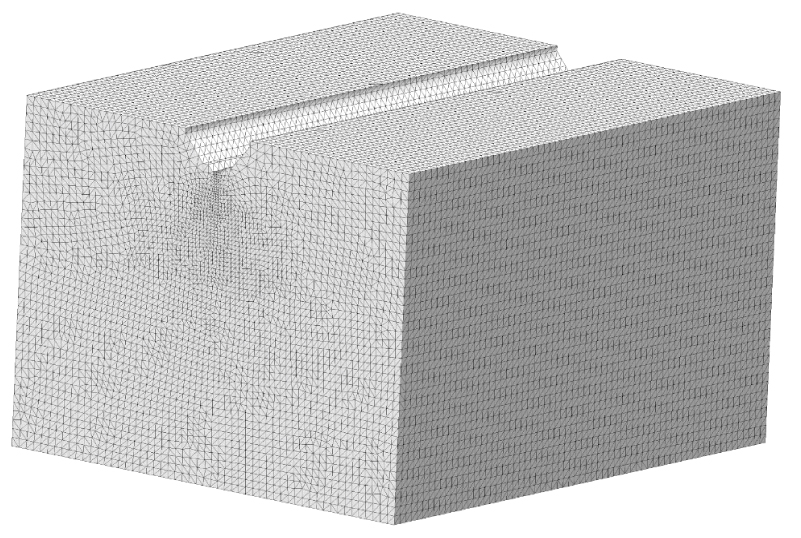
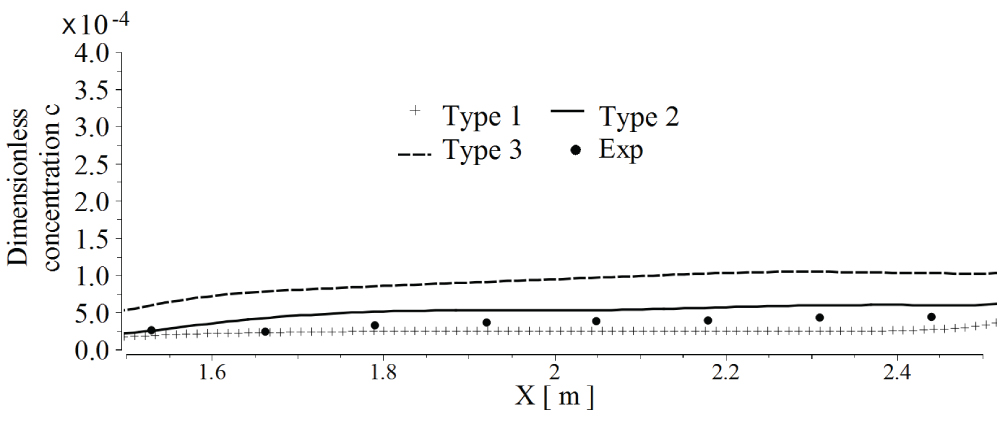
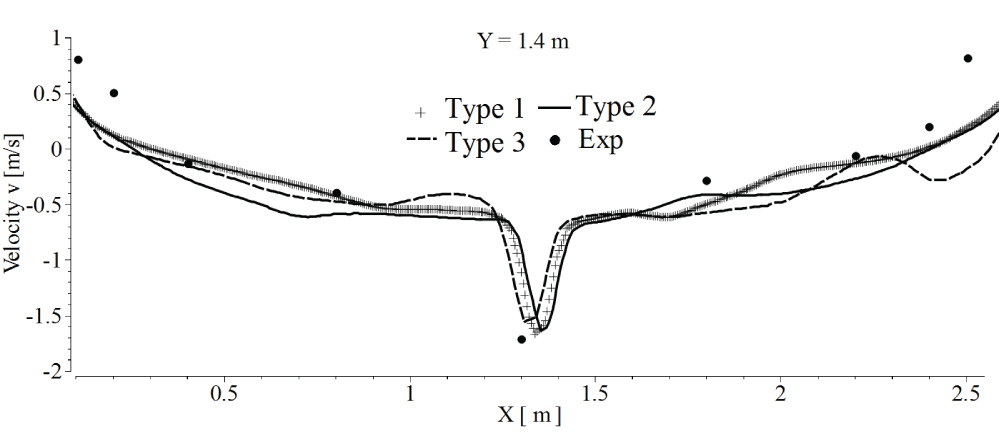
Figure 5: Velocity v profiles...
Velocity v profiles at location 1 in model room for 3 types of grid.
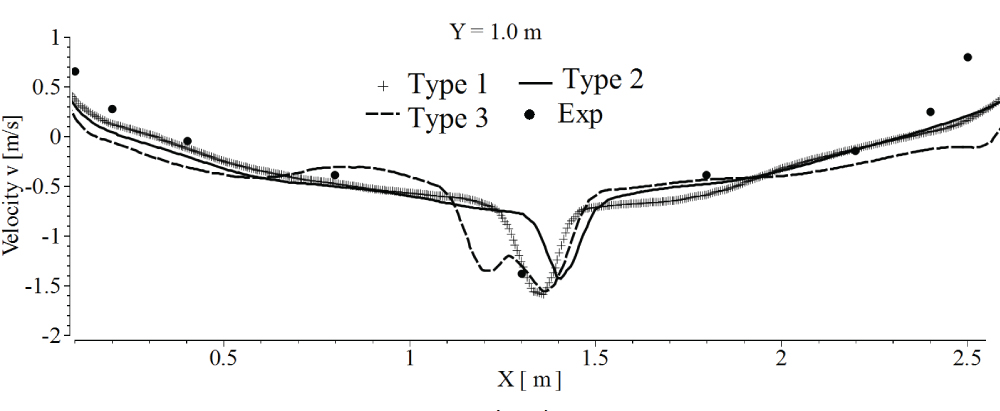
Figure 6: Velocity v profiles at...
Velocity v profiles at location 2 in model room for 3 types of grid.
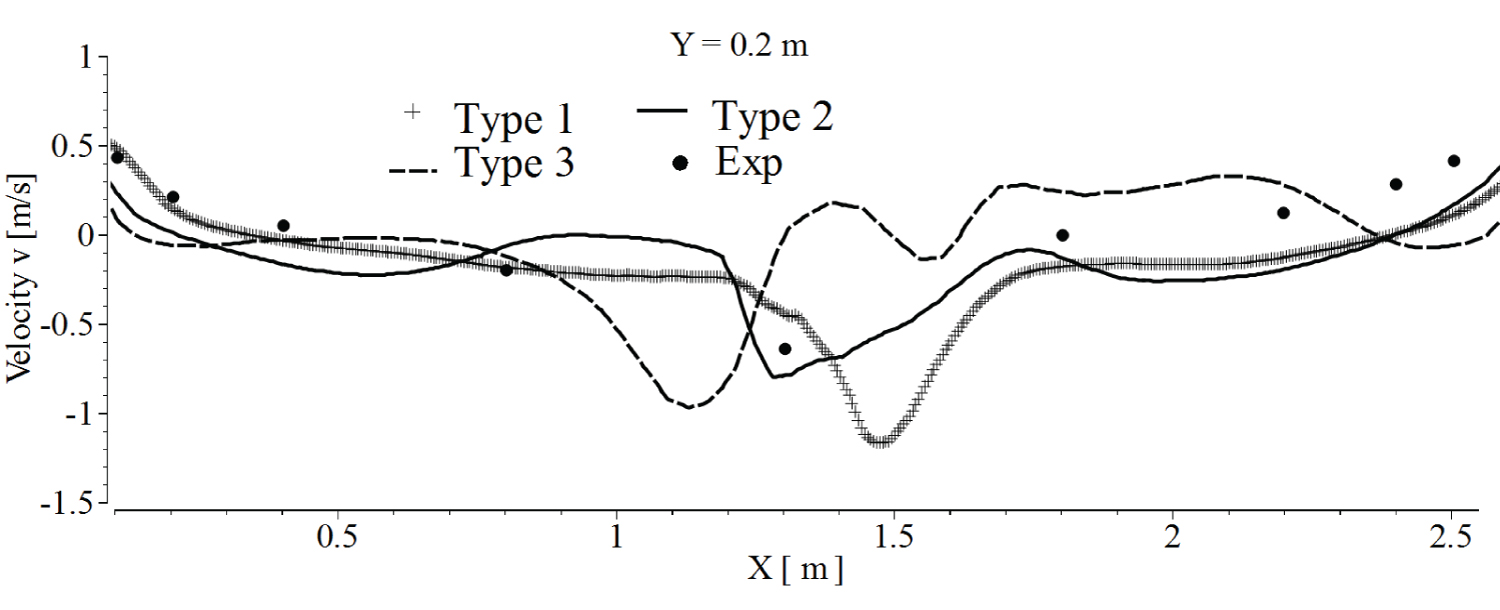
Figure 7: Velocity v profiles...
Velocity v profiles at location 3 in model room for 3 types of grid.
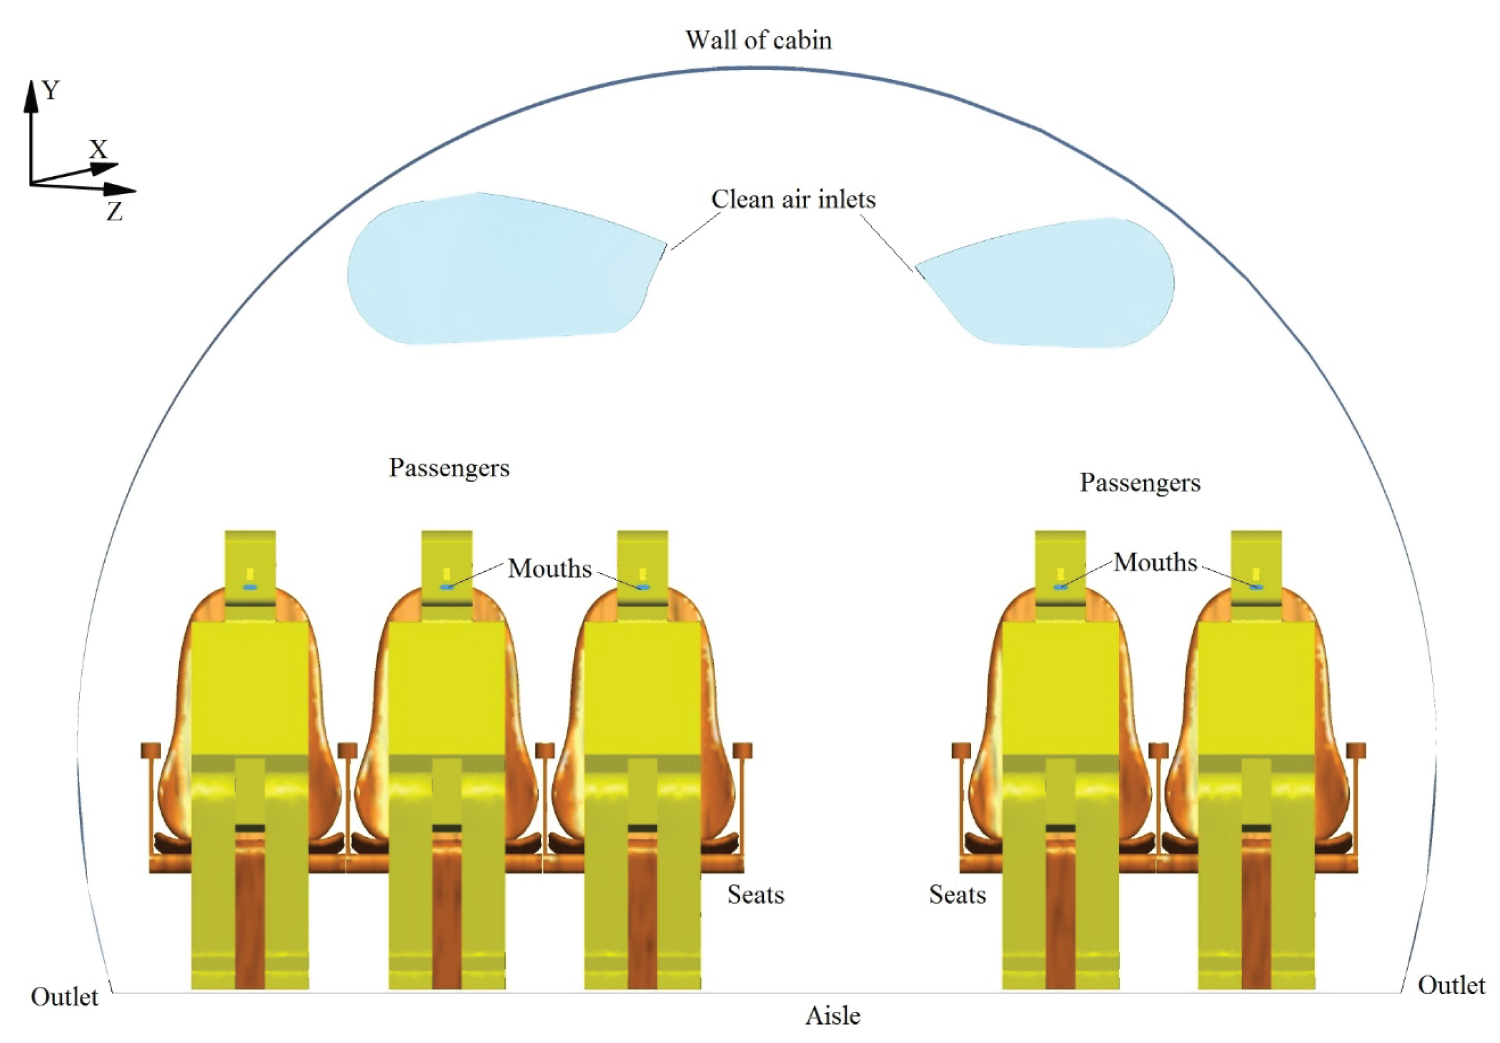
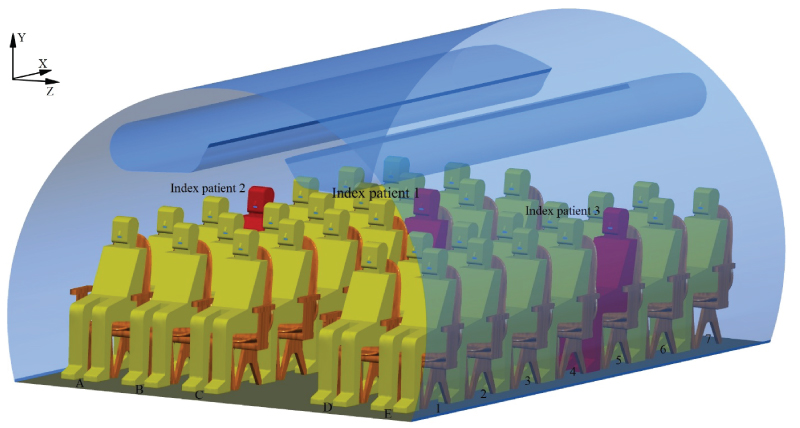
Figure 9: The view of seven-row...
The view of seven-row, single-aisle, fully occupied aircraft cabin for the simulation.
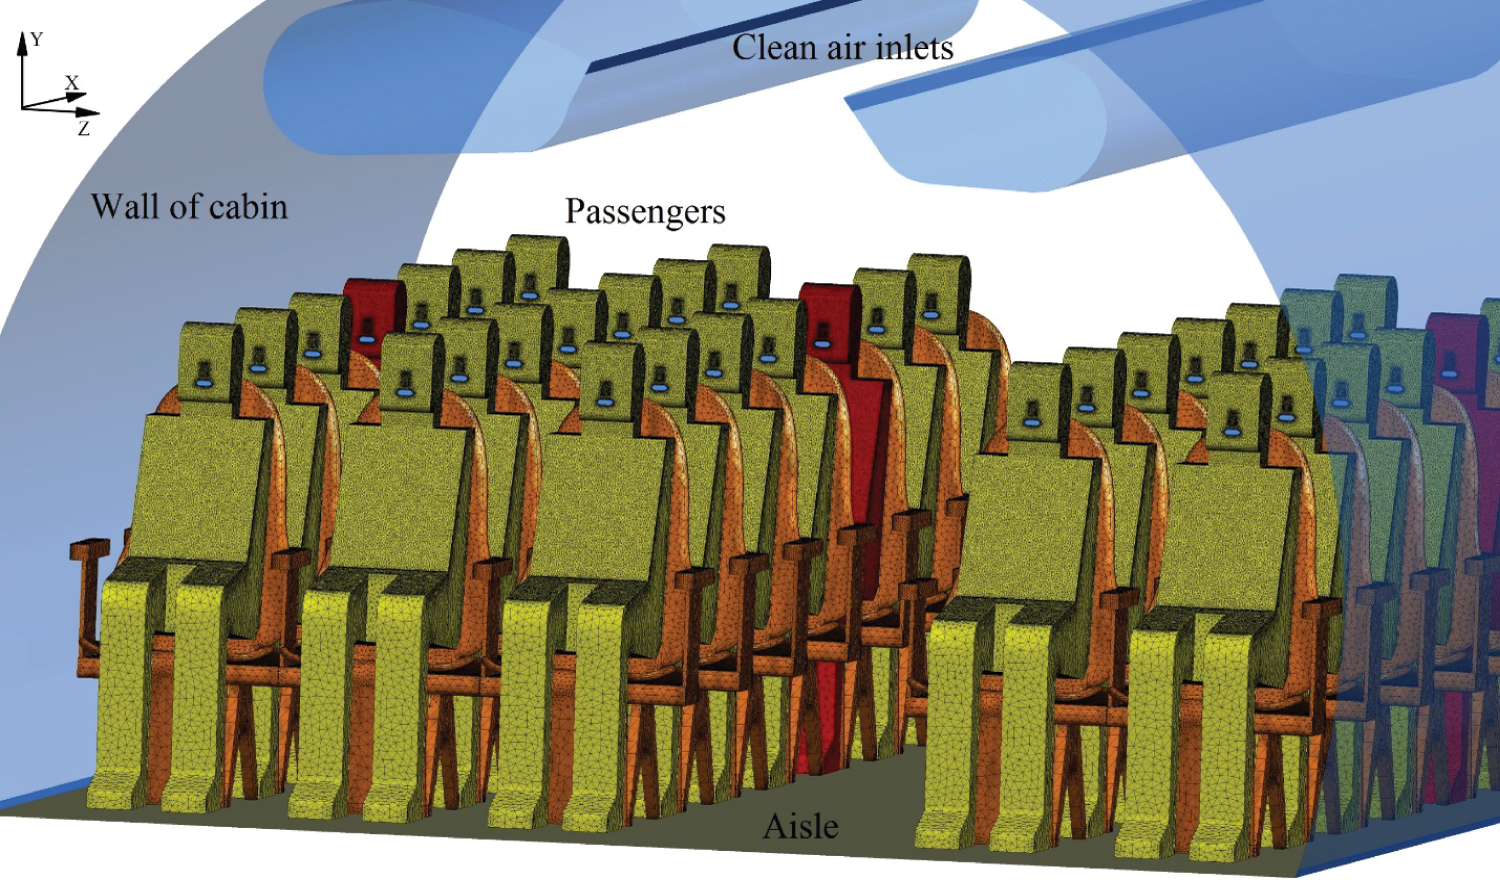
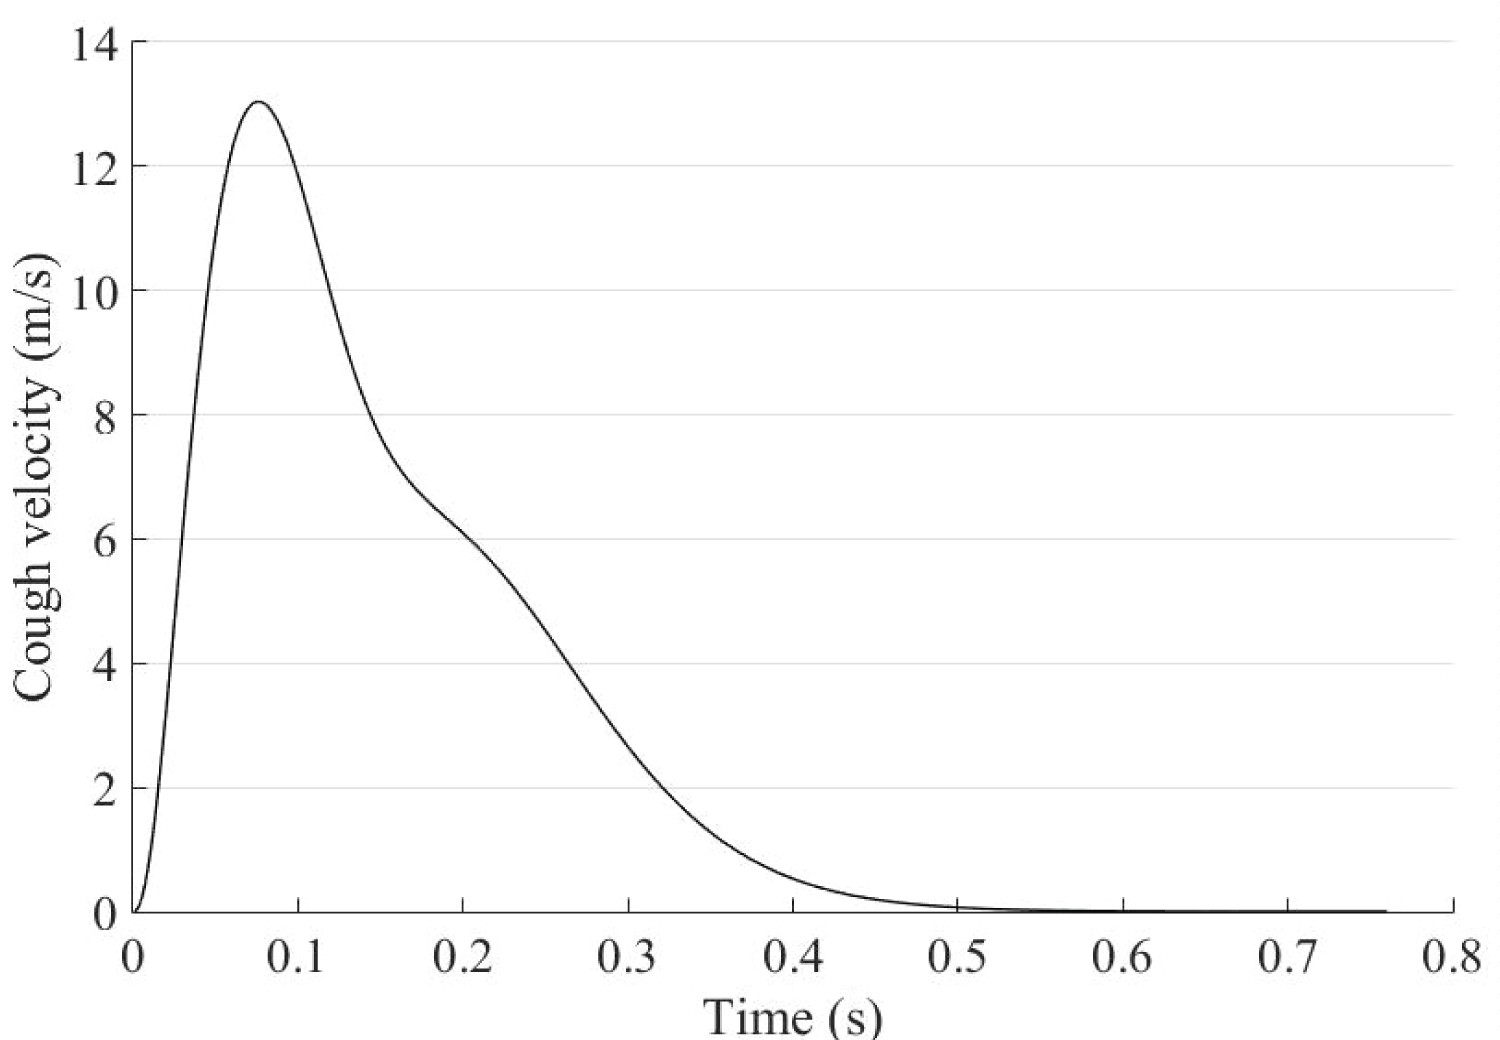
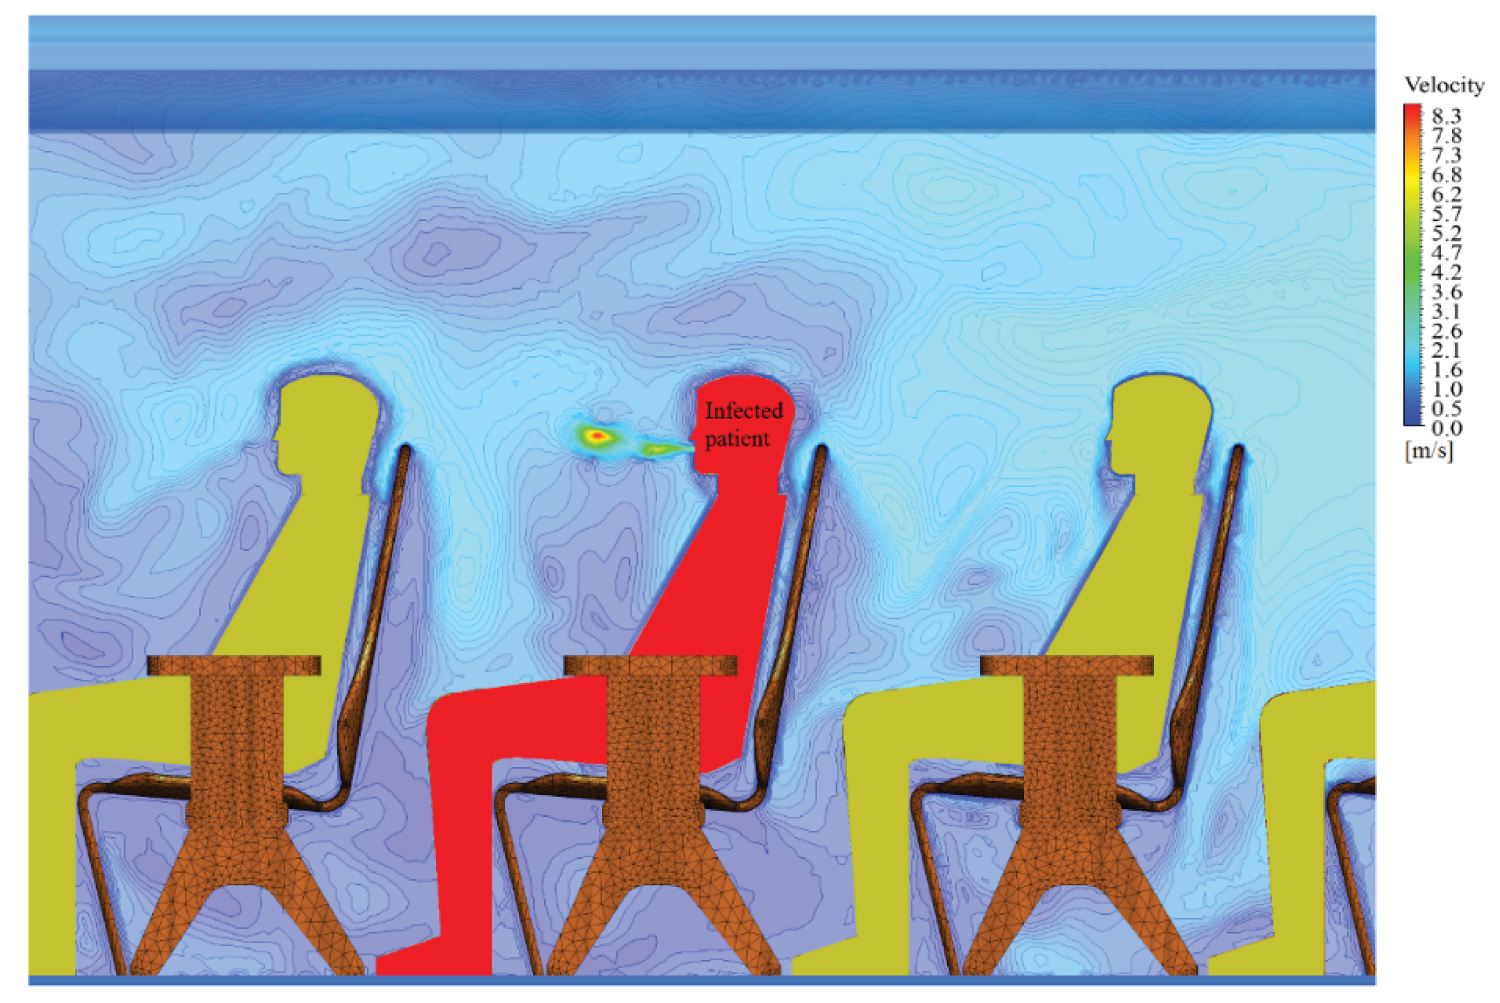
Figure 12: Velocity distribution around...
Velocity distribution around the infected patient (3C) at t = 0.25 s after its cough action.
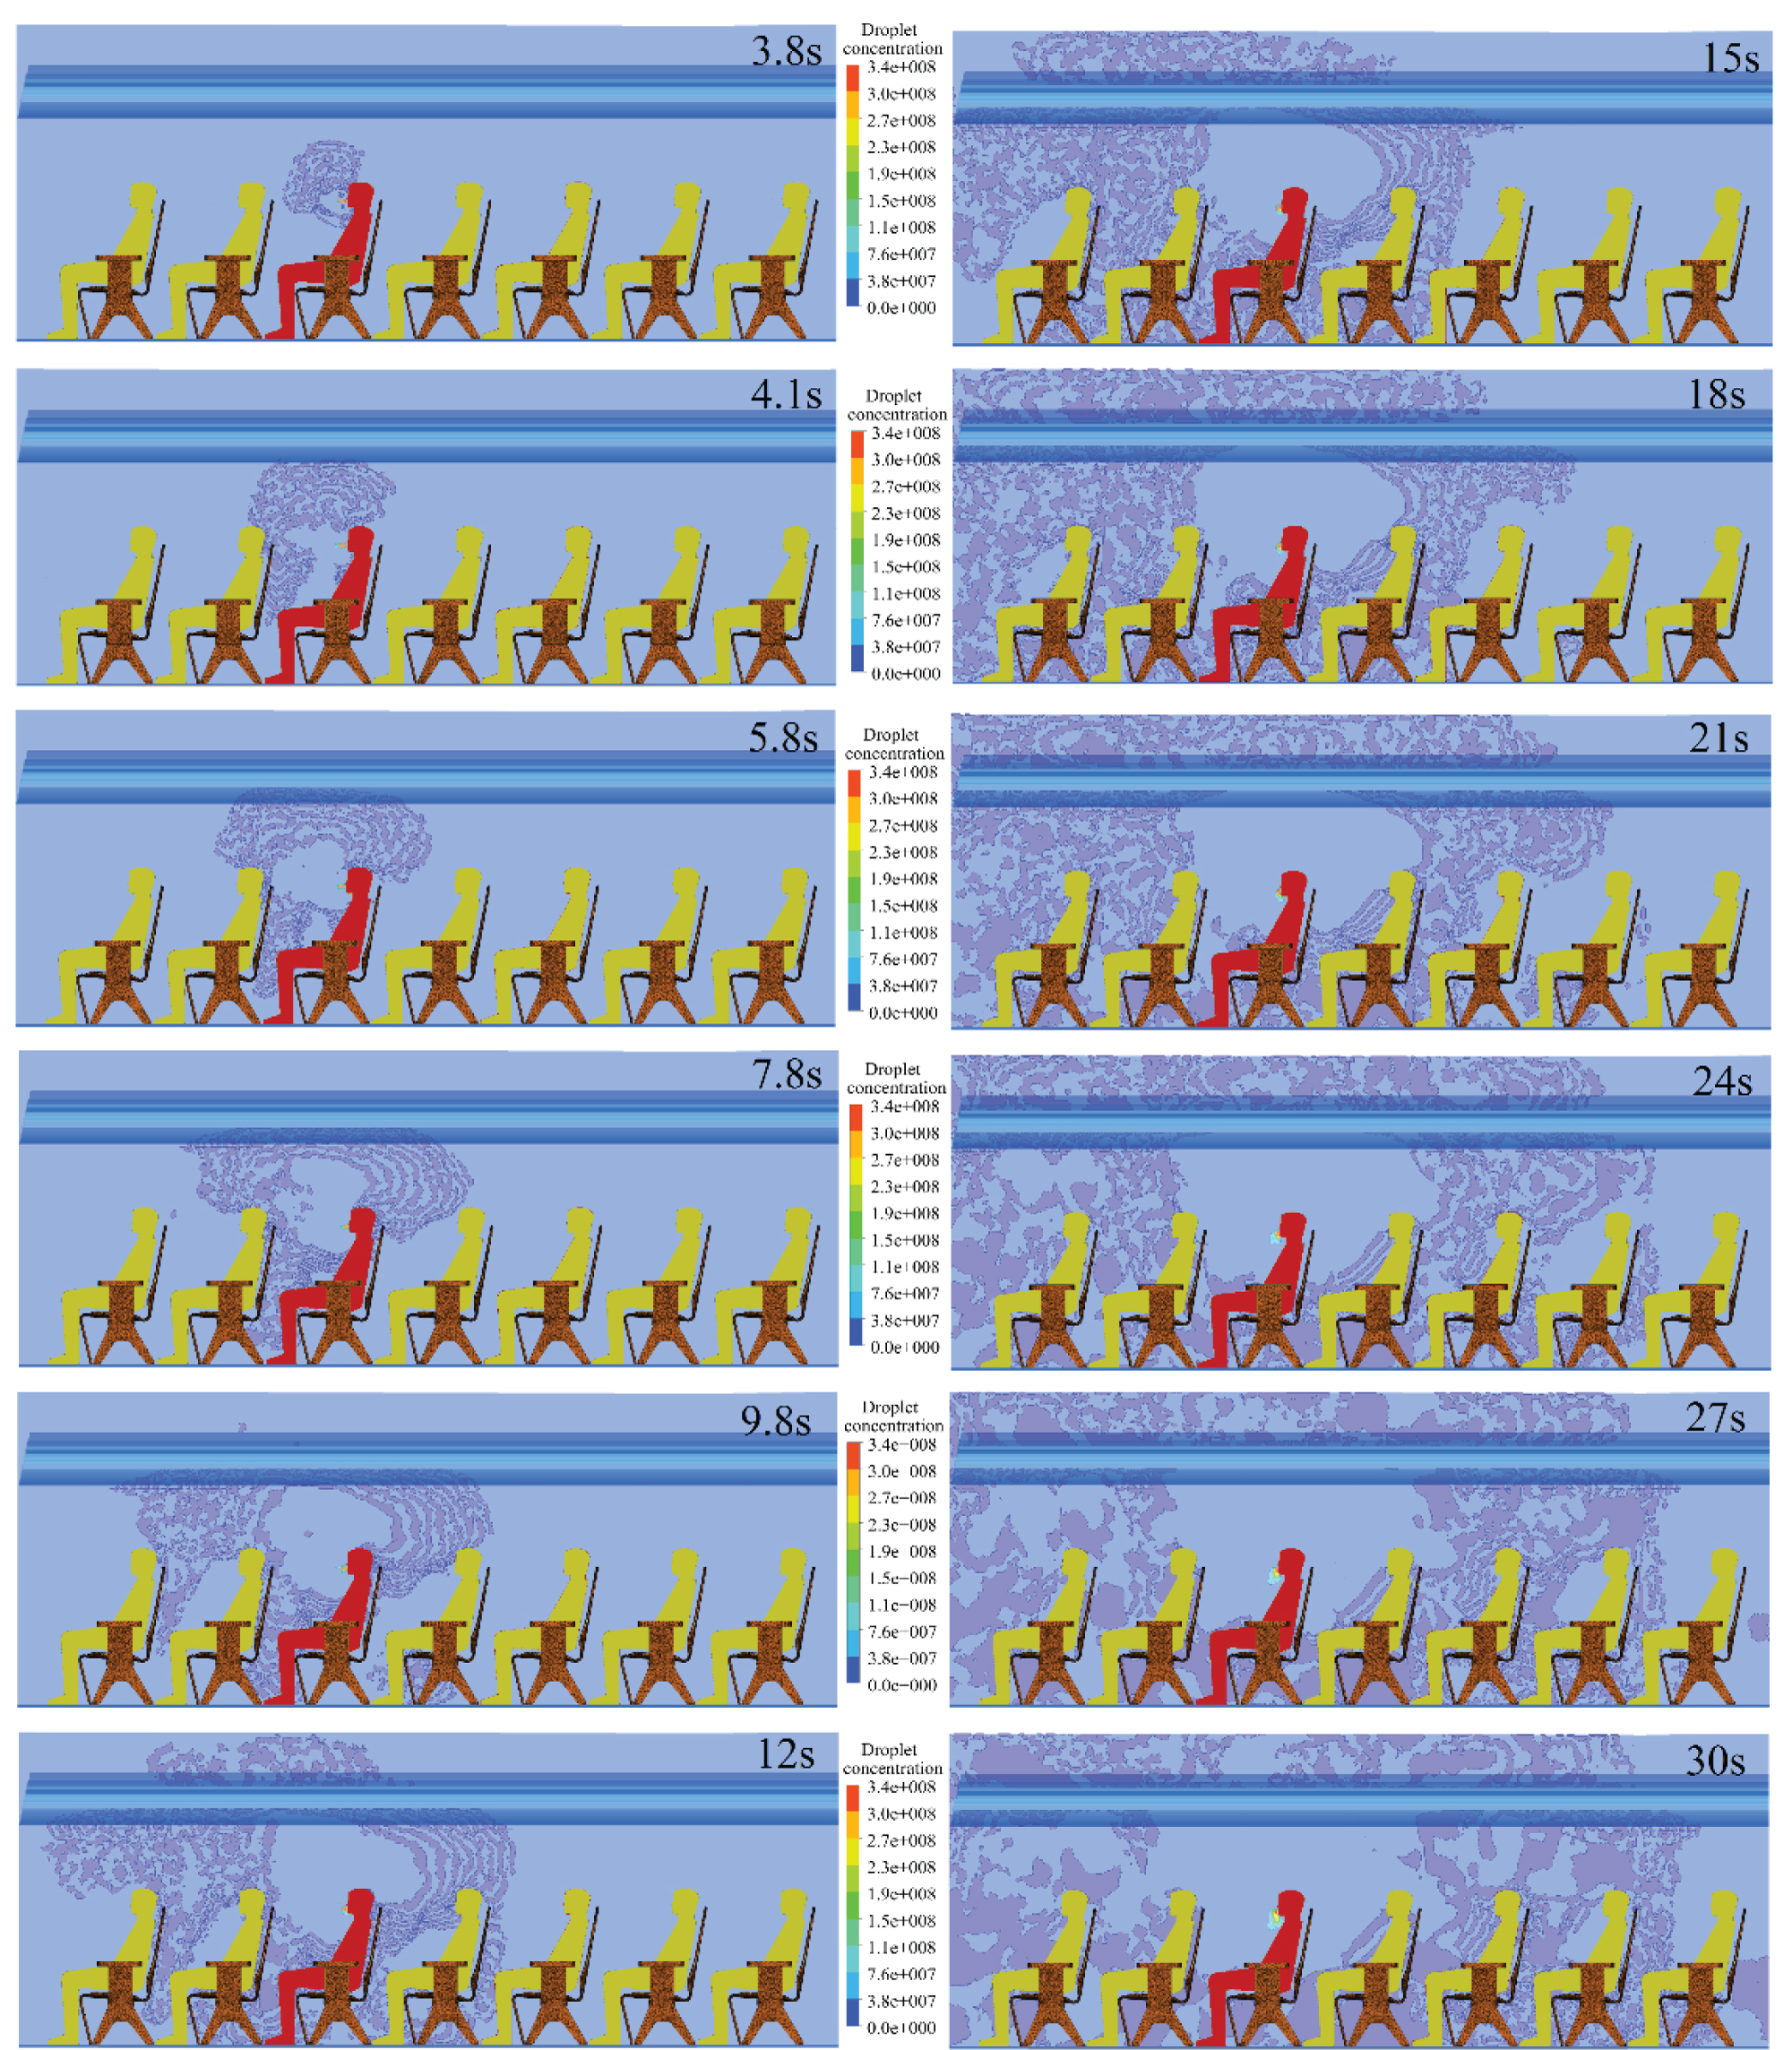
Figure 13: Virus droplet concentration...
Virus droplet concentration diffusing with time on the longitudinal section, the infected person is 3C.
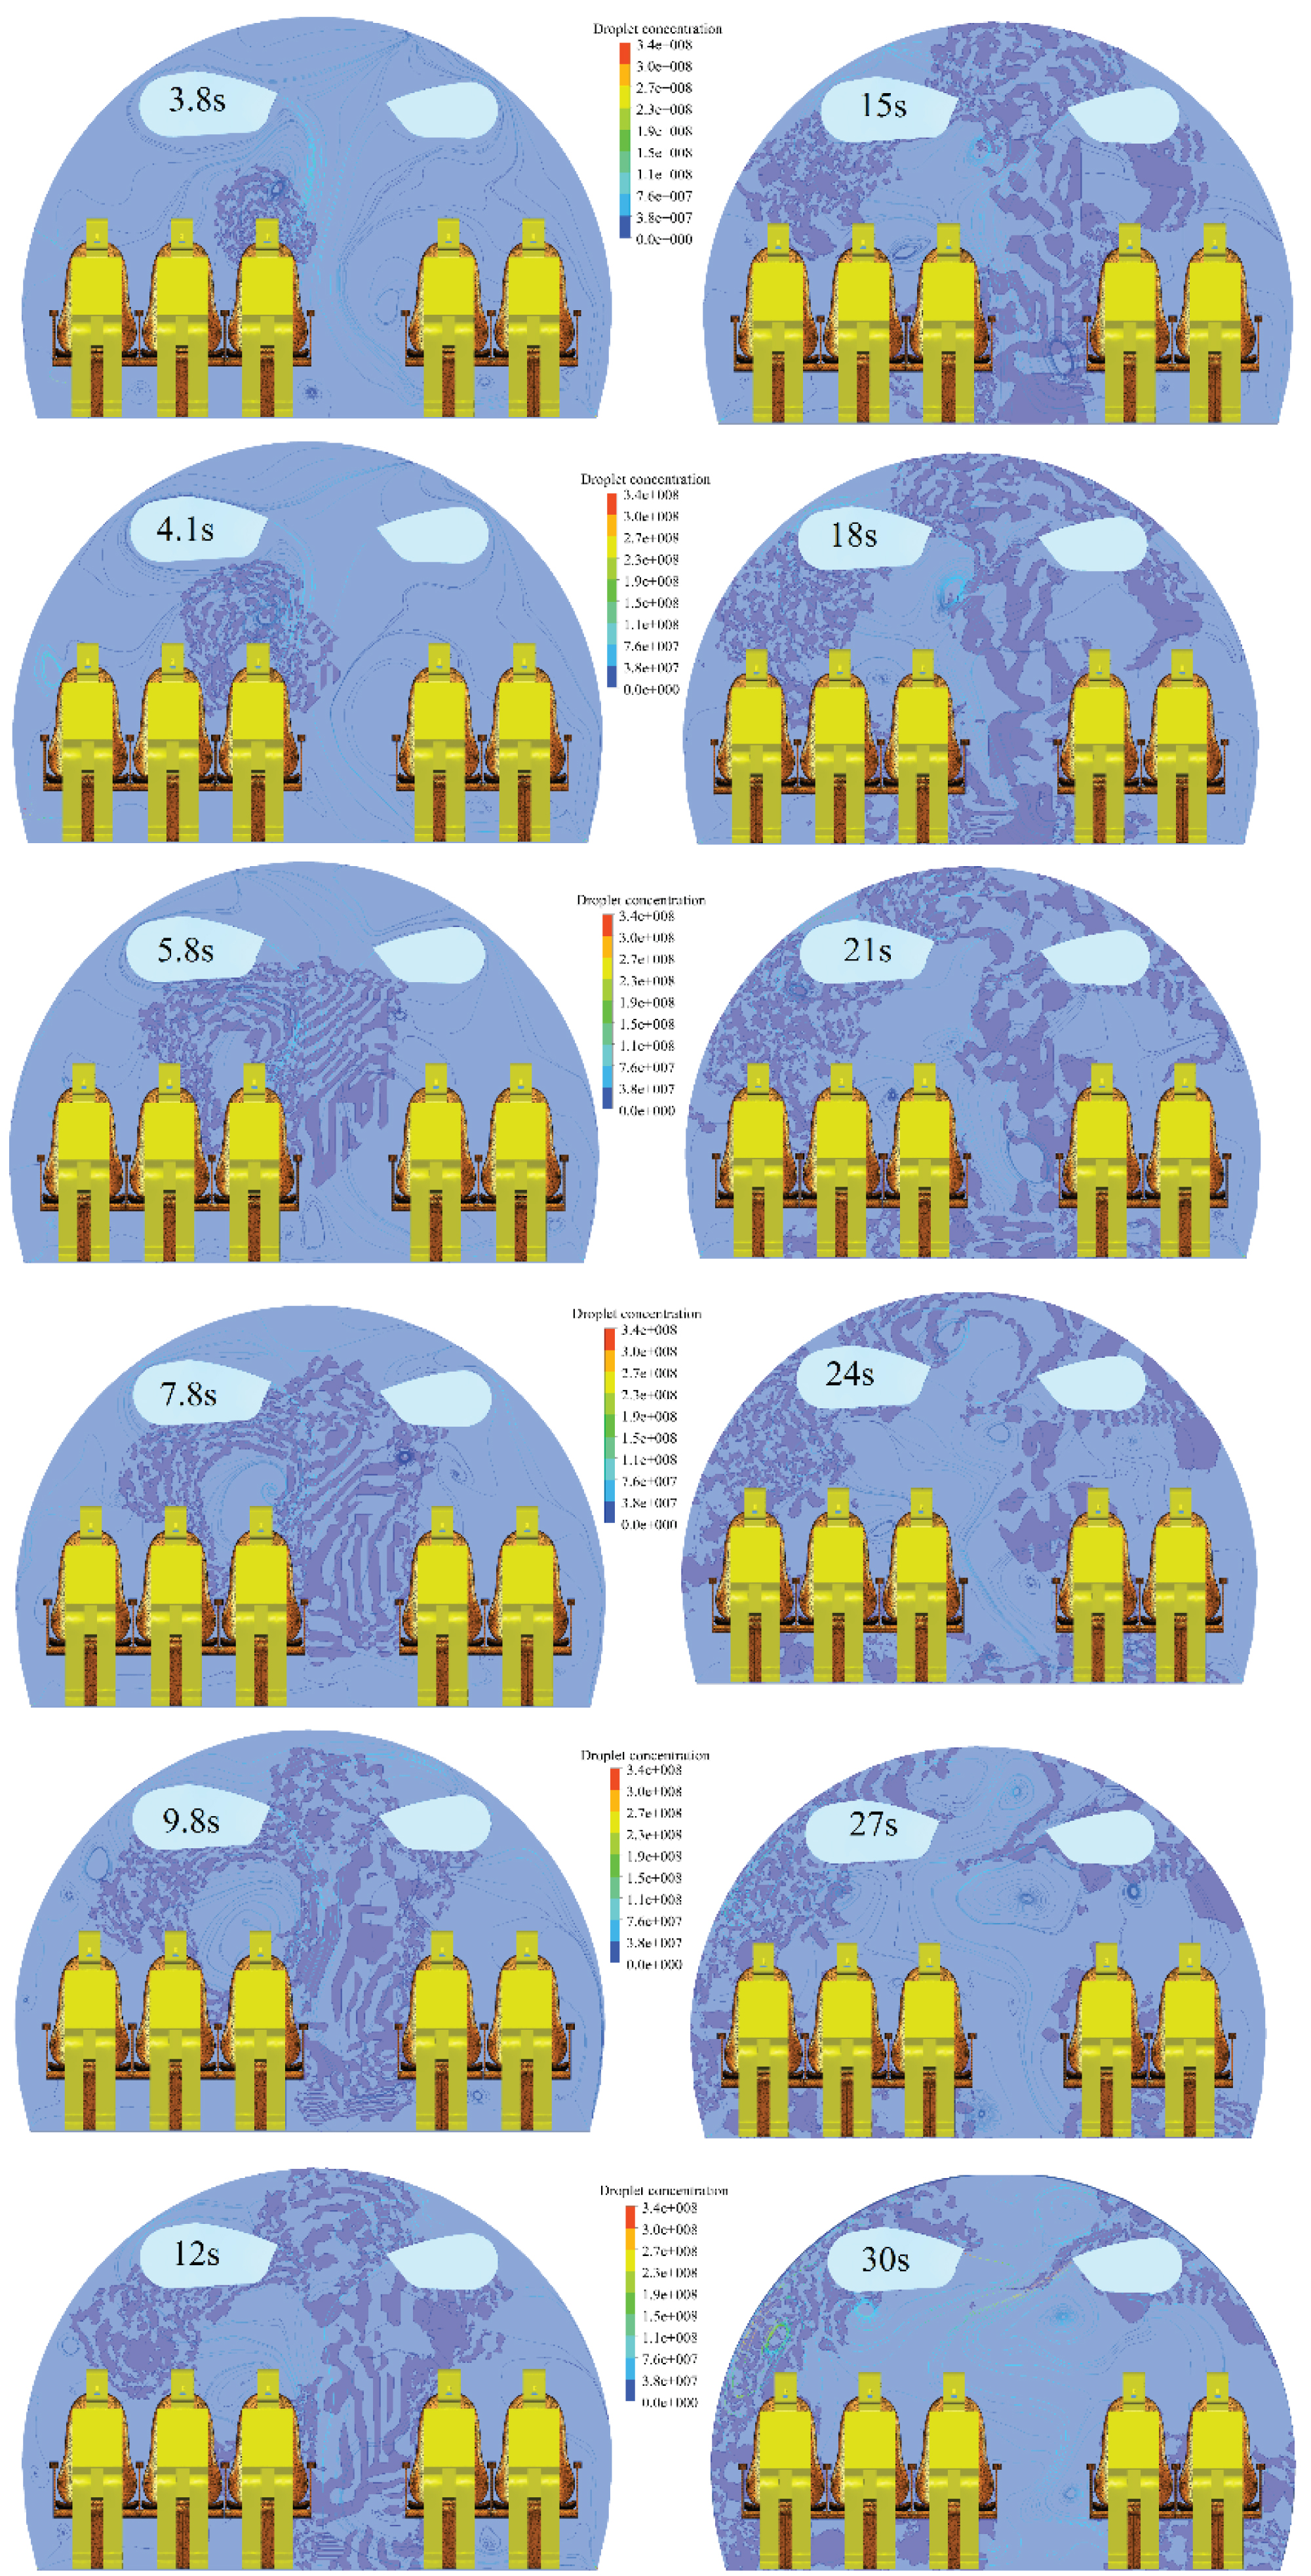
Figure 14: Virus droplet concentration...
Virus droplet concentration diffusing with time on the transverse section, the infected person is 3C.
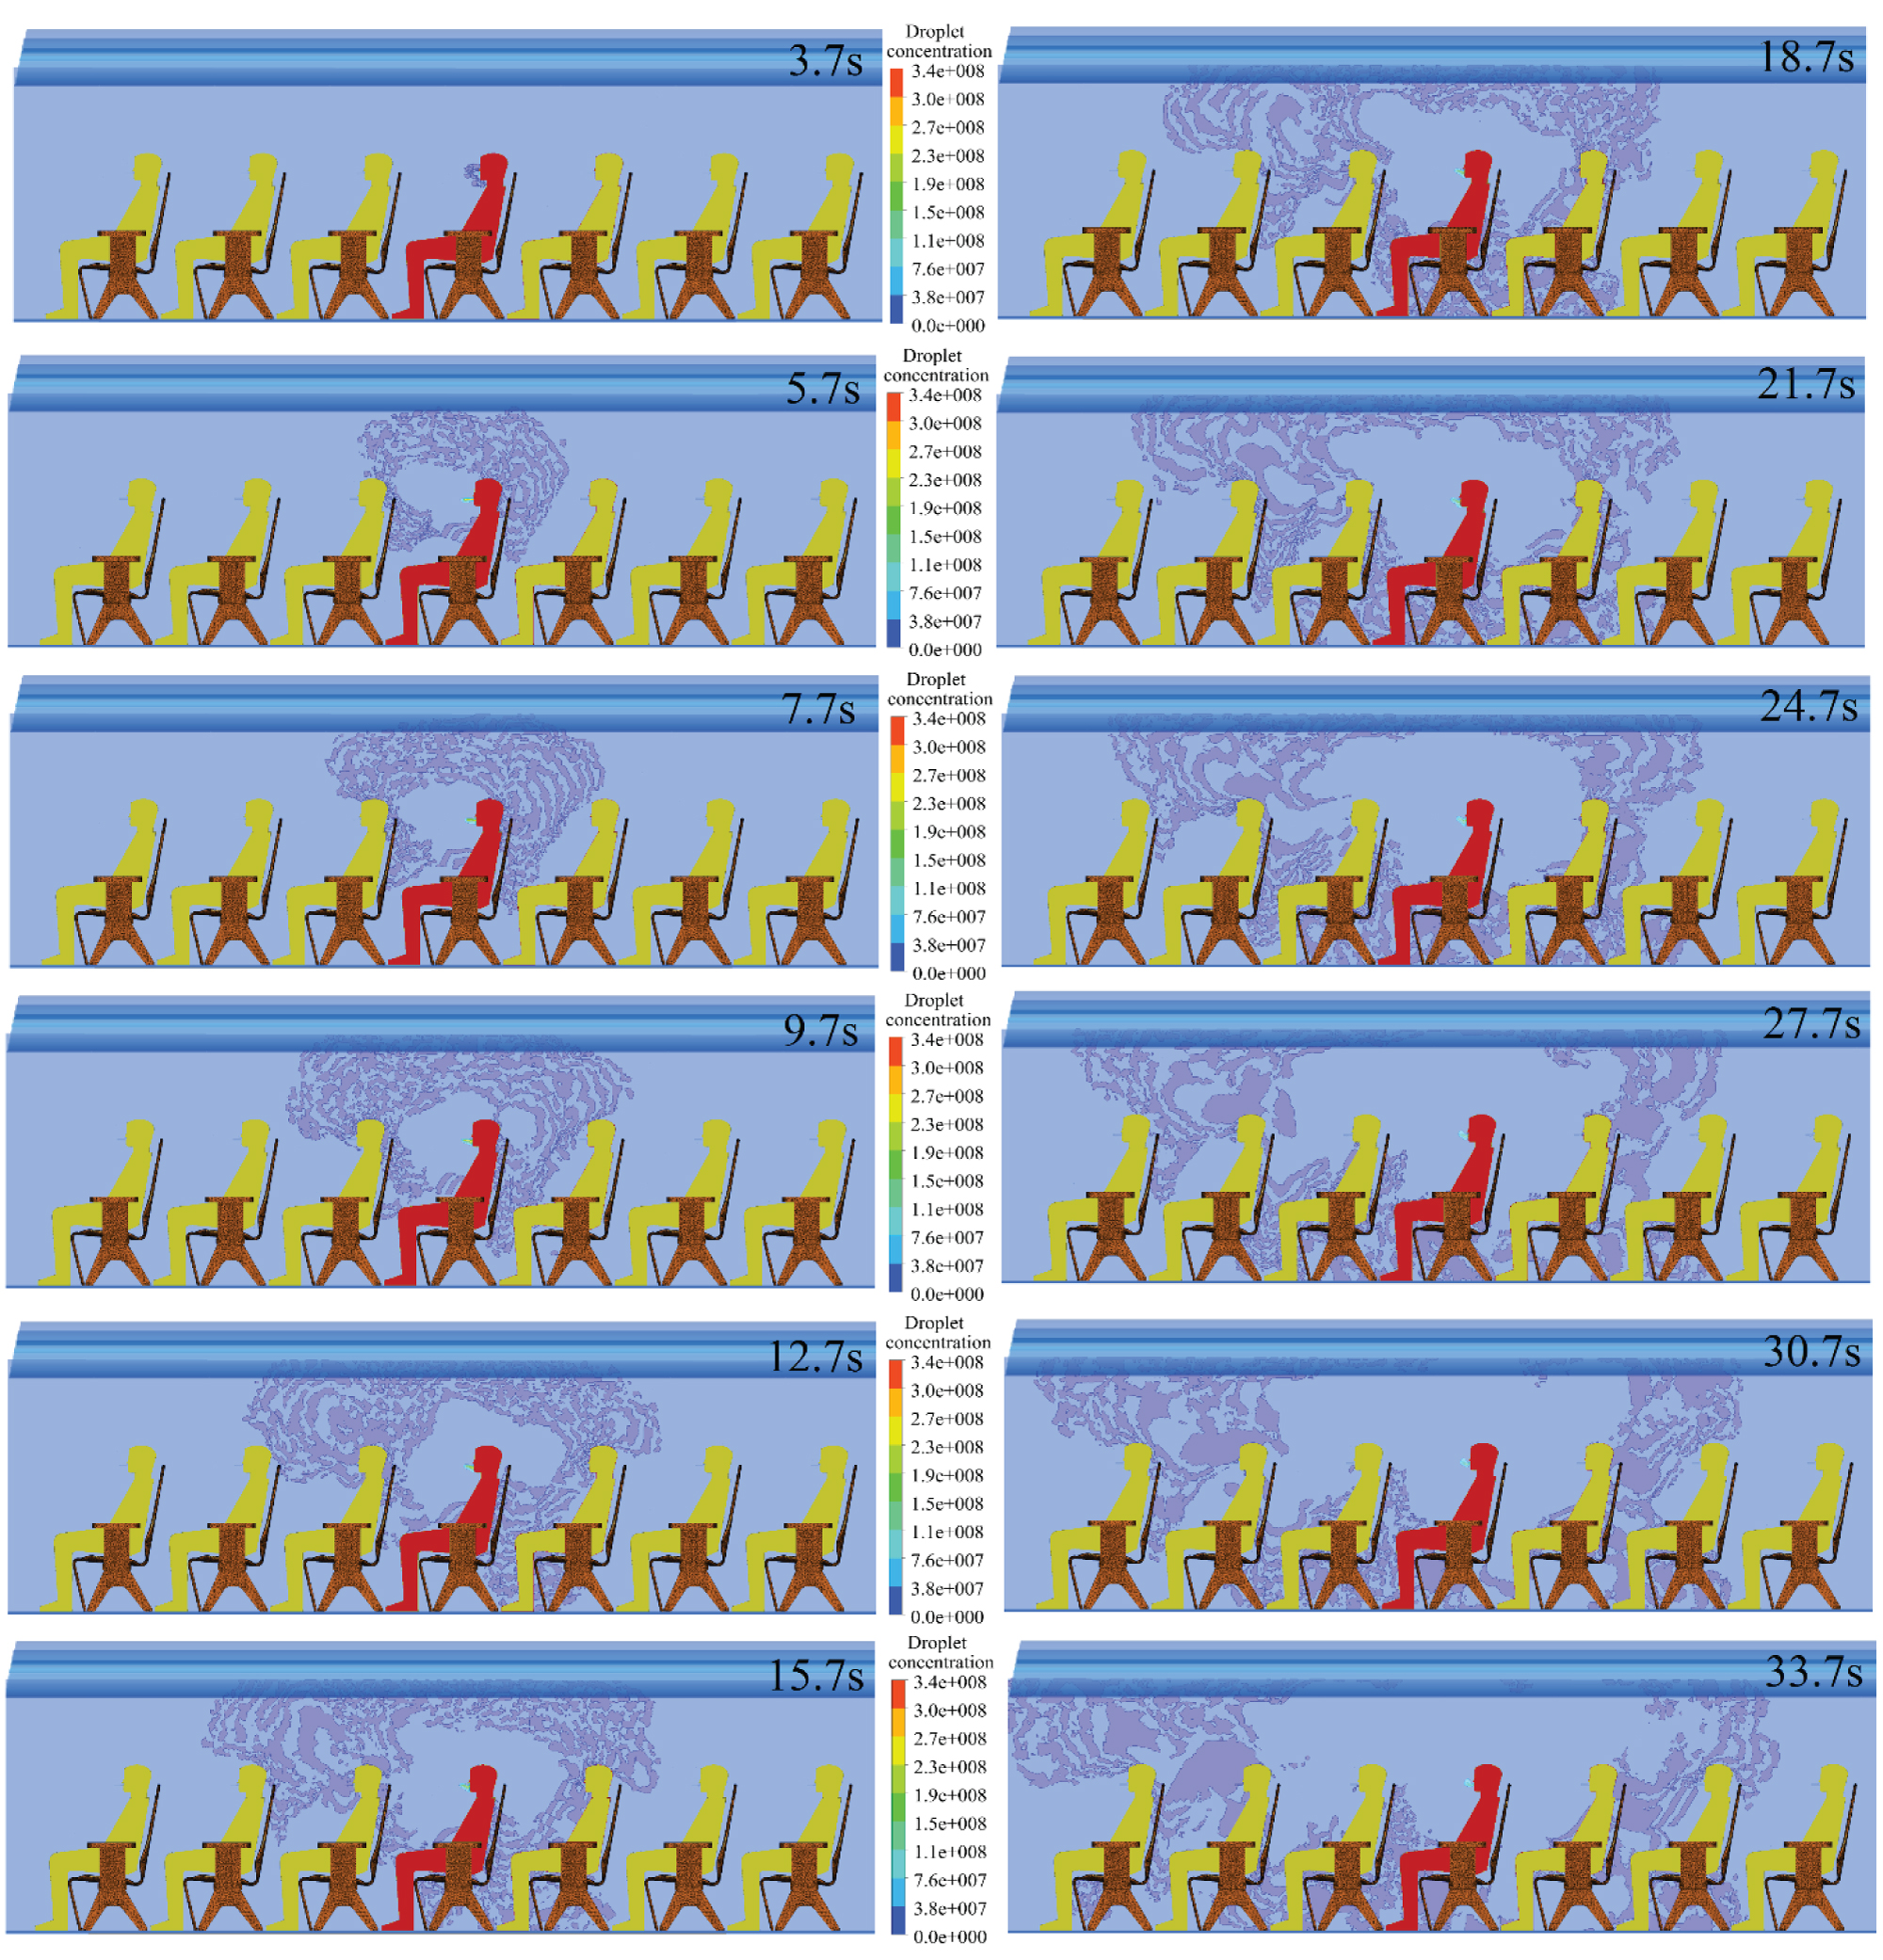
Figure 15: Virus droplet concentration...
Virus droplet concentration diffusing with time on the longitudinal section, the infected person is 4A.
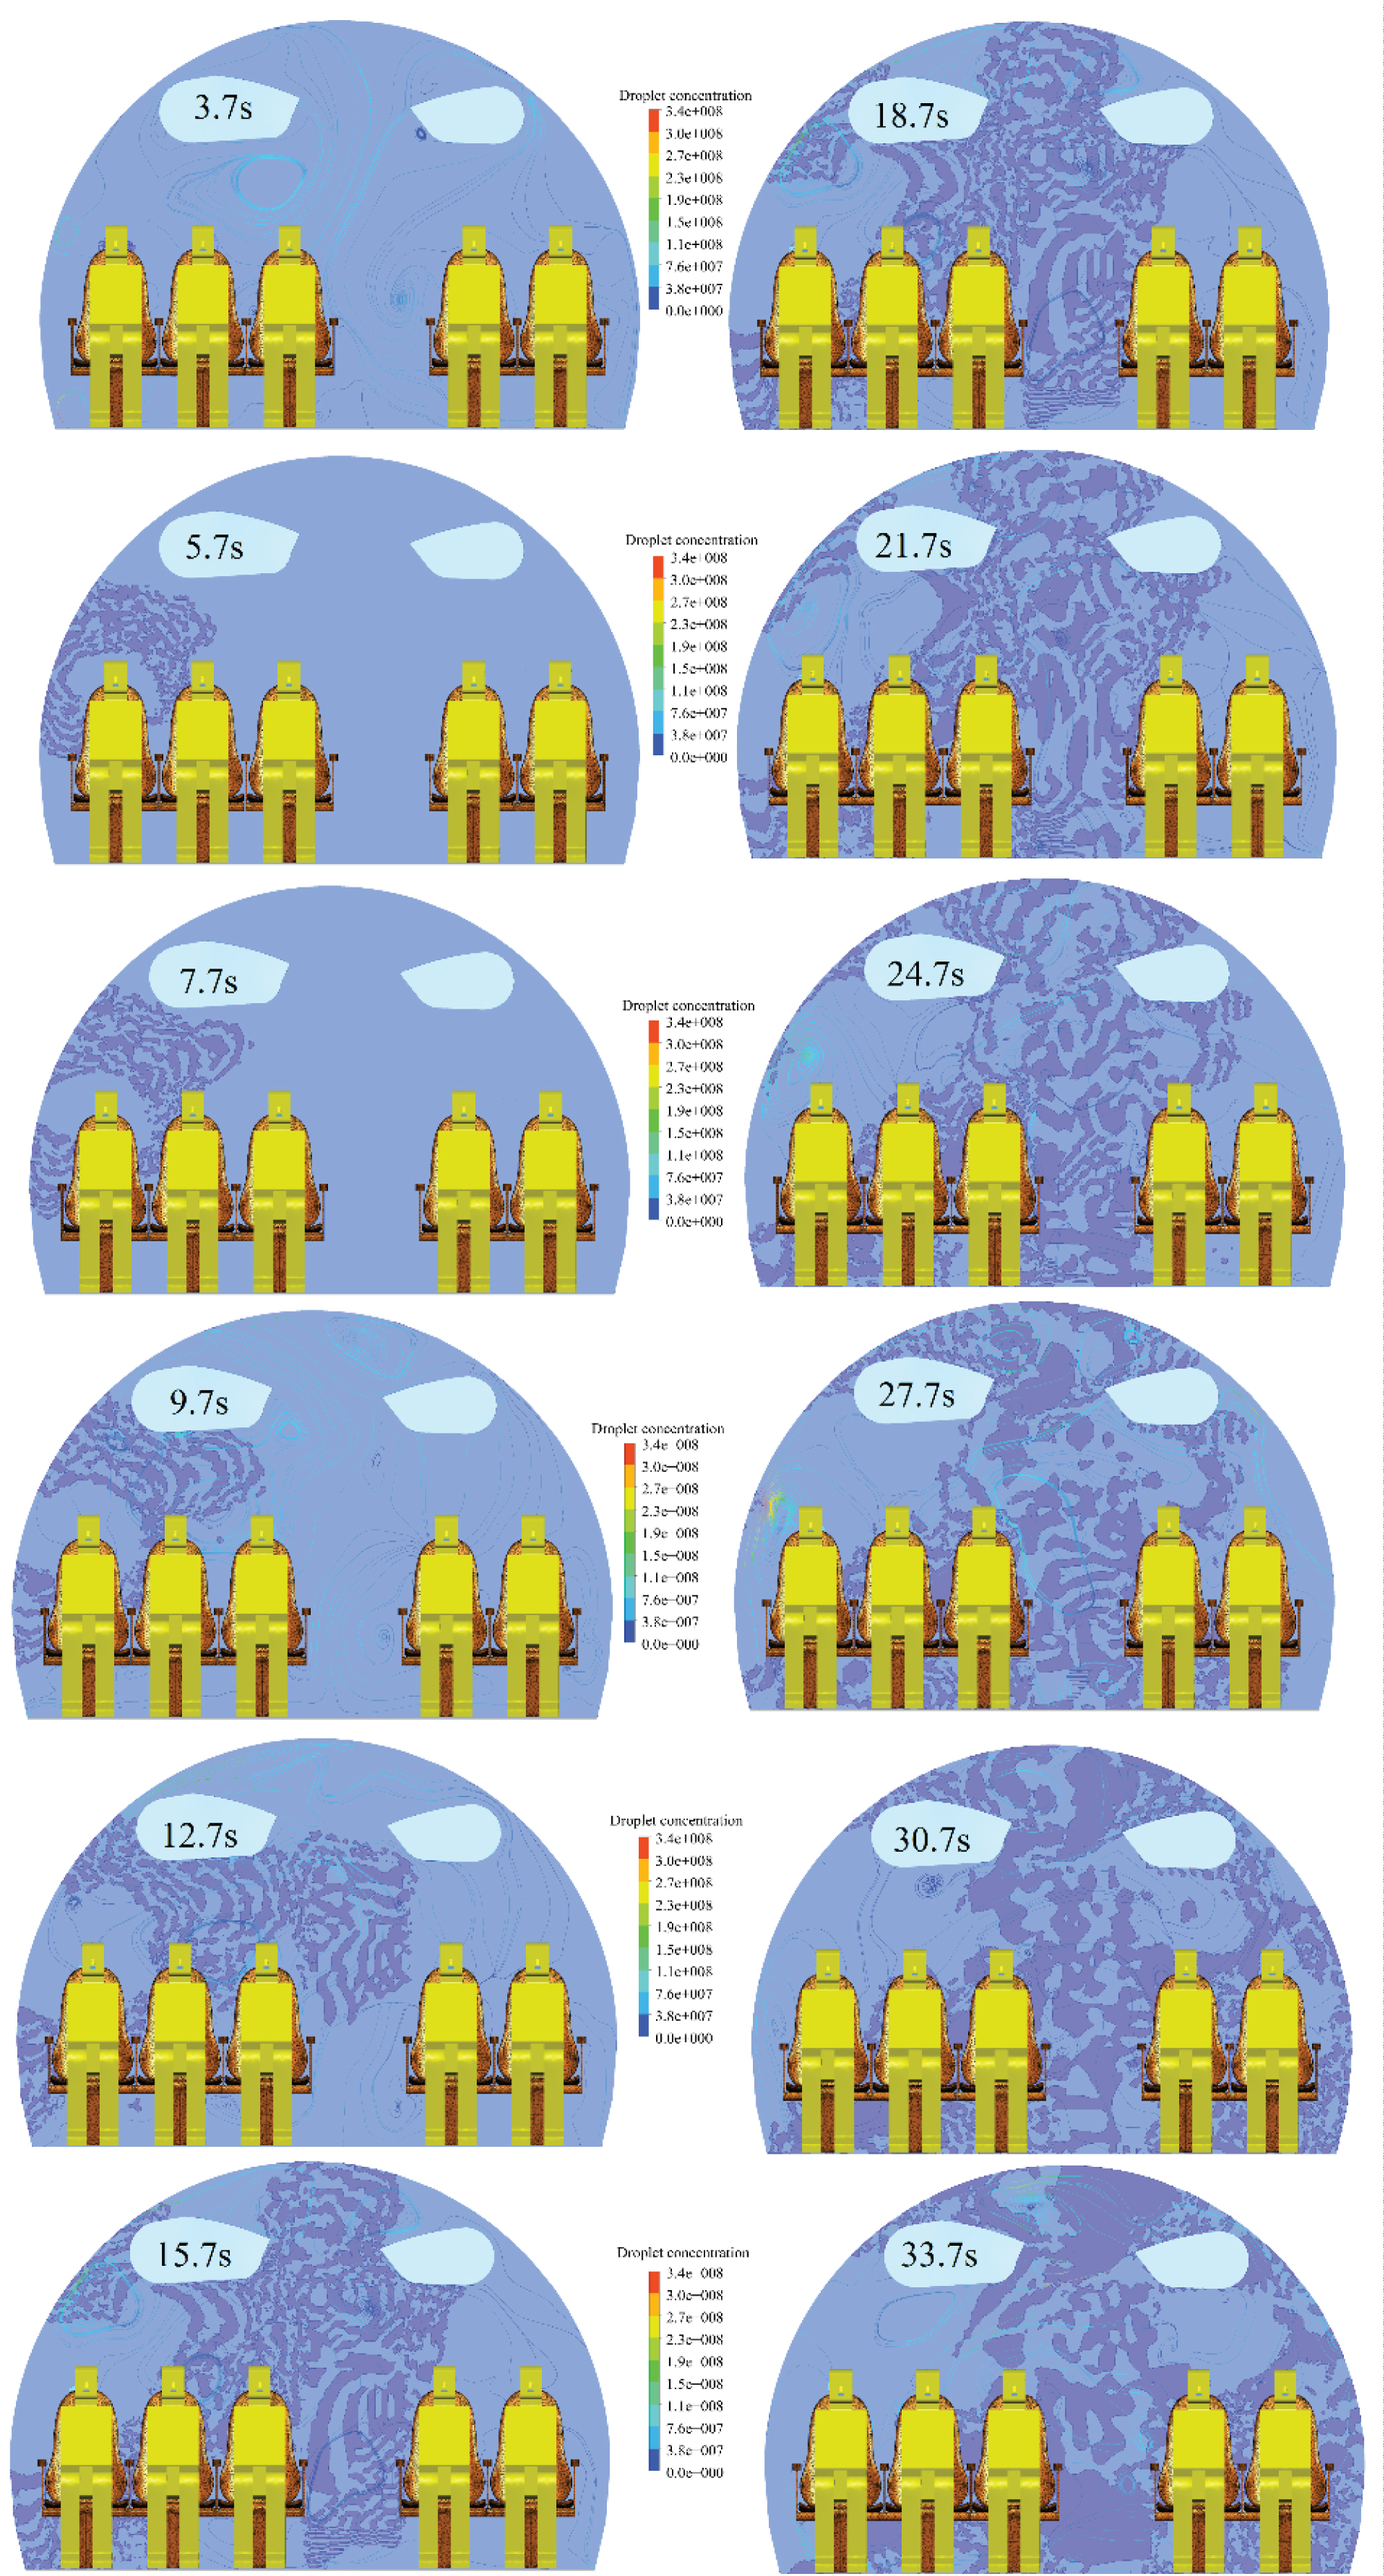
Figure 16: Virus droplet concentration...
Virus droplet concentration diffusing with time on the transverse section, the infected person is 4A.
Tables
Table 1: Grid information.
Table 2: Coordinate information of location 1, 2, 3 and 4.
Table 3: Boundary conditions.
References
- Mangili A, Gendreau MA (2005) Transmission of infectious diseases during commercial air travel. Lancet 365: 989-996.
- Hill PG, Quellette P (1999) Transient turbulent gaseous fuel jets for diesel engines. ASME J Fluids Eng 121: 93-101.
- Nardell E, Keegan J, Cheney S, Etkind SC (1991) Airborne infection. Theoretical limits of protection achievable by building ventilation. Am Rev Respir Dis 144: 302-306.
- Wan MP, Sze To GN, Chao CYH, Fang L, Melikov A (2009) Modeling the Fate of Expiratory Aerosols and the Associated Infection Risk in an Aircraft Cabin Environment. Aerosol Sci Tech 43: 322-343.
- Li Y, Huang X, Yu ITS, Wong TW, Qian H (2004) Role of air distribution in SARS transmission during the largest nosocomial outbreak in Hong Kong. Indoor Air 15: 83-95.
- Zitter JN, Mazonson PD, Miller DP, Hulley SB, Balmes JR (2002) Aircraft cabin air recirculation and symptoms of the common cold. J Am Med Assoc 288: 483-486.
- Yu IT, Li Y, Wong TW, Tam W, Chan AT, et al. (2007) Evidence of airborne transmission of the severe acute respiratory syndrome virus. N Engl J Med 350: 1731-1739.
- Megri AC, Haghighat F (2007) Zonal modeling for simulating indoor environment of buildings: Review, recent developments and applications. HVAC&R Res 13: 887-905.
- Axley J (2007) Multizone airflow modeling in buildings: history and theory. HVAC&R Res 13: 907-928.
- Zuo W, Chen Q (2009) Real time or faster-than-real-time simulation of airflow in buildings. Indoor Air 19: 33-44.
- Dunn DM, Squires KD (2015) Modeling Dilute Gas-Solid Flows Using a Polykinetic Moment Method Approach. ASME J Fluids Eng 138: 041303.
- Jingsen Ma, Assad A Oberai, Donald A Drew, Richard T Lahey (2012) A Two-Way Coupled Polydispersed Two-Fluid Model for the Simulation of Air Entrainment Beneath a Plunging Liquid Jet. ASME J Fluids Eng 134: 101304.
- Zhang T (2007) Modeling of Airflow and Contaminant Transport in Enclosed Environments. Ph.D Thesis, Purdue University.
- Gupta J, Lin CH, Chen Q (2011) Transport of expiratory droplets in an aircraft cabin. Indoor Air 21: 3-11.
- Mazumdar S, Chen Q (2008) Influence of cabin conditions on placement and response of contaminant detection sensors in a commercial aircraft. J Environ Monitor 10: 71-81.
- Zhang Z, Chen Q (2007) Comparison of the Eulerian and Lagrangian methods for predicting particle transport in enclosed spaces. Atmos Environ 41: 5236-5248.
- ANSYS Inc (2016) ANSYS Fluent16.0 user's theory guide.
- Gupta J, Lin CH, Chen Q (2009) Flow dynamics and characterization of a cough. Indoor Air 19: 517-525.
- Yang S, Lee GW, Chen CM, Wu CC, Yu KP (2007) The size and concentration of droplet generated by coughing in human subjects. J Aerosol Med 20: 484-494.
- Zhao B, Zhang Z, Li X (2005) Numerical study of the transport of droplets or particles generated by respiratory system indoors. Build Environ 40: 1032-1039.
- Manabu S, Kikuo O, Seiji O, Takuya A, Masao M, et al. (1996) Numerical Simulation and Experiment on the Transport of Fine Particles in a Ventilated Room. Aerosol Sci Tech 25: 242-255.
- Duguid JP (1946) The size and the duration of air-carriage of respiratory droplets and droplet-nuclei. J Hyg (Lond) 44: 471-479.
- Chao CYH, Wan MP, Morawska L, Johnson GR, Ristovski ZD, et al. (2009) Characterization of expiration air jets and droplet size distributions immediately at the mouth opening. J Aerosol Sci 40: 122-133.
Author Details
Shengcheng JI1*, Jinglei XU2, Shanggui CAI3 and Zhongmin HU1
1Beijing Aeronautical Science and Technology Research Institute, Changping District Beijing, China
2National Key Laboratory of Aircraft Engine, School of Energy and Power Engineering, Beihang University, Beijing, China
3University of Technology of Compiègne, Centre de Recherche Royallieu, France
Corresponding author
Shengcheng JI, Beijing Aeronautical Science and Technology Research Institute, Changping District Beijing, 102211 P.R. China.
Accepted: May 07, 2018 | Published Online: May 09, 2018
Citation: Shengcheng JI, Jinglei XU, Shanggui CAI, Zhongmin HU (2018) Numerical Study of Virus Droplet Transport in Civil Aircraft Cabin. Int J Astronaut Aeronautical Eng 3:015.
Copyright: © 2018 Shengcheng JI, et al. This is an open-access article distributed under the terms of the Creative Commons Attribution License, which permits unrestricted use, distribution, and reproduction in any medium, provided the original author and source are credited.
Abstract
This paper presents the numerical investigations of droplet transport in a civil aircraft cabin generated by an index patient. The transport of the expiratory droplets exhaled from the index patient was investigated using the multiphase fluid dynamic methods. The numerical model was validated with the experimental results. It was found that the droplet concentration could spread faster in transverse direction than in longitudinal direction due to convection effect of airflow and the passenger sitting several rows away from infected patient could be infected by SARS virus. The simulated results show that the turbulence structures have great impacts on the phase of expiratory droplet transport in the aircraft cabin.
Introduction
During a flight, the aircraft cabin is an enclosed and ventilated environment which exposes passengers to hypobaric hypoxia, dry humidity, and close proximity to the index patients [1]. Air quality in cabin has been the focus of many investigations, especially for those virus by which the airborne transmission dominates their transports inside aircraft cabin such as influenza, SARS and avian flu. Airborne transmission happens by aerosolization of these pathogens through droplet nuclei [2]. These residual droplets exhaled from the index passengers become aerosolized, suspend in the air and disperse widely in aircraft cabin depending on environmental conditions [3,4]. The risk of pathogen transmission within the aircraft cabin could be affected by cabin ventilation systems [5,6]. Evidence suggests that the airborne transmission route resulted in SARS spread during the Amoy Gardens outbreak in Hong Kong [7].
There exists the methods like zonal models [8], multizone models [9], Fast Fluid Dynamics (FFD) method [10] and so on [11] except for the CFD method to deal with the virus concentration diffusion. Recently, Computational Fluid Dynamics (CFD) has become an important approach for predicting the transmission of airborne diseases in indoor environment [12], especially in civil aircraft cabin [7]. Compared to the experimental methods, they are more expensive, more time consuming and less flexible to changes, though they can provide realistic data. It is not feasible to carry out experiments in an aircraft in flight because the cost involved could be very high [13], while the computational methods are inexpensive, faster and more flexible with reference to the experiment methods. The zonal-based methods are efficient and they could give approximate results since the macroscopic flows between the different zones are considered. The FFD-based methods are faster than the CFD methods but they are not as accurate as the CFD models where the flows are turbulent [10].
Both Eulerian and Lagrangian methods could be used when CFD method is chosen to simulate the particle transport in an enclosed environment. The Lagrangian method is usually used to track the particle paths, while the Eulerian method is for predicting the particle concentration distribution [14-16]. Herein, the Eulerian method is adopted to deal with the droplet concentration spread in the aircraft cabin, the convection-diffusion equation is coupled with Navier-Stokes equations and turbulence model to simulate the droplet concentration spread in civil aircraft cabin. The main purpose of this paper is to investigate the Environmental Control System (ECS) influences on the virus concentration spread in longitudinal and transverse directions. A numerical model are developed in Eulerian way by considering the settling velocity when modeling the turbulent concentration flux in Eulerian way to investigate the droplet transport inside the civil aircraft cabin, which it is different from other model. The grid dependences are also analyzed for the velocities of the airflow and the concentration of the droplets. It was found that the current model is capable of capturing droplet concentration distribution under complex flow structures. Finally, the influences of the different index patient on droplet concentration distribution are evaluated at the end of the paper.
In this paper, the second part presents the governing equations for fluid, droplet concentration field respectively, and then the boundary conditions used for the droplet concentration transport. The third part of this paper expresses the validation of the numerical model in a 3.3 m × 2.7 m × 2 m room with air entry inside by comparing it with experimental data. The fourth part demonstrates the application of the validated model about the droplet concentration distribution in a seven-row civil aircraft cabin. Finally, the constructive conclusions of our investigations are given in the conclusive part of the paper.
Governing Equations
Aerodynamic model
Where (xi)I = 1,2 are the Cartesian coordinates, t is the time, ρ is the density of the fluid, (ui)I = 1,2,3 are the Reynolds averaged velocity components, (u'i)I = 1,2,3 are the fluctuating velocity components, p is the averaged pressure, µ is the dynamic viscosity, δij is the Kronecker symbol and are the turbulent Reynolds stresses which are denoted by τij. The terms are modeled via the Boussinesq hypothesis and the closure of the set of Eq. (1)-Eq. (2) is obtained using the standard Re-Normalization Group (RNG) k-ε model. Zhang evaluated various turbulence models and recommended RNG k-ε model to handle the mixed convection simulations [13]. fi is the body force terms. In addition, the energy equation is also solved for the temperature. Herein, the buoyancy forces are not included since the convection-diffusion equation instead of particle transport equations is solved for the droplet concentration transport. The ANSYS-Fluent 16.0 code is adopted to simulate the transient aerodynamic flow [17].
Convection-diffusion equation
The transient convection-diffusion equation is used to simulate the droplet concentration transport. The three dimensional equation is given as:
Where, c is the mean droplet concentration or residual particle number, c' is the fluctuation of c, ui is the fluid velocity component corresponding to xi, ui' is the fluid velocity fluctuation component, usi is the slip velocity component between droplet or particle and fluid. Due to the gravity, the velocity vector usi is reduced to (0, 0, -ws), where ws is the particle falling velocity. The particle falling velocity for the current range of droplet diameter is 10-6 m/s to 10-4 m/s. The particle deposition rate for the droplets of size from 0.6 μm to 12 μm with the 25-40 ACH, where ACH means air exchange rate per hour, is less than 10% [13]. Hence, no deposition boundary condition on the surface inside the cabin is acceptable.
The turbulent concentration flux (correlations between turbulent fluctuations of the velocity and the droplet concentration) are modeled as follows:
εsi, turbulent mixing coefficient, is assumed to be proportional to the eddy kinematic viscosity νt. Then:
Where, σc = 0.7 is the turbulent Schmidt number, which varies from 0.5 to 0.8.
Boundary conditions
Flow boundary conditions for the sources of droplet concentration are needed to close the set of above equations. Gupta, et al. evaluated the appropriate droplet distribution information and infectious source strength by combining the flow characteristics experimentally [18]. The boundary conditions for exhalation like a cough are introduced by gamma probability distribution function as follows:
Where, is the non-dimension flow rate, is the non-dimension flow time, a1 = 1.680, b1 = 3.338, c1 = 0.428, , , . Γ is the gamma distribution function. V is the cough expiratory volume of a cough, Tp is the peak velocity time of a cough, and Fp is the cough peak flow rate. t is normally between 57 ms and 96 ms for male while t is from 57 ms to 100 ms for female [18]. Therefore the time step for the calculation should be small enough that the Eq. (6) and Eq. (7) could describe correctly the source flow characteristics.
The medium size of the droplet exhaled during a coughing is about 8.35 μm and the droplet number per cough is around 106 according to literature [19]. Thus mono-dispersed droplets for the coughing are used for the current investigations. Zhao, et al. found that the exhaling flows have little impacts on the airflow pattern in cabin [20]. Therefore, the exhaling of the non-infectious passengers has not been taken into account.
Computational procedure
The set of Eq. (1) and Eq. (2) is resolved by the Finite Volume (FV) method with arbitrary non-structured grid. A procedure of interpolation, based on a second-order scheme, is then used to assign values to the faces of the Control Volumes (CV) since the values of the variables are stored in the center of each cell. The variable gradients on each CV face are computed using a multi-dimensional Taylor series expansion with Least Squares Cell Based approaches. The SIMPLE (Semi-Implicit Method for Pressure-Linked Equations) algorithm was used for the pressure-velocity coupling. For the added scalar quantity in Eq. (3), the second order upwind scheme for convective terms is adopted.
Model Validation with Experimental Results
Simulation setup
The test case is a three dimensional model room of 3.3 m long, 2.7 m wide and 2.0 m high. The schematic illustration of the model room is shown in Figure 1. The clean air supply system is installed on the top side of the room which could produce the air flow downward. The schematic of the air supply system is shown in Figure 2. The outlet of the room is on one side. The size of the outlet is 0.415 m × 0.415 m.
Boundary condition definition
The wall and air inlet temperature of the room model is set as 31 ℃. The velocity of the air inlet is 2 m/s. The particles are released to the room from the particle emission inlet at a flow rate of 1.667 × 10⁻⁵ m3/s while the particle concentration at the emission inlet is 2.5 × 10¹⁰/m3 [21]. In this case, the particles introduced into the room are mono-disperse polystyrene latex particles. The diameter of these particles is 0.14 μm. The falling velocity of the particles could be ignored. The steady state distribution of the particle concentration is obtained finally in the model room to compare with the simulated results.
Numerical model validation
In this subsection, the simulated results of the model room are compared with the experimental results in laboratory. Three sets of non-structured grid are drawn to analyze the dependence of the results on the grid density. The triangular meshes on the surface of the room wall are shown in Figure 3. The total grid number and the average gird size Δxave of the three sets of non-structured grid are given in Table 1. The associated averaged errors Ec of droplet dimensionless concentration were calculated at location 4. Herein, the errors Ec is L2 norm calculated with reference to the experimental data as shown in Figure 4. The associated averaged errors Ev of the velocity v profiles located at Y = 0.2 m, Y = 1.0 m and Y =1.4 m with reference to the experimental data are also calculated and given in Table 1.
In order to compare velocity and droplet concentration field with experimental data obtained in laboratory, four profiles are extracted at different locations in the model room. Locations of the four profiles are given in Table 2.
The velocity component v in y direction in location 1, 2 and 3 are compared with the experimental results which are shown in Figure 5, Figure 6 and Figure 7 respectively. The droplet dimensionless concentration distribution at location 4 is drawn in Figure 4. The droplet concentration is nondimensionalized by the 2.5 × 10¹⁰.
The mesh sensitivity analysis is accomplished by comparing the numerical and experimental results based on three different types of grid (Types 1-3), the grid number of each type is given in Table 1. To evaluate the convergent ratios of the simulated results over N points in the region of interest, the following ratio is introduced:
Where denotes the averaged values, δ are differences between the finer and coarser meshes, and denote the L2-norms of the solutions changes for the grid types 2-3 and 1-2, with , where the superscript i is the index of the points interest and N is the total number of points considered.
The grid convergence is confirmed if 0 < R < 1. Thus, for the droplet dimensionless concentration at location 4, with and . Considering the droplet concentration errors Ec, the velocity v component errors Ev (Table 1) and the computational expenses, the grid of type 2 was preferred. Therefore, the following model of full-scale aircraft cabin uses the same grid density of the grid type 2.
Numerical Observation of Droplet Concentration Transport in Civil Aircraft Cabin
In this section, the validated numerical model is used to conduct droplet concentration transport simulation in a seven-row and fully occupied aircraft cabin as shown in Figure 8. The possible infectious passengers 1, 2 and 3 are marked by red color in Figure 9. In this paper, only one of them will exhale the droplets containing the pathogen in each simulation. Two inlets are at the carrier of the aircraft cabin delivering air into the cabin, while there are Personalized Ventilation (PV) inlets above the head of each passenger. The main objective of the PVs system is to bring passengers individual airflow control and deduce the entrance of the droplet containing virus in the occupant breathing zones. As dedicated by Duguid [22] and Chao, et al. [23], about 98% of the expiratory droplet size distributes between 2 μm and 100 μm, and most of droplets vary from 4 μm to 8 μm. Hence, the falling velocity is also neglected in this case. The air is extracted from two outlets located on the side walls near the floor level as shown in Figure 8. The width of a seat is 0.51 m. The distance between seats is 0.51 m. The space of the aisle and the rows is 0.56 m and 0.82 m respectively. The height of a seated passenger is 1.20 m. The 2D meshes on the surfaces of human bodies and chairs are shown in Figure 10. The time step of the transient simulation is 0.06 s.
Hypermesh was used to build the grid over the complex cabin and human body surfaces. The type 2 gird in the validated model is used to discretize the space inside aircraft cabin. Total 3400 million tetrahedral elements are contained in this model. The 2D meshes on the human bodies and chairs are shown in Figure 10. The boundary conditions in the aircraft cabin model are copied from the validated model. A mouth opening of 4.38 cm2 is used for the index patient. The transient droplet concentration spread simulations use the steady state flow field as the initial flow field in aircraft cabin. The detailed boundary setting for the cabin model is given in Table 3. Figure 11 shows the velocity profile at the mouth for the infected passenger in one period drawn according to the Eq. (6) and Eq. (7) while Figure 12 gives the simulated velocity distribution around the infected patient (3C) at t = 0.25 s.
The simulated maximum velocity of the jet-like flow generated by the cough action of the infected patient is about 8.3 m/s at t = 0.25 s, meanwhile the virus droplets are exhaled following the jet-like flow. The transient evolutions of the virus droplet concentration are shown in Figure 13 and Figure 14.
The virus droplets are exhaled by an infected passenger at coordinate 3C. The droplet concentration arrives the passenger mouth at coordinate 2C before the infected one at around 4.1 s while it reach the 4C at about 7.8 s after the cough action of the infected passenger in Figure 13. It is also found that the aircraft cabin is full of droplet concentration in longitudinal direction at about 27 s after the cough from the infected person while the aircraft cabin is full of droplet concentration in transverse direction at about 18 s after the cough in Figure 14. It is revealed that the virus concentration could transport faster in transverse direction than in longitudinal direction. That is caused by the circulations of the air conditioning system. The turbulence structures are formed at approximate of the nose of the index patient, which could keep part of the droplets exhaled by the index patient inside the turbulence structure. That is the reason why the droplet concentration immediately before the nose is higher than that far away from the nose. The droplet could spread several rows away from the index patient in longitudinal direction. It explains that why the passenger sitting several rows away from infected patient was infected by SARS virus in the flight from Hong Kong to Beijing [5].
Figure 15 and Figure 16 give the virus droplet transport in longitudinal and transverse directions respectively when the infected passenger is in close proximity to the lateral wall of the aircraft cabin. In Figure 16, it is found that the virus droplet is full of the transverse section when time is about 30.7 s which is lower 12 seconds compared with Figure 14. As for the virus droplet transport in longitudinal direction, it is also found the virus droplet transport in longitudinal direction is about 6 seconds slower compared the Figure 15 with Figure 13. Hence the position of the infected patient has impact on the virus droplet transport speed.
Conclusions
In the paper, the expiratory droplets containing the pathogens are considered as a single phase coupled with airflow to investigate the virus transmission phenomenon in the aircraft cabin. Firstly, the numerical model is validated with the experimental results. The simulated results agree well with the experimental results. The grid sensitivity is also analyzed with three different types of grid. The proper grid density is applied to the following model.
Then the numerical model is applied to a fully-occupied and single-aisle civil aircraft cabin with seven-rows. It is found that the droplet concentration could be transported faster in transverse direction than in longitudinal direction, meanwhile the position of the infected patient has impact on the droplet transport speed. It is also revealed why the passenger sitting several rows away from infected patient was infected by SARS virus during the flight from Hong Kong to Beijing. From the physical point of view, the phase of expiratory droplets could be carried far away from the source by airflow, meanwhile part of droplets could be constrained at a certain place by the turbulence structures. In the paper, the results tried to explain the impact factors on the droplet transmission from the multiphase point of view in the aircraft cabin, where airborne route dominates the transmission in aircraft cabin. For further investigations, the risk of infection of the passengers due to the direct or indirect contacts could be determined by the deterministic and probabilistic approaches.
Acknowledgment
The work described in this paper was supported by a grant from National Natural Science Foundation of China (No:11402307).