
International Journal of Astronautics and Aeronautical Engineering
(ISSN: 2631-5009)
Volume 6, Issue 1
Original Article
DOI: 10.35840/2631-5009/7548

Article Formats
Research and Development of Wireless Sensor Network for Gas Monitoring
Table of Content
Figures
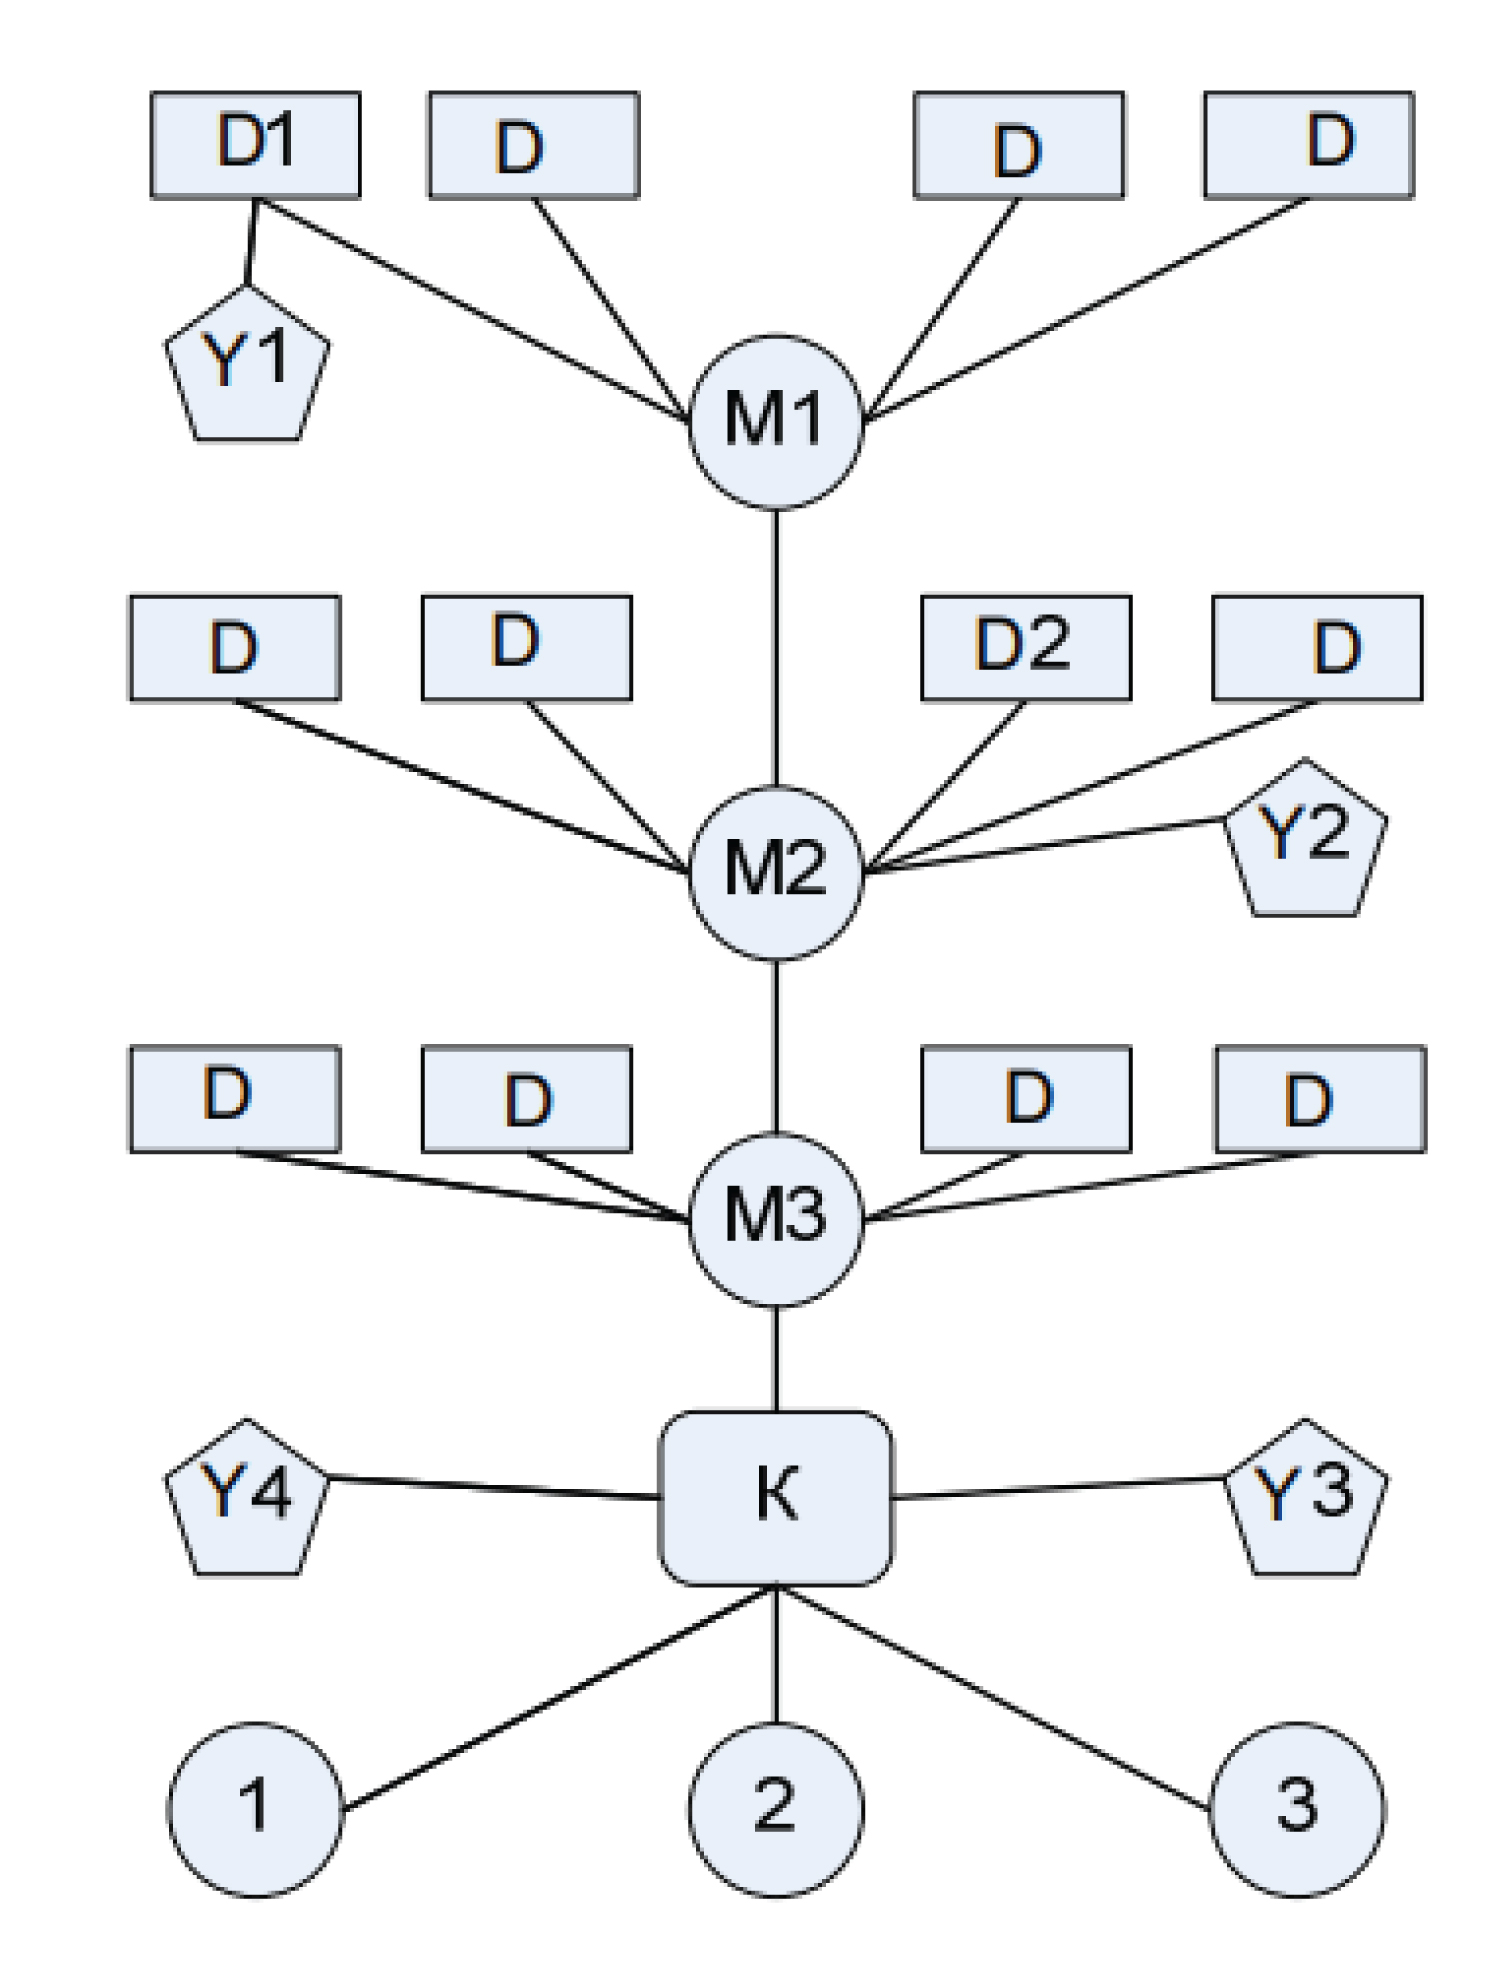
Figure 1: Block diagram of a wireless sensor....
Block diagram of a wireless sensor network, where: D is a sensor nod; K is a network coordinator; Y is a wireless actuator; M is a wireless router of radio signals; and 1, 2 and 3 are device alarms.
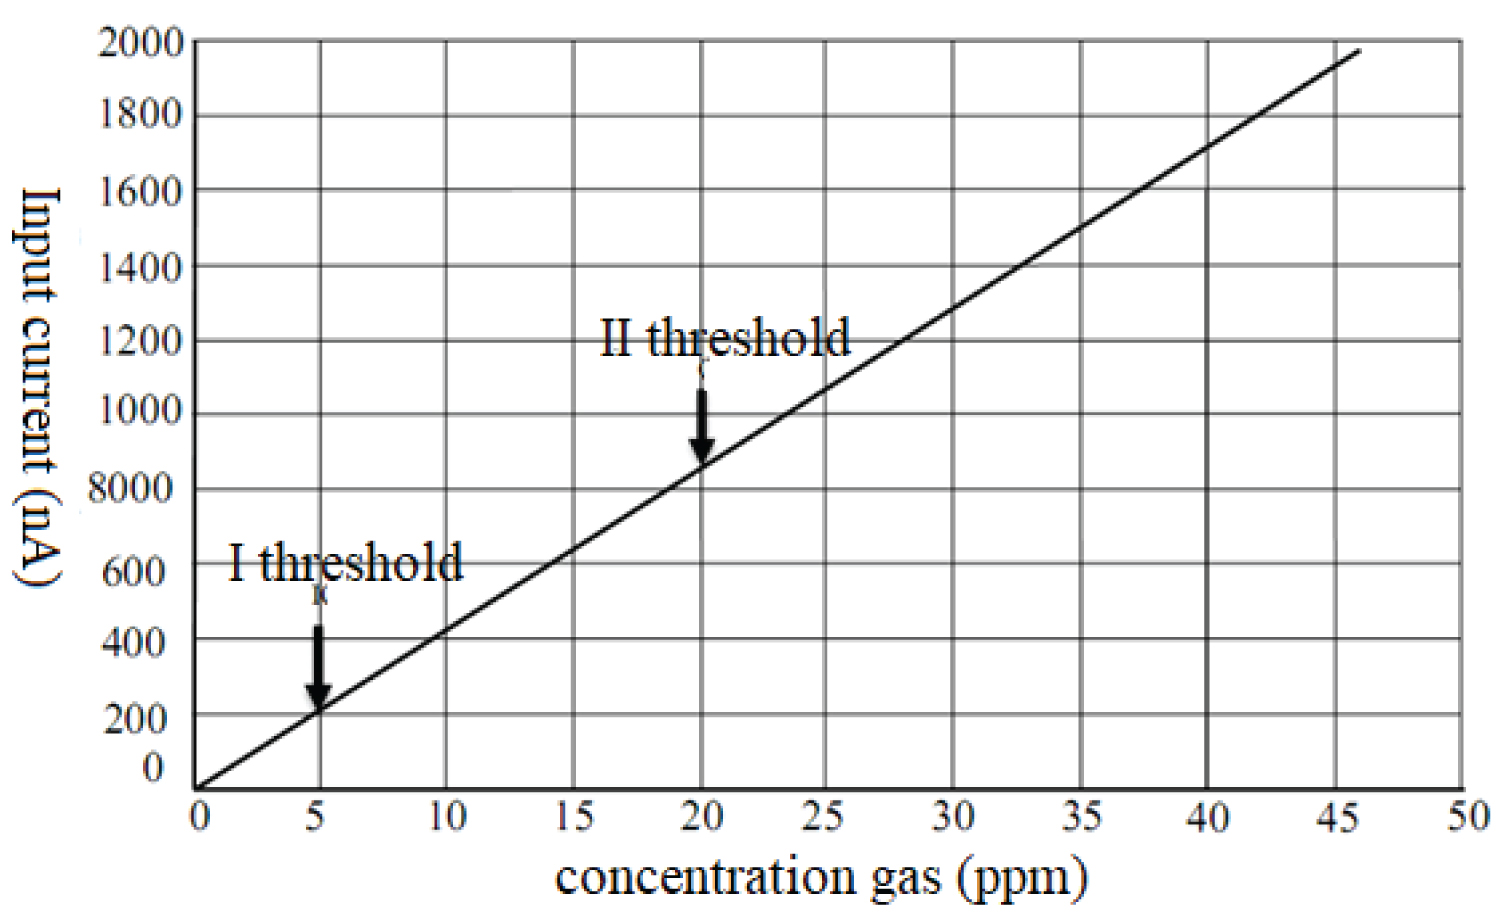
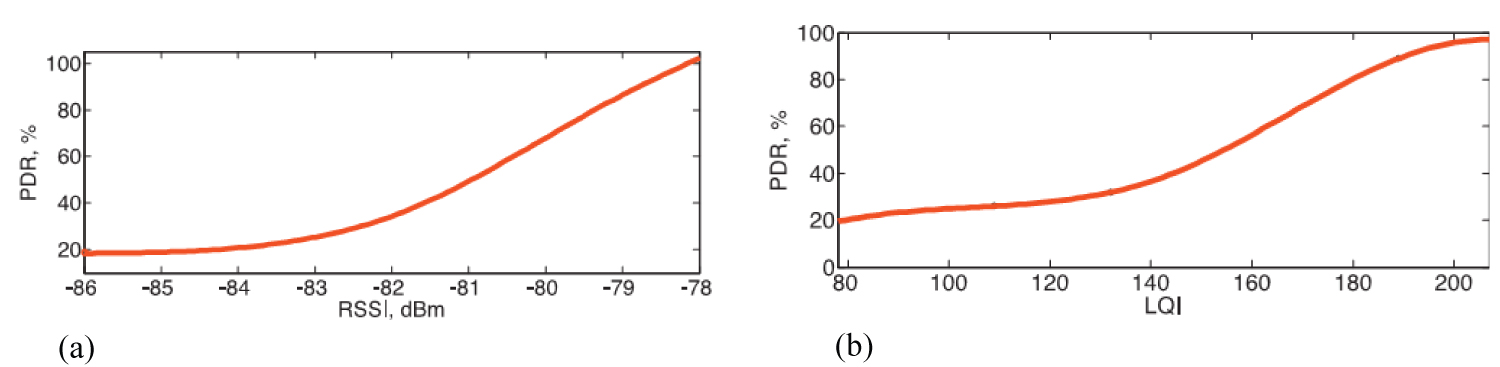
Figure 3: Relationship between: a) RSSI....
Relationship between: a) RSSI and average PDR; b) LQI average PDR.
References
- Somov A, Baranov A, Savkin A, Spirjakin D, Spirjakin A, et al. (2011) Development of wireless sensor network for combustible gas monitoring. Sensors and Actuators A: Physical 171: 398-405.
- Baranov A, Spirjakin D, Akbari S, Somov A (2015) Optimization of power consumption for gas sensor nodes: A survey. Sensors and Actuators A: Physical 233: 279-289.
- Somov A, Baranov A, Suchkov A, Karelin A, Mironov S, et al. (2015) Improving interoperability of catalytic sensors. Sensors and Actuators B: Chemical 221: 1156-1161.
- Makeenkov A, Lapitskiy I, Somov A, Baranov A (2015) Flammable gases and vapors of flammable liquids: Monitoring with infrared sensor node. Sensors and Actuators B: Chemical 209: 1102-1107.
- Samotaev NN, Vasiliev AA, Podlepetsky BI, Sokolov AV, Pisliakov AV (2007) The mechanism of the formation of selective response of semiconductor gas sensor in mixture of CH4/H2/CO with air. Sensors and Actuators B: Chemical 127: 242-247.
- Hayes J, Beirne S, Lau KT, Diamond D (2008) Evaluation of a low cost wireless chemical sensor network for environmental monitoring. In: Proceeding of the IEEE Sensors, 530-533.
- Somov A, Baranov A, Spirjakin D, Passerone R (2014) Circuit design and power consumption analysis of wireless gas sensor nodes: One-sensor versus two-sensor approach. IEEE Sensors Journal 14: 2056-2063.
- Somov A, Baranov A, Spirjakin D (2014) A wireless sensor-actuator system for hazardous gases detection and control. Sensors and Actuators A: Physical 210: 157-164.
- Kim YW, Lee SJ, Kim GH, Jeon GJ (2009) Wireless electronic nose network for real time gas monitoring system. IEEE International Workshop on Robotic and Sensors Environments, 169-172.
- Somov A, Baranov A, Spirjakin D, Spirjakin A, Sleptsov V, et al. (2013) Deployment and evaluation of a wireless sensor network for methane leak detection. Sensors and Actuators A: Physical 202: 217-225.
- (2000) Electrical apparatus for the detection of combustible gases in domestic premises. Test methods and performance requirements. Standard EN 50194: 2000.
- Baranov A, Somov A, Spirjakin D, Akbari S, Passerone R (2016) POCO: 'Perpetual' operation of CO wireless sensor node with hybrid power supply. Sensors and Actuators A: Physical 238: 112-121.
- Bayrakdar ME (2019) A smart insect pest detection technique with qualified underground wireless sensor nodes for precision agriculture. IEEE Sensors Journal 19: 10892-10897.
- Kou G, Lu Y, Peng Y, Shi Y (2012) Evaluation of classification algorithms using MCDM and rank correlation. International Journal of Information Technology & Decision Making 11: 197-225.
- Bayrakdar ME (2020) Exploiting cognitive wireless nodes for priority-based data communication in terrestrial sensor networks. ETRI Journal 42: 36-45.
- Bayrakdar ME (2020) Cooperative communication based access technique for sensor networks. International Journal of Electronics 107: 212-225.
- Kou G, Peng Y, Wang G (2014) Evaluation of clustering algorithms for financial risk analysis using mcdm methods. Information Sciences 27: 1-12.
- Li T, Kou G, Peng Y, Shi Y (2020) Classifying with adaptive hyper-spheres: An incremental classifier based on competitive learning. IEEE Transactions on Systems, Man, and Cybernetics: Systems 50: 1218-1229.
- Phong CT (2017) The development of wireless sensor system for monitoring toxic and combustible gases in the air in industrial plants. Doctoral thesis, Moscow.
- Kou G, Yang P, Peng Y, Xiao F, Chen Y, et al. (2019) Evaluation of feature selection methods for text classification with small datasets using multiple criteria decision-making methods. Applied Soft Computing 86: 105836.
Author Details
Vuong Anh Trung*
Air depence-Air force Academy, Kim Son, Son Tay, Ha Noi, Vietnam
Corresponding author
Vuong Anh Trung, Air depence-Air force Academy, Kim Son, Son Tay, Ha Noi, Vietnam.
Accepted: March 27, 2021 | Published Online: March 29, 2021
Citation: Trung VA (2021) Research and Development of Wireless Sensor Network for Gas Monitoring. Int J Astronaut Aeronautical Eng 6:048.
Copyright: © 2021 Trung VA. This is an open-access article distributed under the terms of the Creative Commons Attribution License, which permits unrestricted use, distribution, and reproduction in any medium, provided the original author and source are credited.
Abstract
This paper presents the design and technological principles of a wireless sensor network (WSN) for continuous monitoring of the concentration of toxic gases, particularly carbon monoxide (CO), in the atmosphere in industrial sites and residential areas. Furthermore, the wireless sensor network transmits the received data through radio channels, having access to GSM and Ethernet telephone networks, and controls the wireless actuators. Autonomous wireless gas sensors for CO monitoring were developed during our work and the prototype of the wireless sensor network for toxic gas monitoring using Zigbee as its data transmission standard is detailed.
Keywords
Autonomous wireless gas sensor node, Carbon monoxide, CO concentration, Wireless coordinator, Wireless sensor networks
Introduction
A wireless sensor network (WSN) considered is a distributed, self-organizing network which comprises miniature computing devices with an autonomous power supply and resistant to failures of individual elements [1,2]. The following parameters are most often the monitoring objects: temperature [3], humidity [4], illumination [5] and gas composition [6].
The main task of wireless sensor networks technology is to develop a WSN with non-volatile sensor modules that can have exclusively autonomous power supply. A more detailed analysis of the problem of non-volatile power supply is presented in [7].
From the point of view of power consumption, the most difficult case in design is a WSN for gas monitoring. In addition, when organizing gas monitoring of toxic gases, catalytic [8], optical [9], semiconductor [10] and electrochemical sensors [11] can be used at the same time. Within a variety of gas sensors, electrochemical sensors stand out in that they practically do not consume electrical energy. This opens up the possibility of their widespread use in wireless sensor networks for environmental monitoring of air composition [12]. At the same time, wireless sensor networks can be deployed in places where there is no access to electrical networks, thus, their autonomous power supply is necessary to ensure the long-term operation.
In this article, a wireless sensor network is designed for automatic control of CO concentration in the atmosphere of industrial premises, inside and on the territory of industrial facilities and protected areas. The WSN can also issue individual alarms and send a notification to the responsible person [10,11]. The paper considers the problem of developing a wireless sensor network to monitor CO concentration and its technical nature.
Description of the Wireless Sensor Network
A diagram of a wireless sensor network installed to monitor CO concentration in production facilities is shown in Figure 1.
The wireless sensor network includes:
- Wireless sensor nodes (WSN) with autonomous power supply (D) [8];
- Wireless routers (M);
- Wireless network coordinator (C);
- Wireless executive devices (Y).
- Alarms of devices 1, 2 and 3 (including, 1 is an emergency rescue service; 2 - responsible persons; 3 - owners of premises)
Wireless network routers act as repeaters of signals from self-powered wireless sensor nodes to the wireless network coordinator (and vice versa). Therefore, wireless routers on the network are always in the standby mode for receiving radio signals. This allows data to be received from the associated wireless gas sensors at any time and thus allows the wireless sensor nodes themselves to be in sleep mode, in which the transceiver consumes virtually no power. Data exchanges between wireless routers and wireless sensor nodes occur at the time of alarm or during the service mode of data exchange [9].
For data transmission, all the devices of the wireless sensor network are equipped with transceivers (Zigbee modems) operating at 2.4 GHz [12-14].
Algorithm of the Wireless Sensor Network
Wireless sensor nodes operate in a 2-threshold measurement mode. The first response threshold (warning) is when CO concentration reaches 5 mg/m3 and the second threshold (alarm) is CO concentration reaches 20 mg/m3. The sensor is calibrated in the range of 5-20 mg/m3 of CO concentration, depending on the operating conditions, but at least once a year [12]. Figure 2 shows the dependence of the sensor output current on the CO concentration.
The operation of the wireless sensor network in a standard situation is carried out according to the following algorithm:
The wireless sensor nodes measure CO concentration (D in Figure 1). In order to save energy, the measurements of CO concentration are carried out in periodic mode: Measurement mode-sleep, mode-measurement mode. The duration of the measurement mode is about 1s. The duration of the sleep mode is in the range from 10 to 60s. In this case, all elements of the sensor function in the measurement mode, except for the ZigBee modem, which is in sleep mode. If the concentration of CO is less than 5 mg/m3, the microcontroller switches the sensor to the power saving mode (sleep mode), data transmission to the network coordinator (K in Figure 1) is not carried out.
The operation of the wireless sensor network in an emergency situation is carried out according to the following algorithm:
If the CO concentration value measured by the wireless sensor is in the range of 5 mg/m3-20 mg/m3, then the BSU microcontroller switches the ZigBee modem to the transmission mode, generates and sends a data packet to the router (M, in Figure 1), which, in turns, sends the data further to the network coordinator. In addition, the corresponding light and sound signals of the BSU itself is turned on. After receiving confirmation of successful delivery, the BSU modem goes into sleep mode.
If the CO concentration value measured by a wireless sensor, for example D1, is higher than 20 mg/m3, then the BSU microcontroller switches the ZigBee-modem to the transmission mode and sends a command to the executive device associated with it (Y1) via the wireless network, and having received confirmation of execution, generates and sends the data packet to the router (M1, in Figure 1), which, in turns, forwards the data further to the network coordinator. The transmitted data necessarily includes the information that allows the operators to identify the sensor in which they were sent. In addition, the corresponding light and sound signals of the wireless gas sensor itself is activated. Likewise, after receiving data from a wireless sensor, for example D1, the router issues a command to the executive device associated with it (Y1), and having received a confirmation of execution, sends a data packet to the network coordinator.
The network coordinator, after receiving data on exceeding the gas concentration in one or more rooms and data on the actions already performed from the executive devices, issues a command to the executive devices (Y3) and (Y4) associated with him [if any] and, having received confirmation of execution commands, generates and sends a data packet to the appropriate emergency rescue service (1 in Figure 1) (in particular, to display information on the control panel of an automated workstation), to responsible persons (2, Figure 1), as well as to the owners of premises (3, Figure 1). In addition, the received data is stored in an internal or external memory.
Response Time to Gas Composition Measurement
One of the most important parameters for a system that monitors CO concentration is the time it takes to react when the CO concentration in the environment changes dramatically.
For some devices, this time is prescribed by the existing standards for gas indicators. In the case of a distributed wireless system, this parameter, obviously, should be estimated for the system as a whole. For gas alarm systems that includes light and sound alarms with the ability to activate a disconnecting device (in our case, it is a wireless drive), an alarm delay of up to 120 seconds is allowed [10].
The response time of the system, denoted by tO, depends on the measured time (tI) and the time required to transmit data over the wireless channel (tP)
tO = tI + tP
At the same time, we can change the response time of the sensor assembly by changing the measurement interval in order to minimize power consumption.
The time for transmitting data over the wireless network depends on the time for the network service (ty), the time for communication through one wireless router (tM), and the total number of wireless routers required to transfer data to the coordinator. It should be noted that the time also includes the time to save data in memory before it is transmitted to the next wireless router. In order to obtain the most objective data and estimate the worst-case scenario, the response time of the sensor node should be measured for the maximum possible number of wireless routers, which, for the TG-ETRX3 module, is 30 [11,15,16]:
tP = tУ + 30 tM
As a result, the data transmission time (along with the acknowledge receipt) over the wireless network is about 347 ms (determined empirically). As will be shown below, the data transmission time is much lower than during the measurement and the interval between measurements, so if the transmission is affected by packet loss, which requires retransmission, the total time will not be significantly affected. Since the data transmission component tP is small compared to the overall response time requirements, in practice, the response time tO dominates the measurement time tP, which we can adjust the measurement cycle by exchanging the response time and power consumption.
The CO wireless sensor network uses ZigBee data transmission technology. To assess wireless communication lines, we use the received signal strength indicator (RSSI) and the link quality indicator (LQI). Received signal strength indicator, RSSI - total power of the signal received by the receiver. Measured by the receiver on a logarithmic scale in dBm. The LQI signal quality indicator is a metric of the current received signal quality. LQI indicates the ability of a signal demodulated on a scale of 0-255 [17,18]. Next, we evaluate the packet delivery performance from a node sensor to a network coordinator. The node sends about 10,000 data packets with 20 time intervals between submissions. Figure 3a and Figure 3b plot the packet delivery rate (PDR) values in the relation with RSSI and LQI. Good connectivity (PDR > 80%) can be achieved when the RSSI is above -79.3 dBm and the LQI is above 180.4. It is worth noting that when the LQI is around 210, the PDR reaches almost 100% speed.
Conclusions
The paper developed a wireless sensor network for monitoring CO concentration and its technical nature. We noticed that for automatic control of CO concentration in the BSS, wireless gas sensors with exclusively autonomous power supply are used and can operate as part of wireless sensor networks without replacing the power source during their lifetime service-7 years [19].
For data transmission in wireless sensor networks, the IEEE 802.15.4 standard and the ZigBee high-level network protocol have been developed. Its software and hardware interface, unlike conventional radio channels, allows you to create sensor networks from an almost unlimited number of devices. Experimental results show that secure data transmission can be realized up to 100 m in direct line and street conditions [19,20].
In the future, it is planned to consider the possibility of using the energy of renewable sources to power the functional devices of the WSN.