
International Journal of Astronautics and Aeronautical Engineering
(ISSN: 2631-5009)
Volume 5, Issue 2
Original Article
DOI: 10.35840/2631-5009/7541

Article Formats
Insight into Genaveh 11-29 Runway Geometric Redesign Based on Meteorological Synoptic Data
Table of Content
Figures
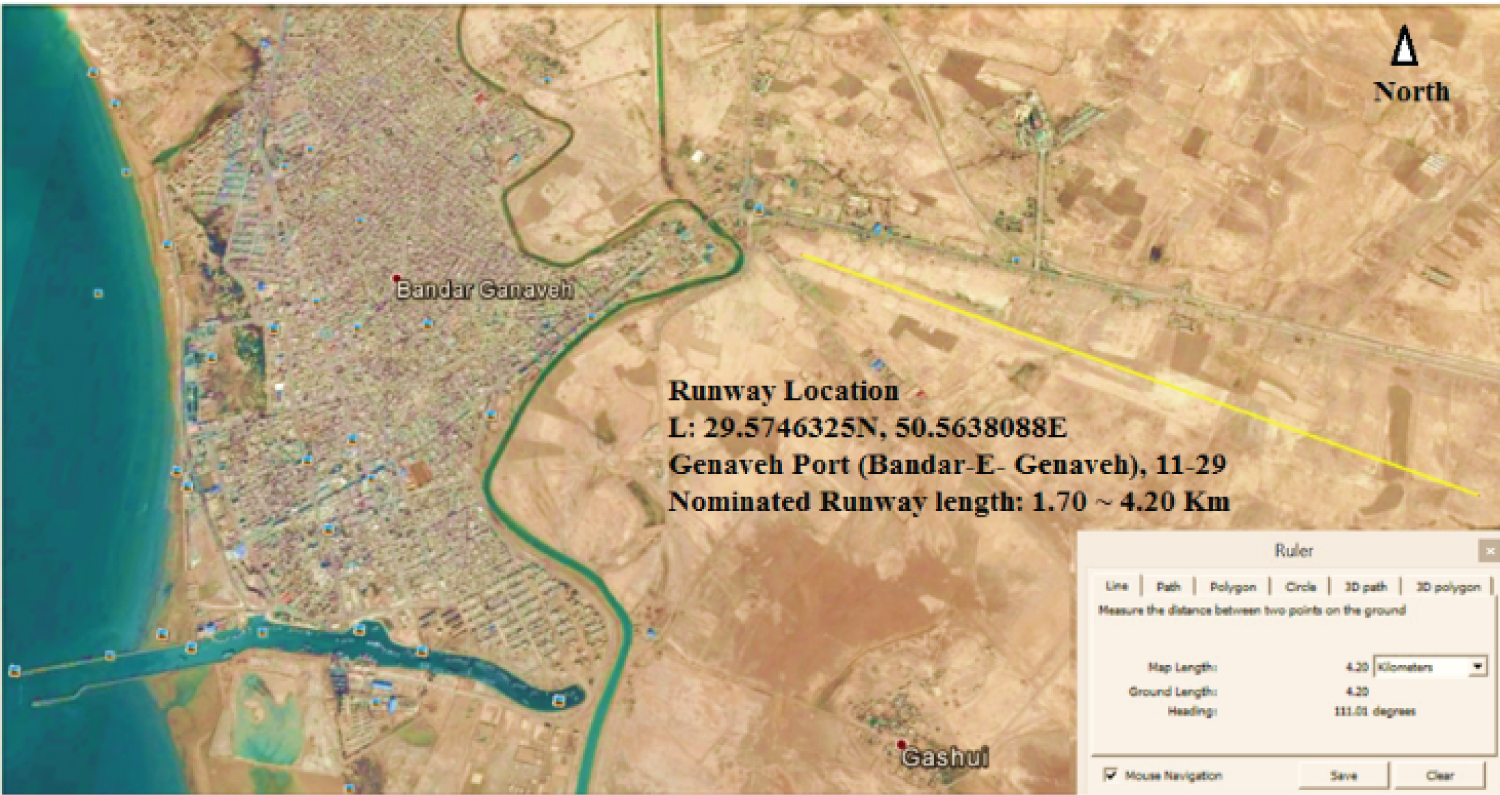
Figure 1: Genaveh runway satellite view, heading direction....
Genaveh runway satellite view, heading direction 11-29 (110-290 degrees), Lon: 29.5746325 N, Lat: 50.5638088 E, nominated runway length (yellow line) = 1.70 ~ 4.20 km.
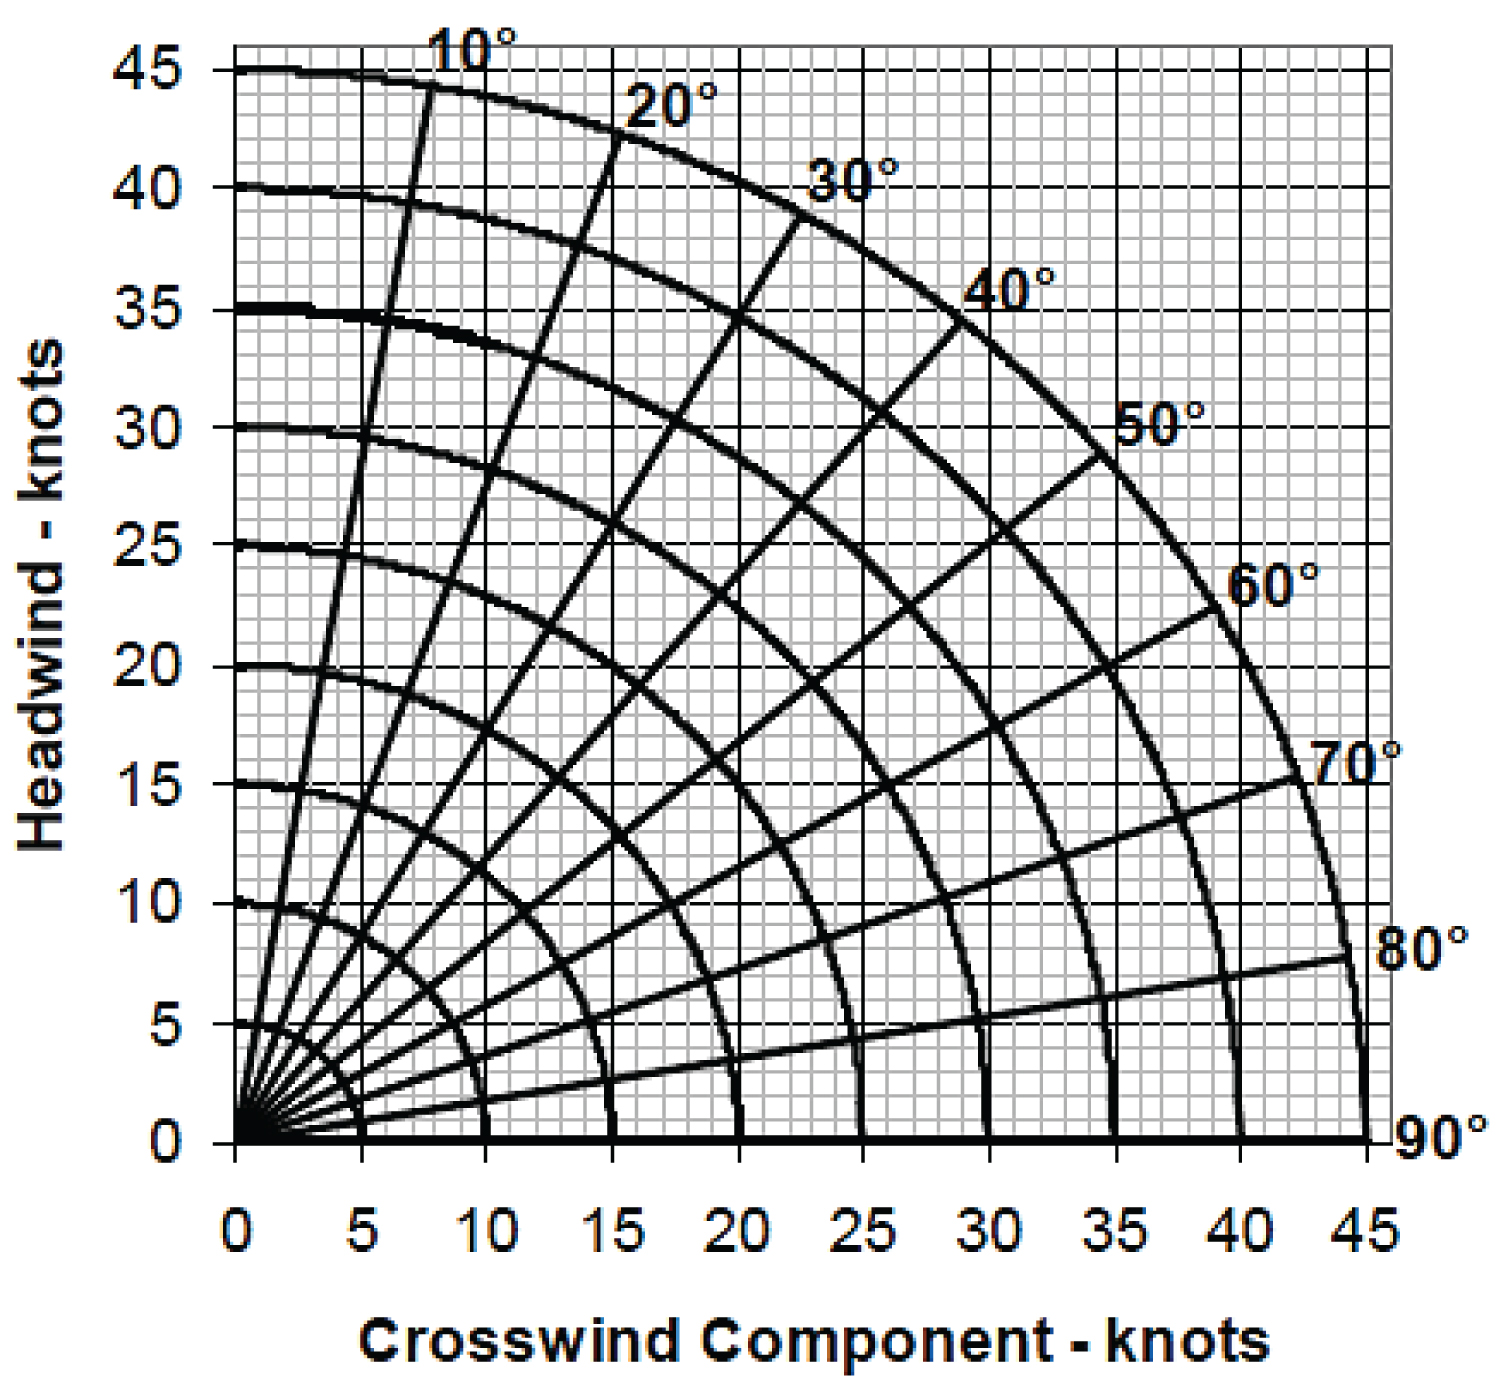
Figure 2: Wind component according to the difference.....
Wind component according to the difference between the runway orientation and the wind direction.
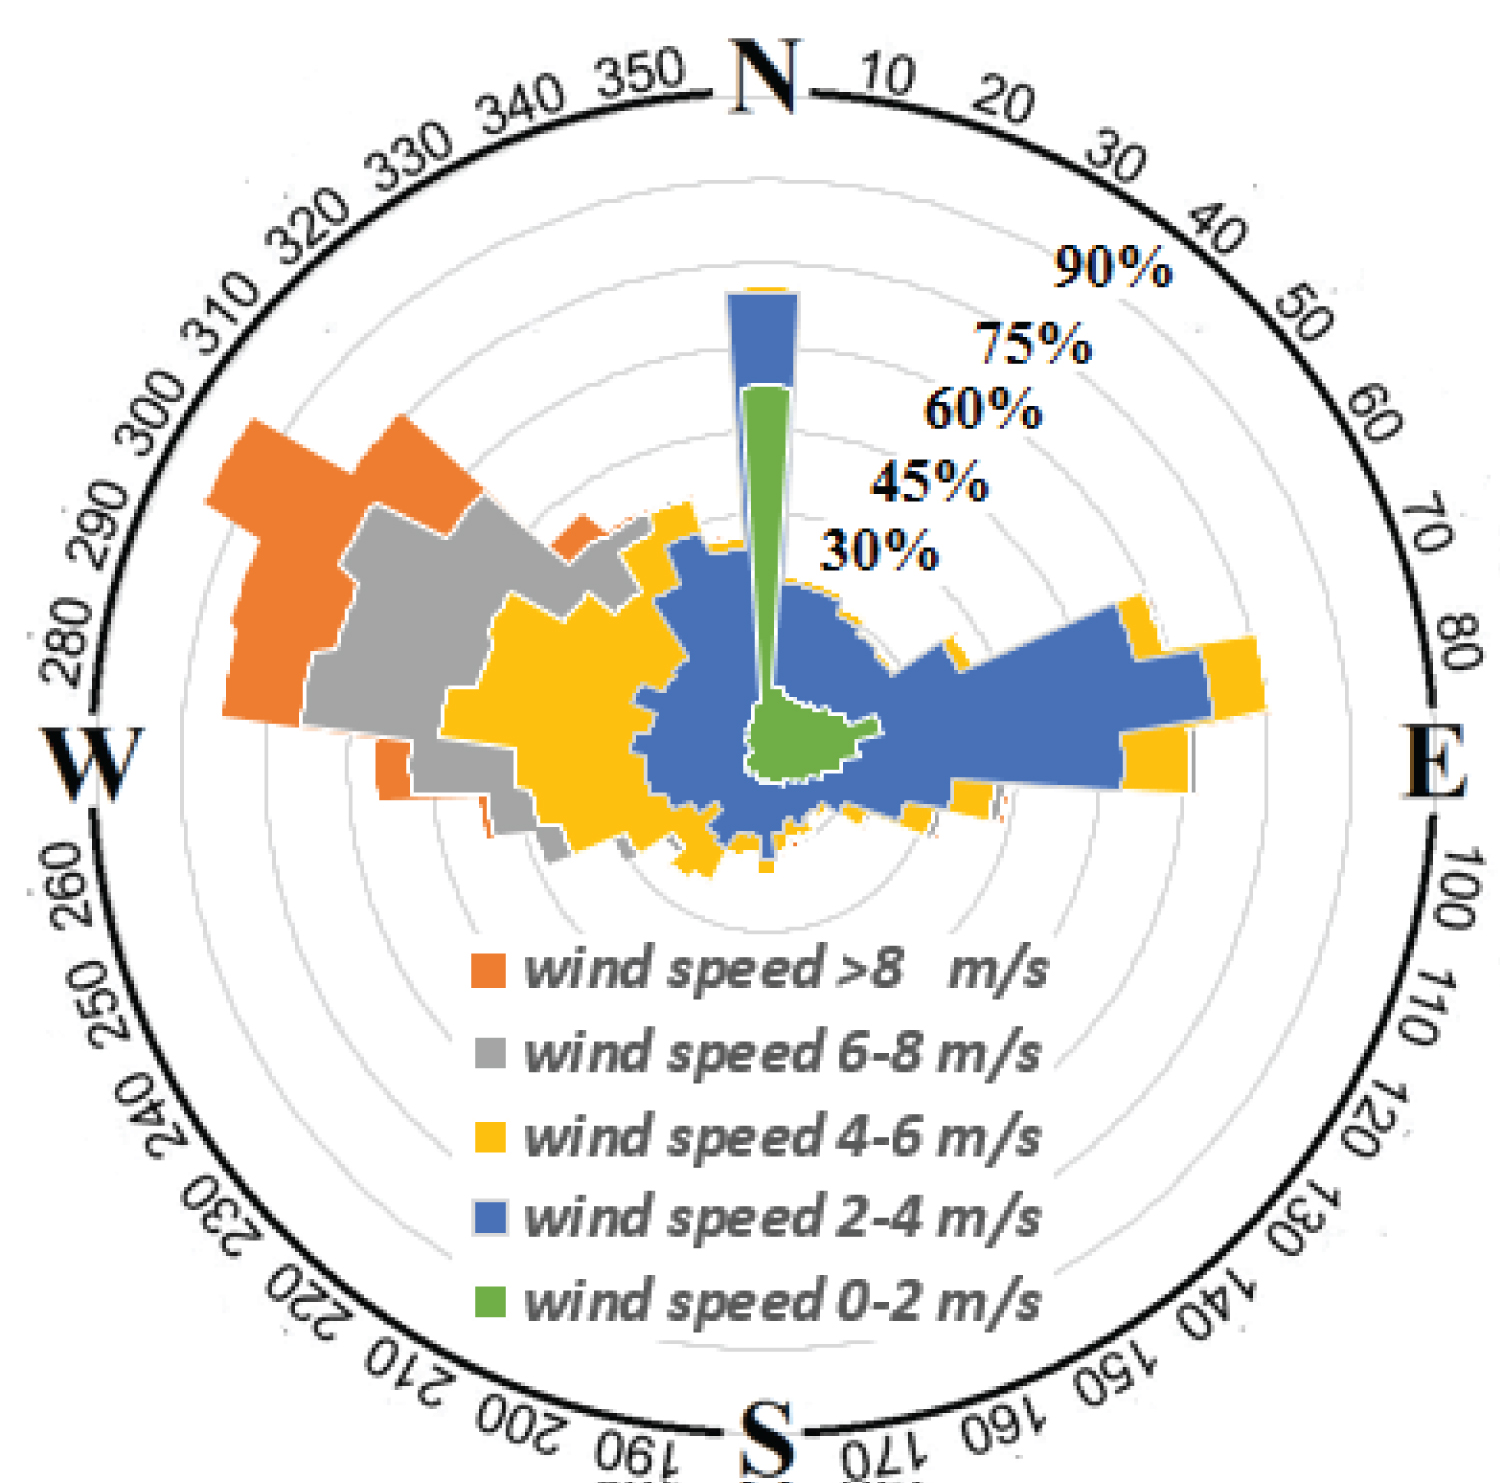
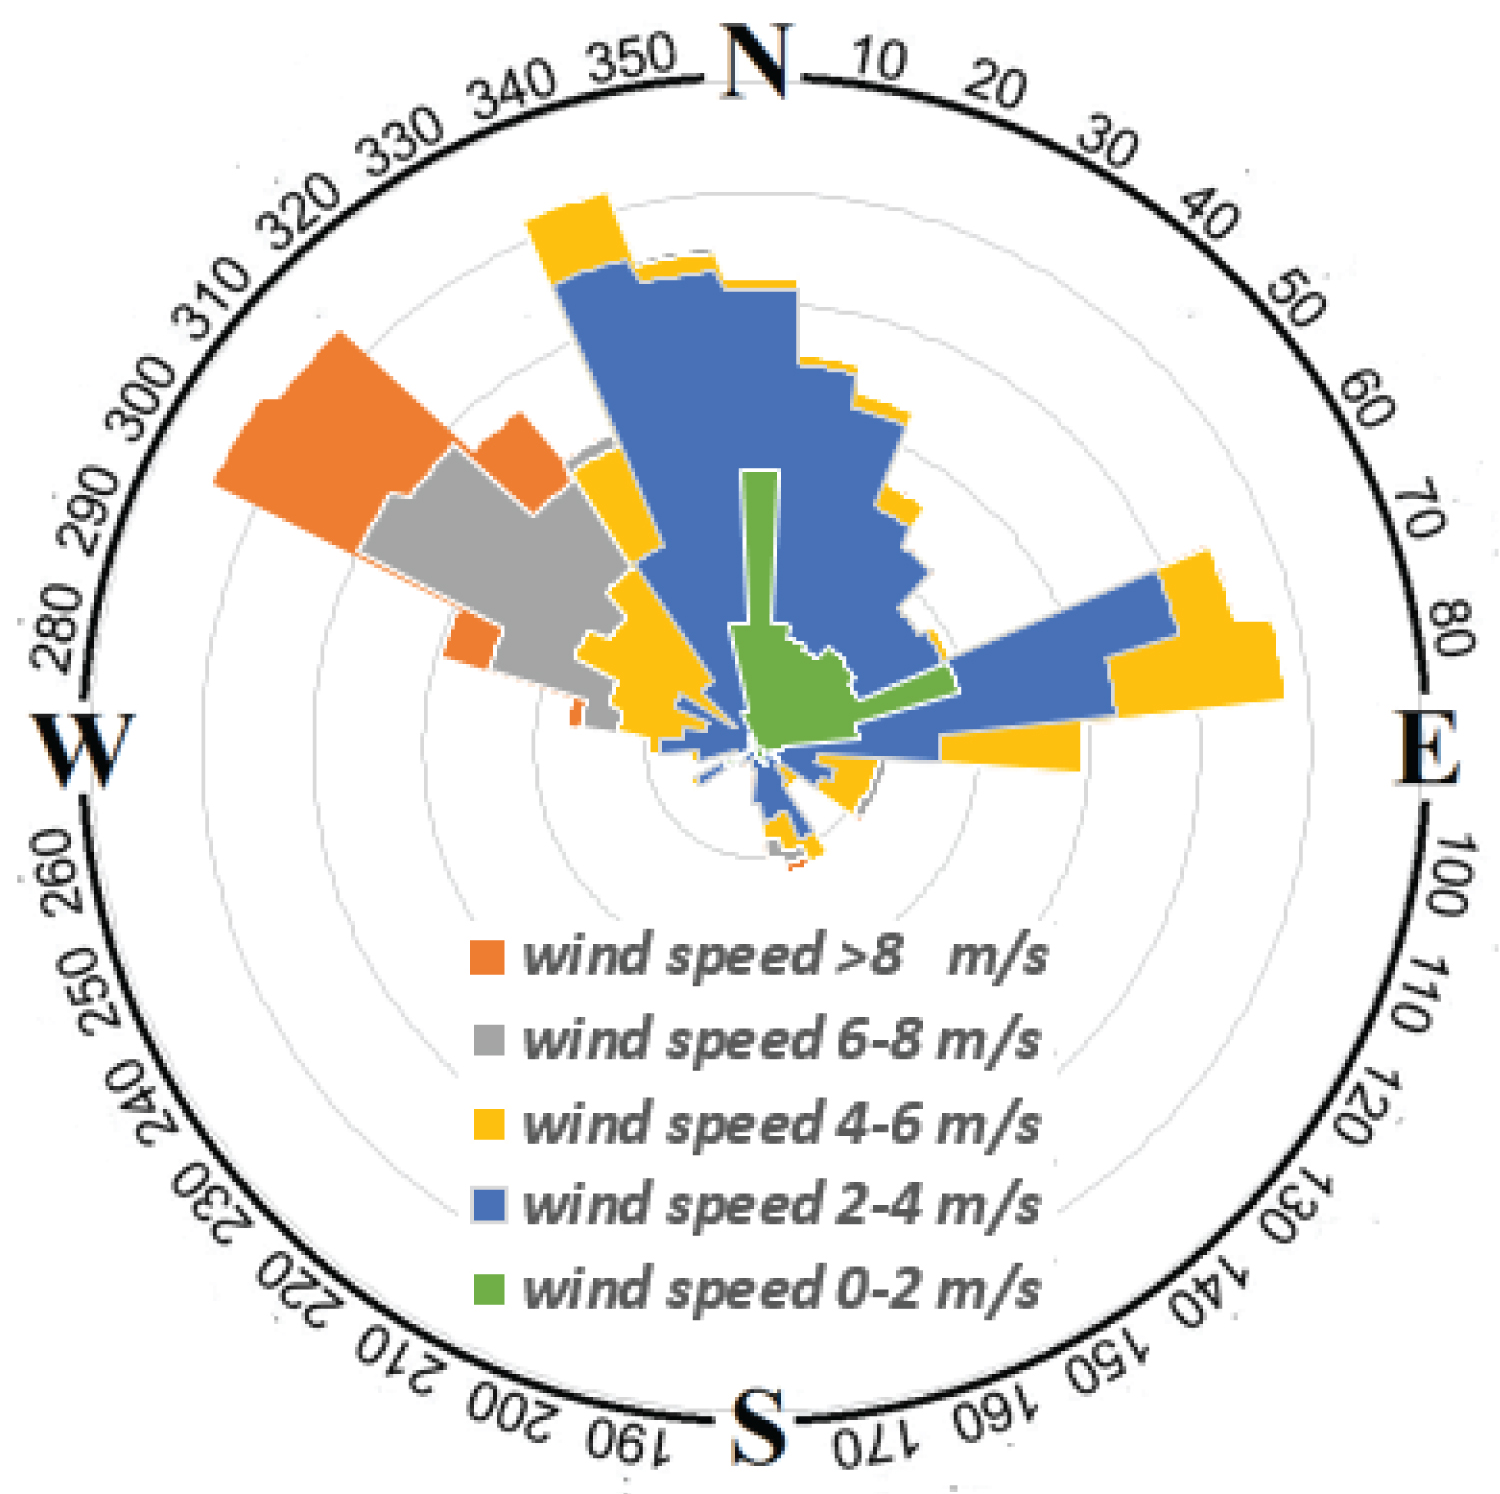
Figure 4: Genaveh airport wind roses diagram based....
Genaveh airport wind roses diagram based on winter data, 2014-2018.
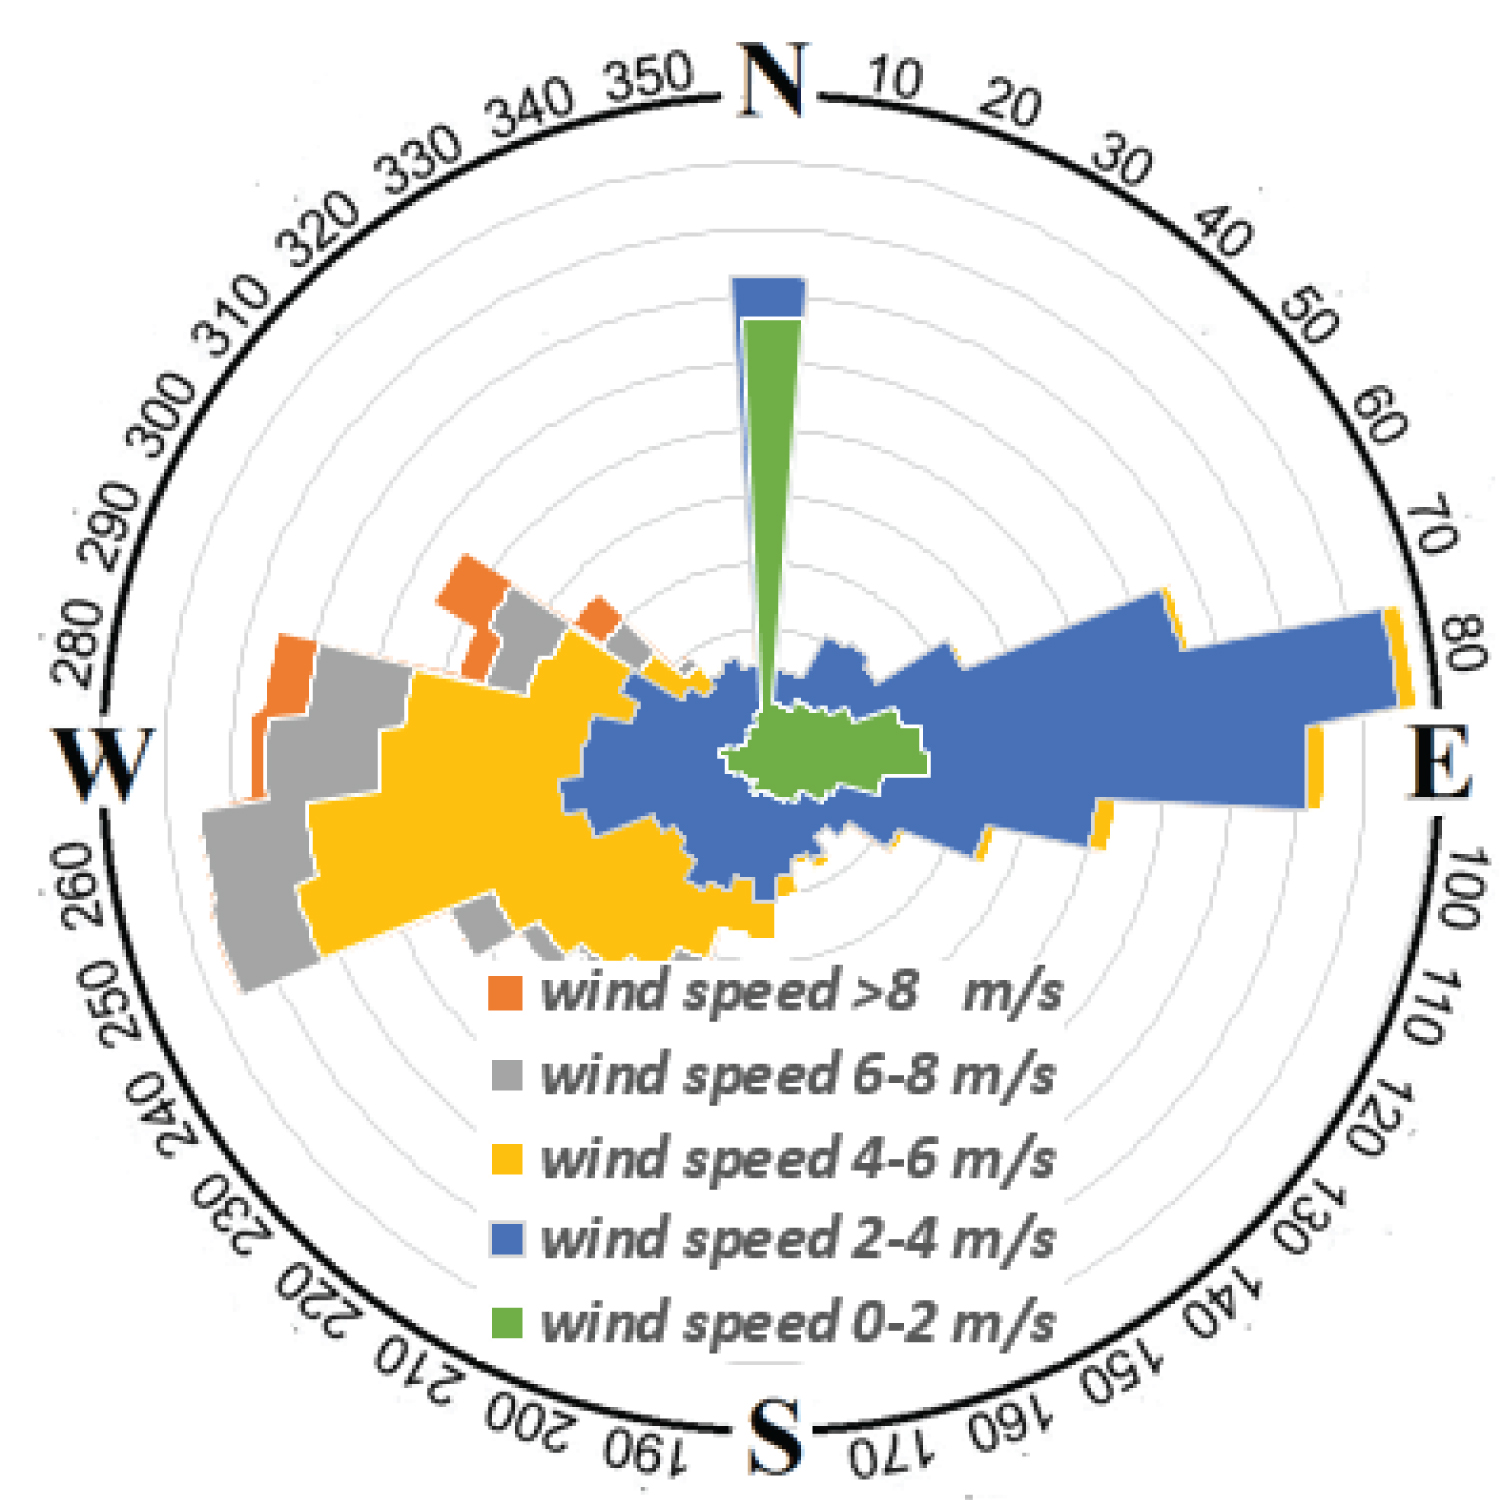
Figure 5: Genaveh airport wind roses diagram based....
Genaveh airport wind roses diagram based on summer data, 2014-2018.
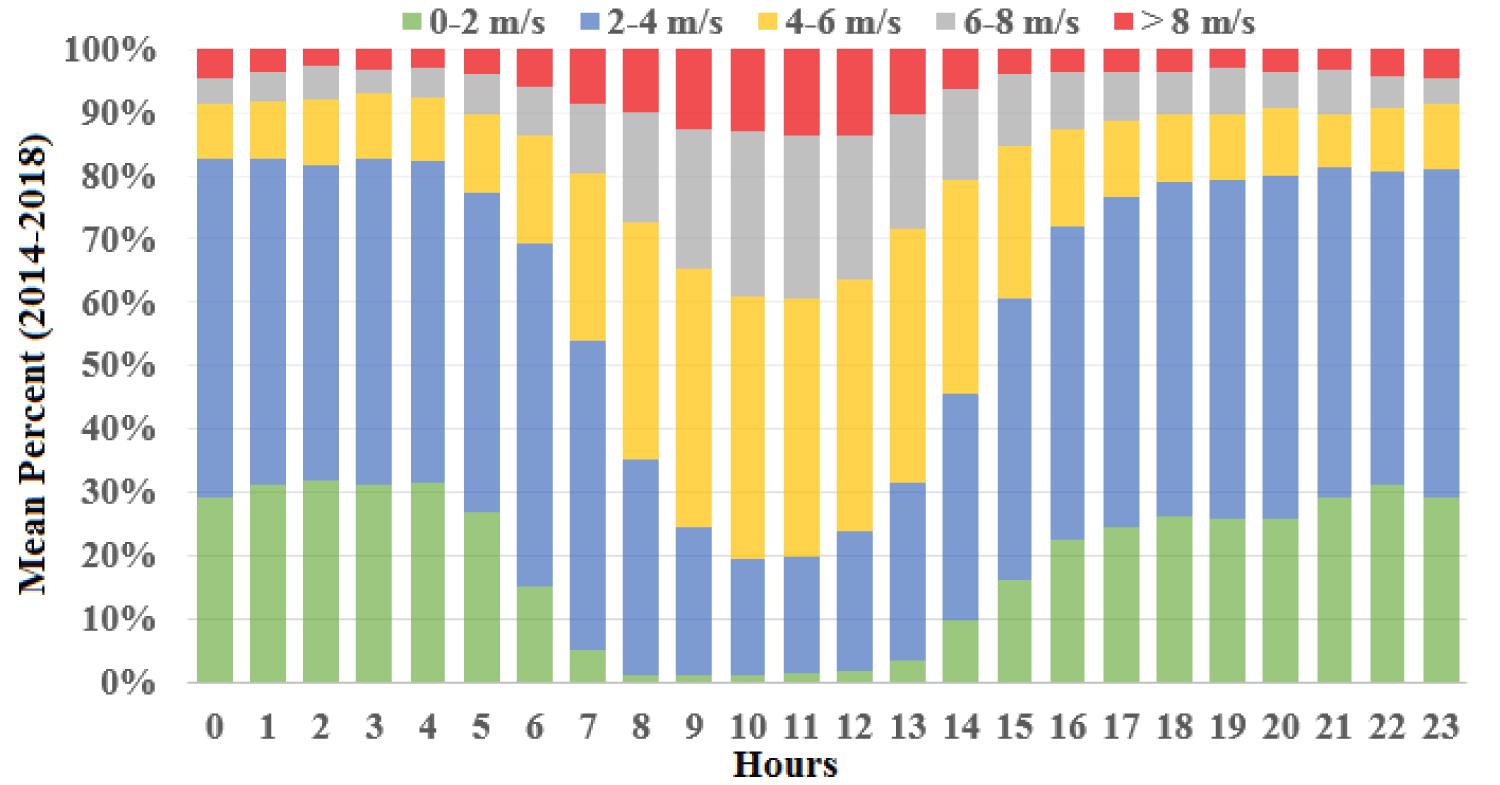
Figure 6: Average hourly wind speed distribution from 2014....
Average hourly wind speed distribution from 2014 to 2018 for the Genaveh airport.

Figure 7: Average hourly wind direction distribution...
Average hourly wind direction distribution from 2014 to 2018 for the Genaveh airport (00 from the bottom to 35 in top of each bar).
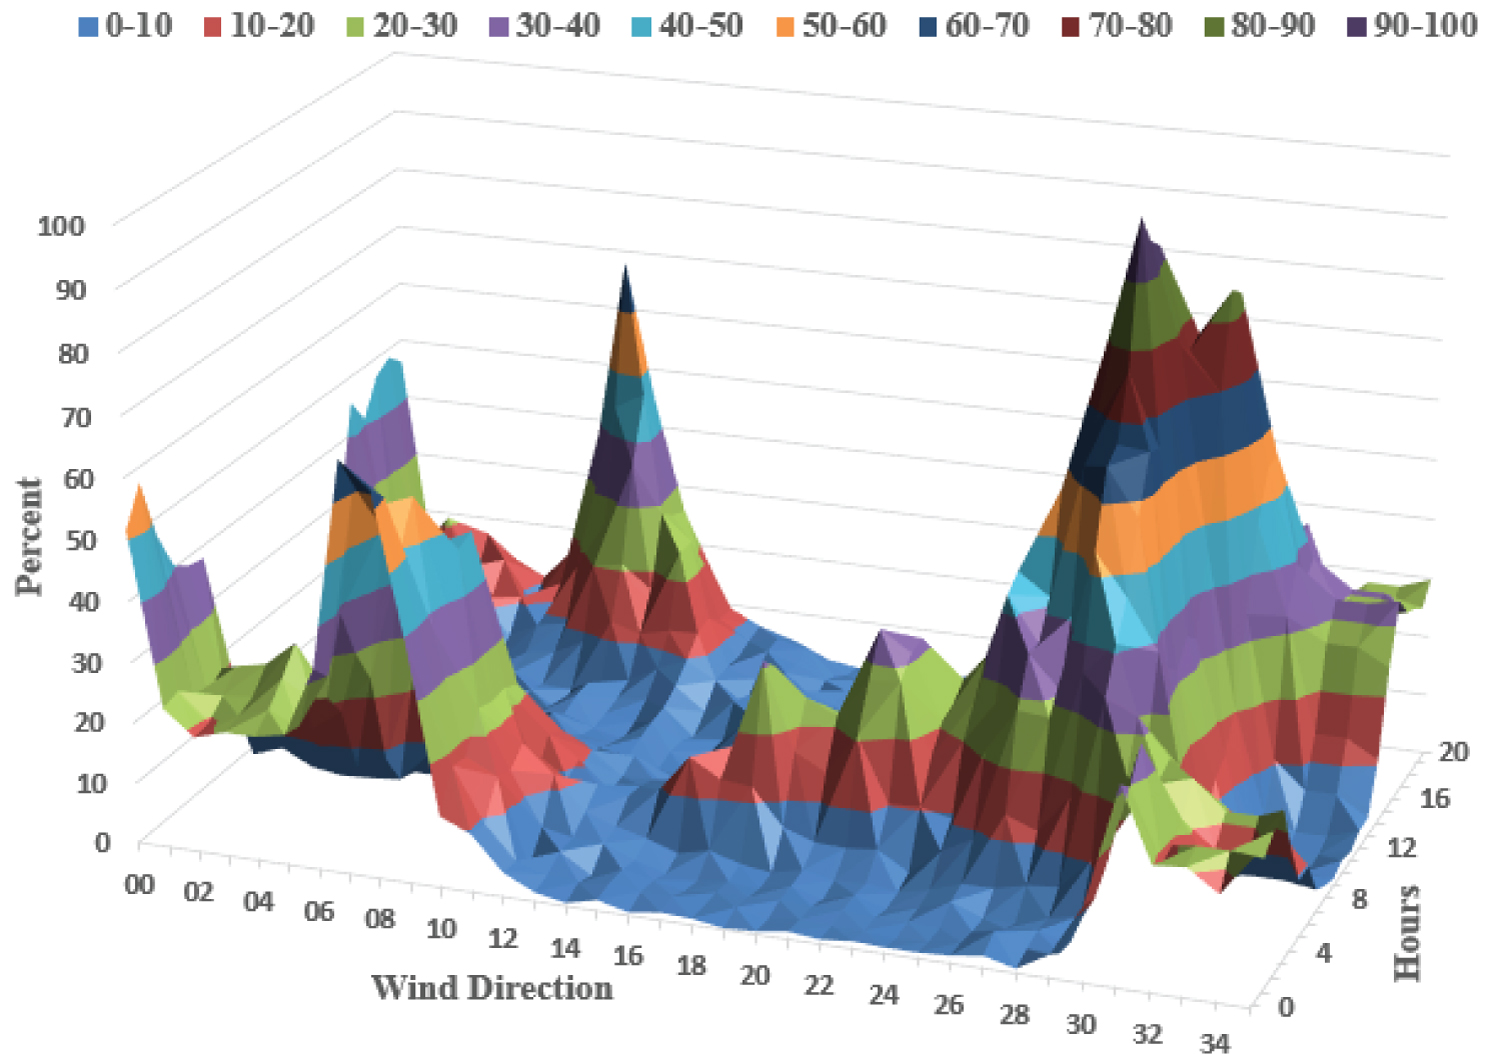
Figure 8: Average wind hour distribution from 2014...
Average wind hour distribution from 2014 to 2018 for the Genaveh airport.
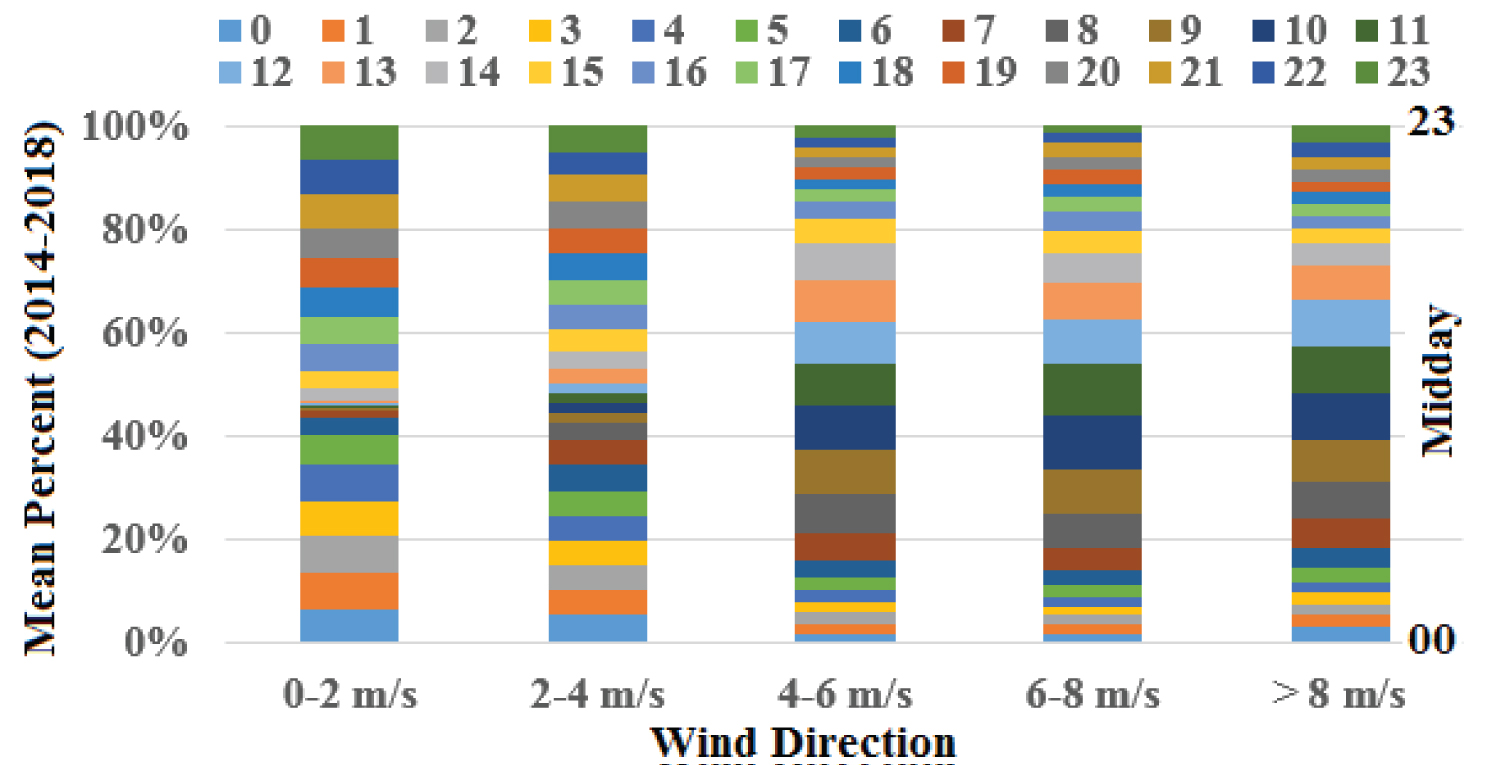
Figure 9: Average hourly wind speed distribution from....
Average hourly wind speed distribution from 2014 to 2018 for the Genaveh airport.
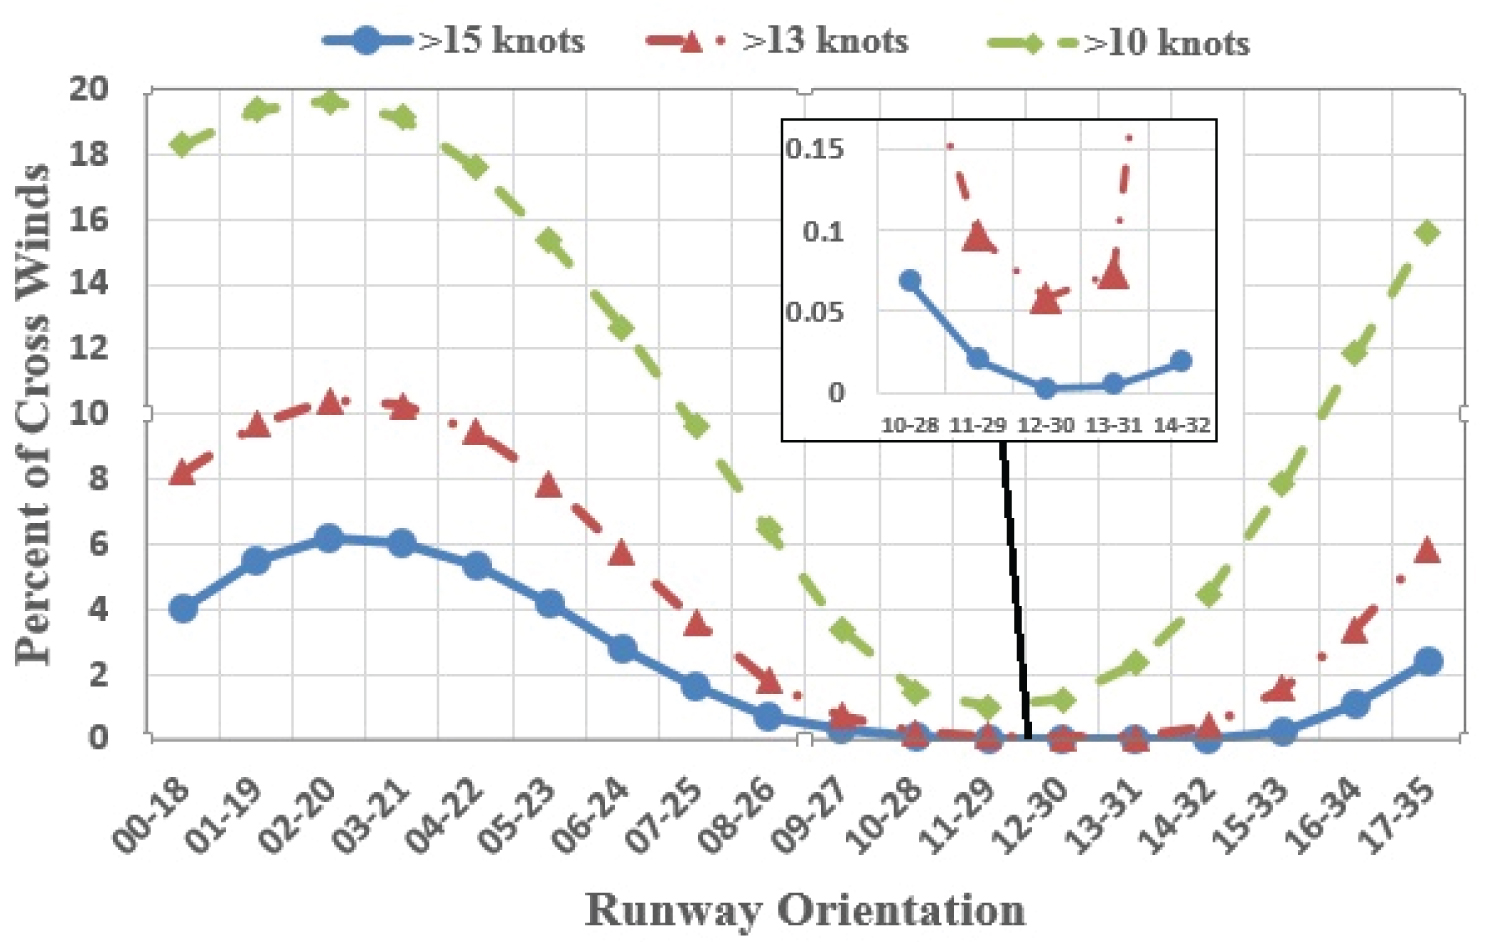
Figure 10: Genaveh peak crosswind components percentage...
Genaveh peak crosswind components percentage of frequency of exceed anceversus runway orientation.
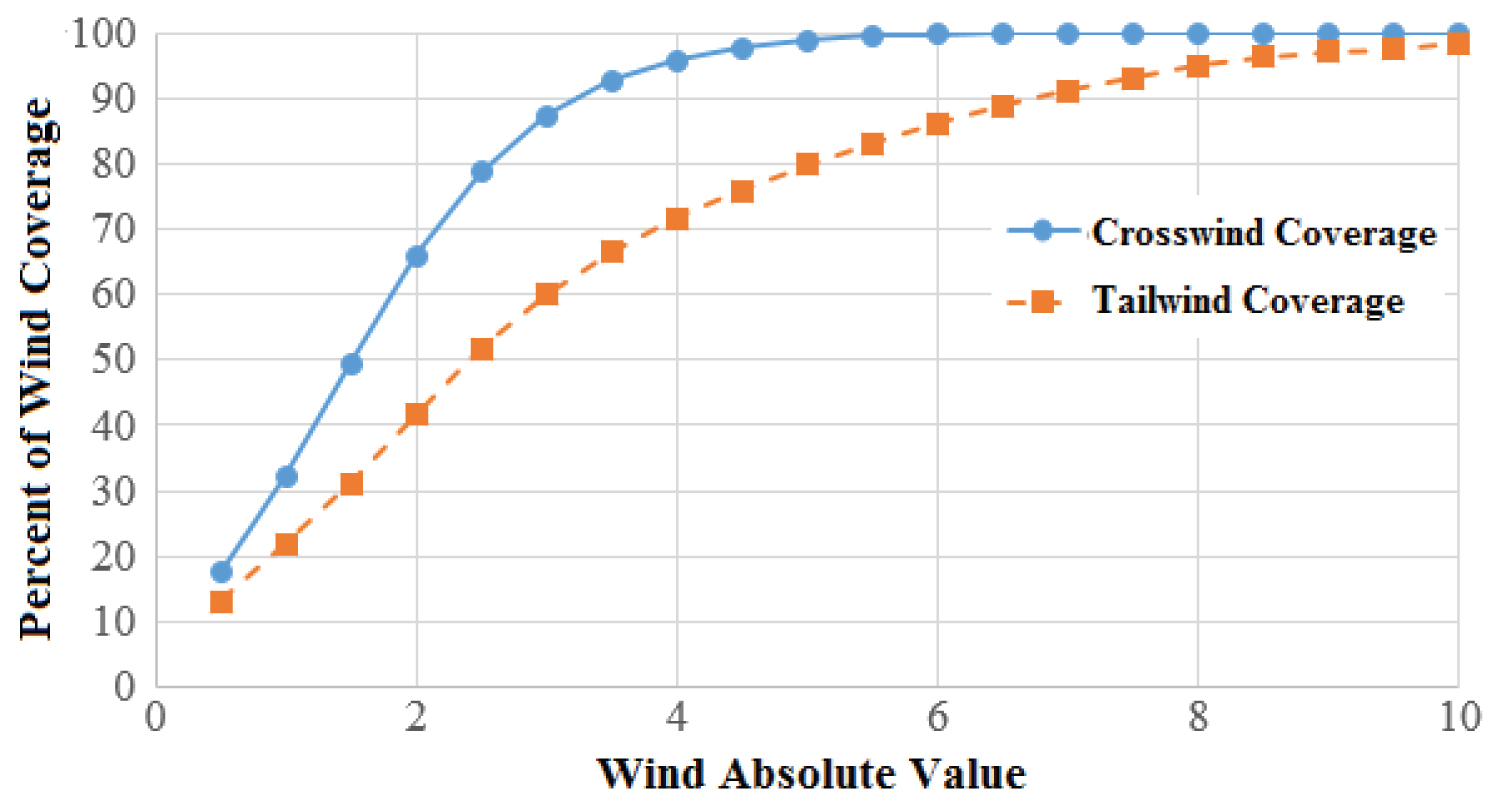
Figure 11: Distribution of the absolute values of crosswinds...
Distribution of the absolute values of crosswinds and tailwinds for the Genaveh airports from 2014 to 2018.
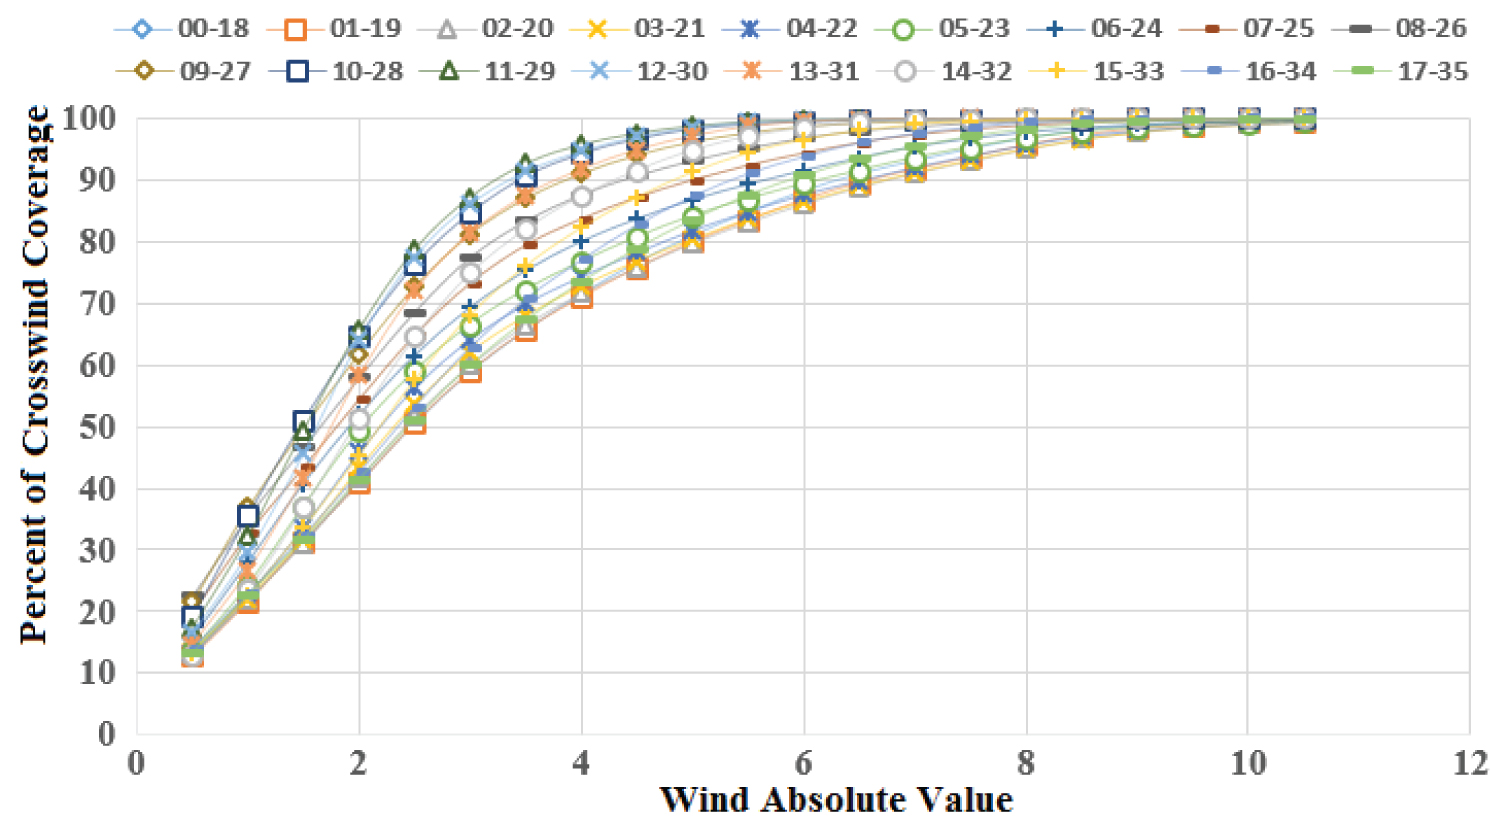
Figure 12: Crosswind coverage for all orientation of...
Crosswind coverage for all orientation of Genaveh airport from 2014 to 2018.
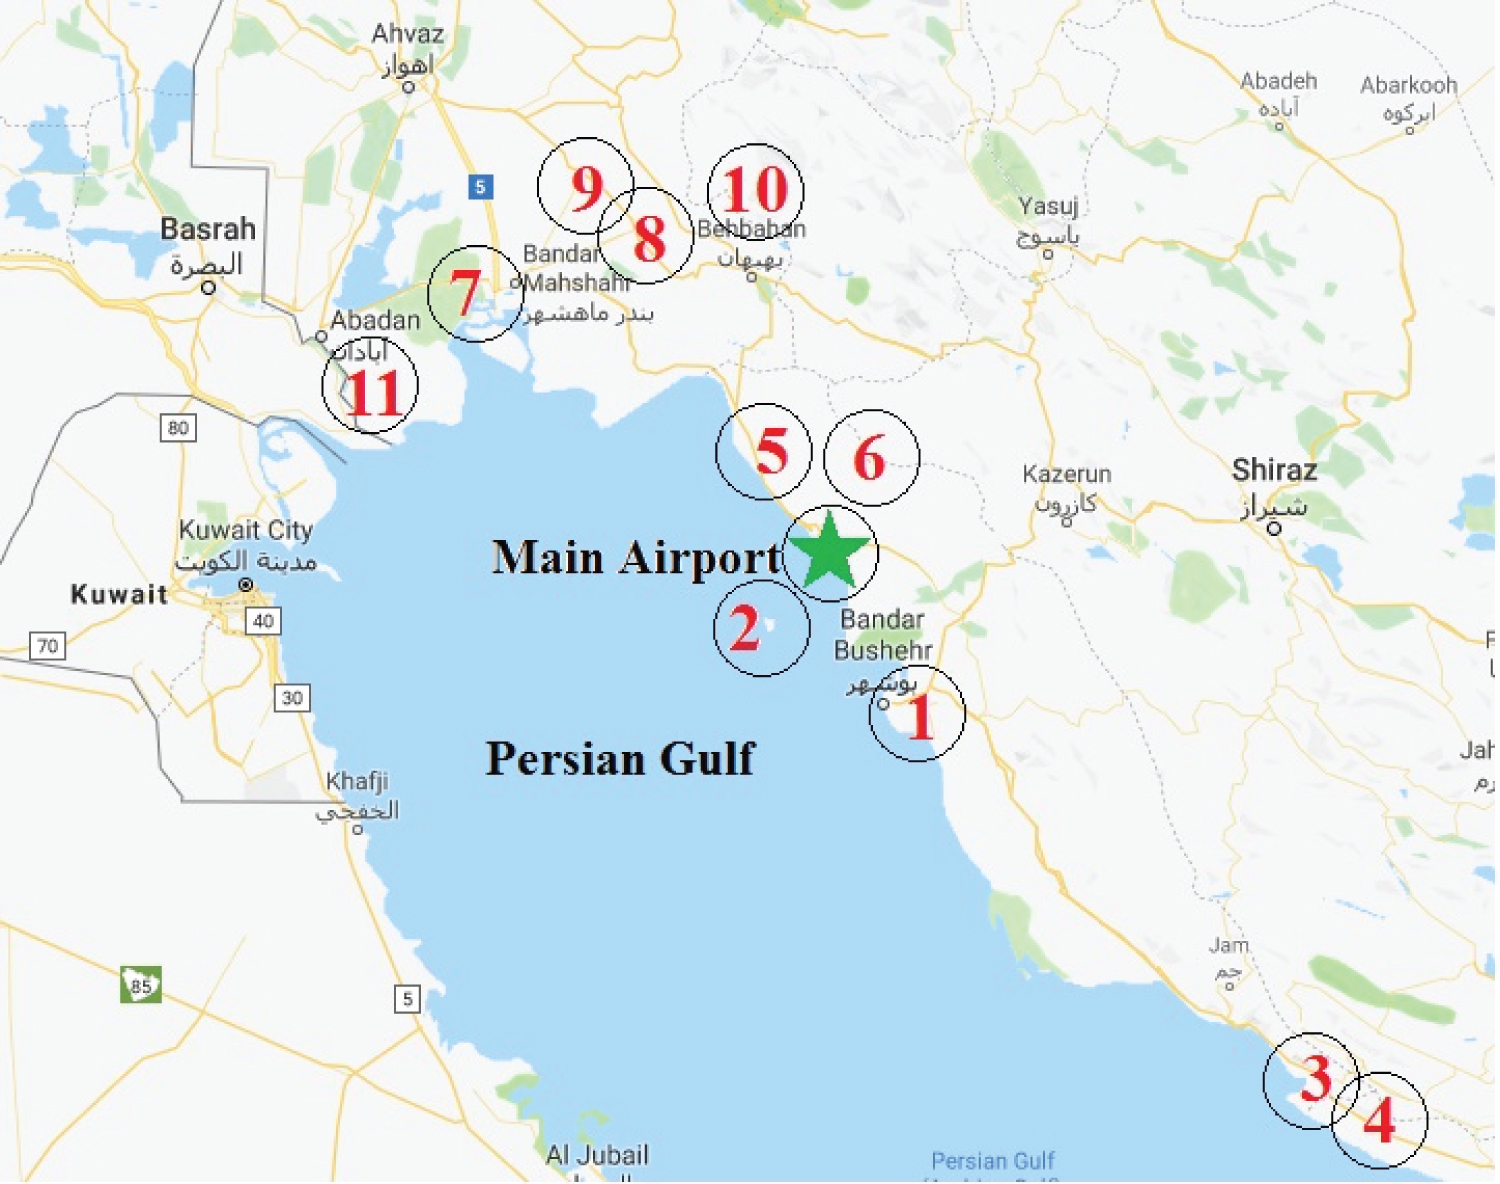
Figure 13: The nearest airports to Genaveh airport....
The nearest airports to Genaveh airport (star marked) with the same climate situations (airports presented in Table 3).
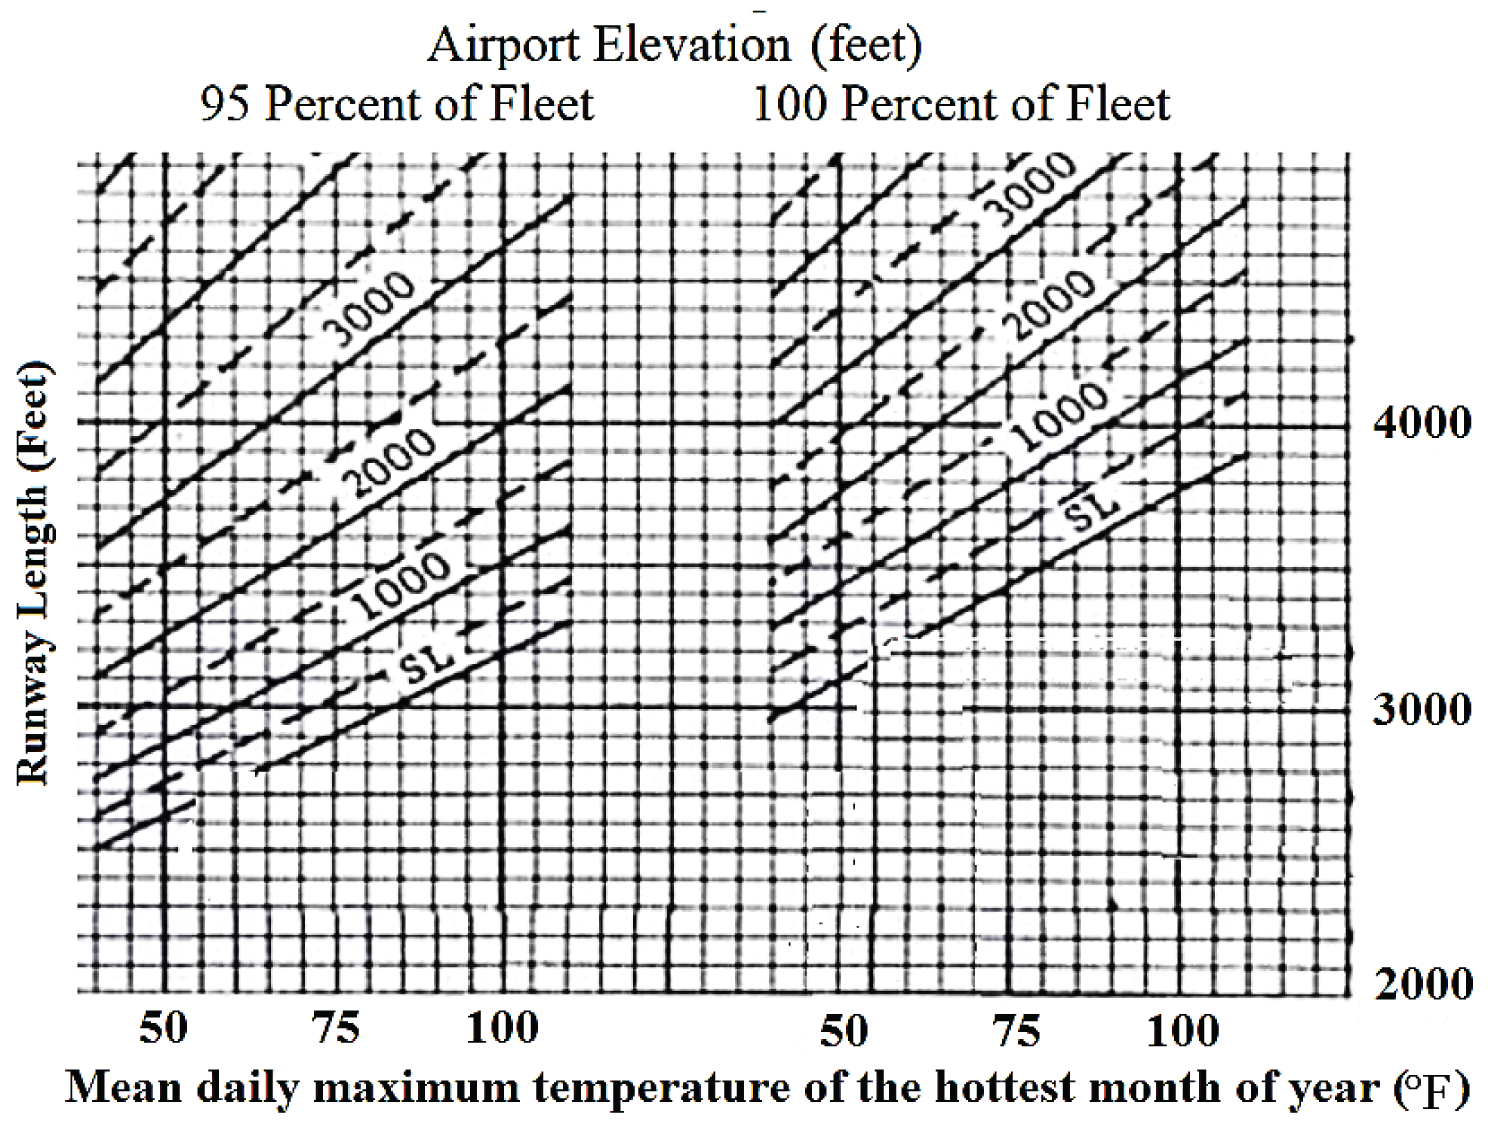
Figure 14: Small Airplanes with Fewer than 10 Passenger...
Small Airplanes with Fewer than 10 Passenger Seats excludes pilot and co-pilot, (FAA AC 150/5325-4B, Ref. [4]).
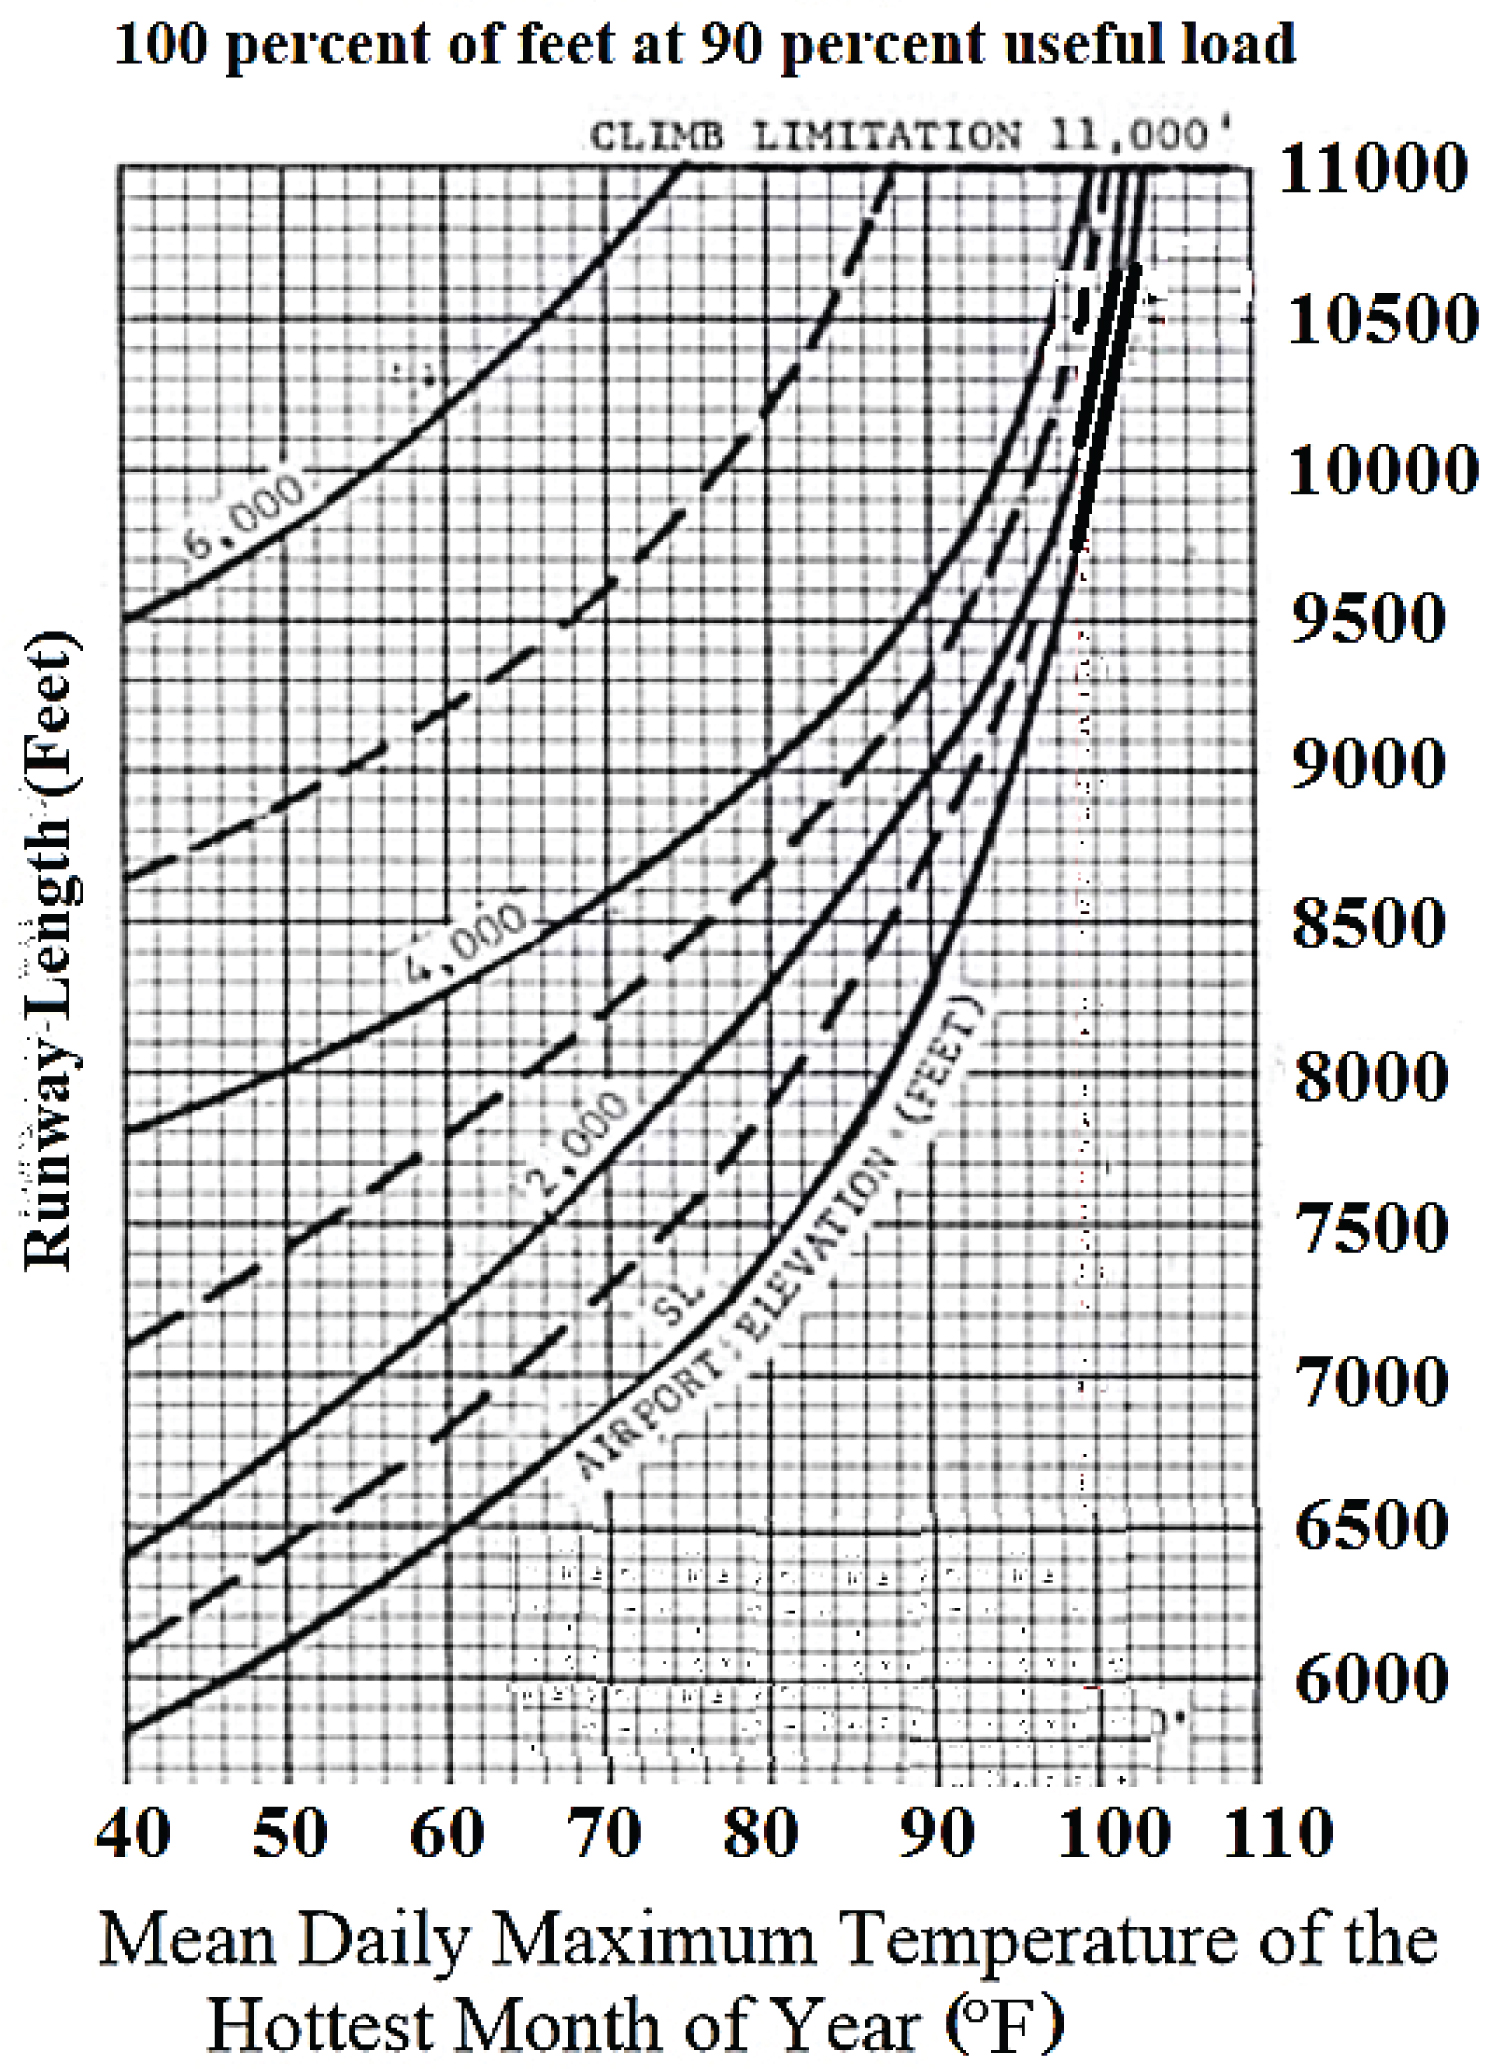
Figure 15: Runway lengths for airplanes within a maximum....
Runway lengths for airplanes within a maximum certified take-off weight between 12,500 lbs (5,670 KG) and 60,000 lbs (27,200 KG), (FAA AC 150/5325-4B, Ref. [4]).
Tables
Table 1: Design data allowable crosswind (ACC) and tailwind.
Table 2: Wind coverage analysis for all orientation of Genaveh airport based on local observation.
Table 3: Local runway near Genaveh airport (nearest runways with the almost same climate and temperature).
Table 4: Landing/take-off length for heavy type aircraft.
References
- Jahanfar R (1998) Flight pioneer in Iran. IRAF publication.
- Ward Steven R (2014) Immortal: A military history of Iran and its armed forces. Georgetown University Press.
- (1934) National Library and archives of I.R. Iran, historical and national archives documents. The reference documents of ministry of economic affairs and finance, No: 240/15939.
- (2005) Advisory Circular (AC) No: 150/5325-4B, U.S. department of transportation, Federal Aviation Administration (FAA).
- Van Es GWH, Van der Geest PJ, Nieuwpoort TMH (2001) Safety aspects of aircraft operations in crosswinds. (11th edn), Flight Safety Foundation FSF, Annual European Aviation Safety Seminar, Amsterdam. NLR-TP-2001-217.
- Fala N, Karen M (2016) Detecting safety events during approach in general aviation operations. (16th edn), AIAA Aviation Technology, Integration, and Operations Conference.
- Falls LW, SC Brown (1972) Optimum runway orientation relative to crosswinds. NASA technical reports, D-6930.
- Grewe V, Matthes S, Frömming C, Brinkop S, Jöckel P, et al. (2017) Feasibility of climate-optimized air traffic routing for trans-atlantic flights. Environmental Research Letters 12: 034003.
- (2011) European Aviation Safety Agency (EASA) Authority, Organization and Operations Requirements for Aerodromes, NPA 2011-20 (B.III).
- (2012) International Civil Aviation Organization (ICAO), Cir 329/AN/191, Runway Surface Condition Assessment, Measurement and Reporting.
- Crutcher HL (1954) Wind aid from wind roses. Bull Amer Meteor Soc 37: 391-402.
- Jia X, Chung D, Huang J, Petrilli M, The L (2004) ARO: Geographic information systems-based system for optimizing airport runway orientation. Journal of Transportation Engineering 130: 555-559.
- Chang SW (2015) Crosswind-based optimization of multiple runway orientations. Journal of Advanced Transportation 49: 1-9.
- Mousa RM, Mumayiz SA (2000) Optimization of runway orientation. Journal of transportation engineering 126: 228-236.
- Oktal H, Yildirim N (2013) New model for the optimization of runway orientation. Journal of Transportation Engineering, 140.
- Alexandre GDB, Wirasinghe SC (2002) Designing the airport airside for the new large aircraft. Journal of Air Transport Management 8: 121-127.
Author Details
Hassan Haghighi1*, Davood Asadi2 and Daniel Delahaye3
1Amirkabir University of Technology, Hafez, Tehran, Iran
2Adana Alparslan Türkeş Science and Technology University, Adana, Turkey
3Ecole Nationale de l'Aviation Civile, ENAC, Toulouse, France
Corresponding author
Hassan Haghighi, PhD, Amirkabir University of Technology, Hafez, Tehran, Iran.
Accepted: October 29, 2020 | Published Online: October 31, 2020
Citation: Haghighi H, Asadi D, Delahaye D (2020) Insight into Genaveh 11-29 Runway Geometric Redesign Based on Meteorological Synoptic Data. Int J Astronaut Aeronautical Eng 5:041.
Copyright: © 2020 Haghighi H, et al. This is an open-access article distributed under the terms of the Creative Commons Attribution License, which permits unrestricted use, distribution, and reproduction in any medium, provided the original author and source are credited.
Abstract
Wind information can provide an optimal estimate of the runway orientation by minimizing the crosswind component of the wind at airports, which severely affect aircraft take-off and landing performance. Additionally, a systematic geometric design requires information on wind speed, direction, duration and specific information about latitude and longitude, temperature variation, and altitude of the airport site. In the present research, meteorological synoptic data has been precisely measured and collected over Genaveh unconstructed airport for a period of five years. Investigation of the gathered data leads to the selection of an optimal runway orientation using wind rose representation and other data analysis. Additionally, the required runway length has been estimated in order to be compatible with the standards and aircraft types considered to apply the Genaveh site. The required calculation procedures for the runway orientation and length are executed for variation of temperature, altitude, landing and take-off situations. The results demonstrate that the previous design orientation of the runway is considerably different from the optimal direction by at least 10 degrees. It is also demonstrated that a longer runway length is required to cope with the airplanes standards where reduces the risk of the airplane accident in presence of crosswinds.
Keywords
Genaveh airport, Runway orientation, Runway length, Meteorological synoptic data, Wind rose diagram
Nomenclature
dt: Time step; δ: Wind-runway difference angle; V: Airplane velocity; W: Wind speed; x: Position in x direction; χ: Attitude to north angle; y: Position in y direction.
Subscripts: a: airplane index; c: crosswind; t: tailwind; x: x direction; y: y direction
Introduction
Only 10 years after the first successful flight by Wright Brothers in 1903, Iran experienced the first flight and landing of a plane (Blurry 11) in Tehran by Russian-Polish Kozminskiy on January 4th, 1914 [1]. A few years after the first landing in Iran at the Qajar Military Parade of the Cossack Forces, the QaleeMorghi airport was established as the country's first official airport in 1923. Since 1925, with the establishment of the Imperial Air Force until 1936, when the construction and repair of the Shahbaz aircraft factories were started, significant changes were made in the Iranian aeronautical industry in terms of the number of trained pilots, the number of aircraft inventories, equipment and runways [2].
Due to the discovery of numerous oilfields in the south of Iran and the necessity of transportation developing of these areas, the plans for the construction of the airports of Abadan, Ahvaz, Molasani, Kot Abdullah, Dorkein, Hindijan, and Genaveh were adopted in 1934 by the council of ministers [3]. The construction mission was assigned to the Iranian-British entity company as the main director of the exploitation, construction, and development of infrastructure and equipment related to the oil industry. In all the aforementioned cities, land and facilities in the same years were considered for the construction of the airport, but only Ahwaz and Abadan airports were built quickly.
Despite dedicating a land site to the Genaveh Airport in 1931, several parts of the embankment and even buildings for the flight tower, security, apron, and airport facilities were set up several times before and after the Islamic revolution in 1979. The airport was not operational and from the stage of the embankment, parts of the leveling and runway marking did not go further. Given the abundant capability of Genaveh Airport in the region's economic prosperity, and the fact that the design phase has not been really considered scientifically, this article examines the current status and redesigns of the airport based on local meteorological synoptic data in accordance with wind speed and direction.
Figure 1 illustrates the data and satellite view of Genaveh airport runway which was planned to be between 1.70 km and 4.20 km long with heading orientation of 110-290 degrees (11-29).
According to the local wind data and the airplane type, the capability of the runway is investigated, the corrected orientation and length are calculated. The requirements of the airport runway are analyzed for its ability to meet the requirements of users throughout the planning period. The main objective of this effort is to provide specifications that satisfy the Federal Aviation Administration (FAA) and International Civil Aviation Organization (ICAO) standards. For the operational safety and efficiency of an airport, it is desirable for the runway to be oriented towards the direction of the prevailing wind. This reduces the impact of the wind perpendicular to the runway (crosswinds) as well as relaxing the take-off and landing performance in presence of headwind. The recommended length of runways is determined by considering either the family of airplanes having similar performance characteristics or the longest runway required by an available aircraft. Additional important factors include; critical aircraft approach speed, its maximum certificated take-off weight, useful load and length of haul, runway inclination, the airport's field elevation above sea level, and the mean daily maximum temperature at the airfield, and the typical runway surface conditions, such as wetness and slippery [4].
The wind data analysis is essential in different application such as meteorology and climate, air quality evaluation, architecture, energy production, agriculture, etc., The wind could be a definite threat if not adequately considered in some specific fields especially in designing airport runways. The concepts of crosswinds and tailwinds are of particular importance in the correct design of runways. A crosswind is a wind that blows perpendicular to a specific direction of a runway which makes a landing more difficult. If a crosswind is strong enough it may exceed the allowable aircraft's crosswind limit and an attempt to land under such conditions could cause an accident. Crosswinds may cause serious accidents during landing, especially for small and light airplanes. The investigation about different accidents has proved that the accident probability increases as crosswind rises [5]. Statistics on historic aerial accidents demonstrate that the risk of accidents grows exponentially when the airplane operates in conditions with crosswind exceeding 20 knots (10.29 m/s). Tangential wind (tailwind) causes an overrun type of events during landing and also is important in accident analysis [6].
Runway orientation is the main focus of wind data statistics in the airport design phase. For this purpose, the wind rose analysis has been widely applied with different approaches. Accordingly, a proper investigation must be executed for the Genaveh runway. In the present paper, an effective method is introduced to examine wind data for airport runway design and to evaluate the orientation of the existing runway. It is noted that our proposed approach concentrates simultaneously on two important parameters in runway design, which is the determination/evaluation of the correct orientation and minimum required length of the runway.
Dominant Data
The investigations tend to define the runway orientation that maximizes the possible use of the runway throughout the year accounting for a wide variety of wind conditions as well as considering the regulations about runway orientation and their expected coverage. Generally, all operations on a runway must be managed according to the wind; therefore, a careful examination of prevailing wind conditions at the airport site is required. Falls and Brown presented two methods (empirical and theoretical) for determining the optimum runway orientation relative to minimizing a specific crosswind [7]. The empirical procedure requires only hand calculation on an ordinary prevailing wind direction, while the theoretical method utilizes wind statistics computed after the bivariate normal elliptical distribution [8].
The runway orientation should provide 95% wind coverage [4]. This means that for 95% of the yearly time, the crosswind component must be smaller than the Allowable Crosswind Component (ACC). Thus, the goal here is to achieve 95% coverage or even more. FAA considers wind analysis as fundamental processing for determining runway orientation. The runway orientation is determined by a specific number between 01 (for 10 degrees) and 36 (for 360 degrees), indicating its heading with respect to the North in sectors of 10 degrees. For example, during take-off and landing on a runway labeled as 09, an aircraft points to the East, while on runway 18, it points to the South. This definition of the orientation is not coherent with the one of wind direction since a wind direction of 180 degrees indicates a wind blowing from the South. If a runway is used in the opposite direction, it is named by adding/subtracting 18 (180 degrees). For example, runway 09 becomes 27 when is used in the opposite direction. Then the runway orientations are often determined as XX-YY, where the absolute difference between XX and YY is 18 (for example Genaveh 11-29). Therefore, the runway direction does not change the results, the only difference is that headwinds become tailwinds, and crosswinds from left become right hand side crosswinds (and vice versa). Since only the absolute values of the crosswind are of interest, the runway can be considered with its orientation. For this reason in the rest of the document headwind and tailwind are considered interchangeable.
As previously mentioned, according to the FAA, a runway orientation must satisfy 95% wind coverage considering yearly wind conditions. For each wind speed , the crosswind and tailwind components are calculated using equations (1) to (3), where δ is the difference between the wind direction and the runway orientation. Once the ACC is known, the analysis of the wind data allows to determine the runway coverage or to determine the best runway orientation for a given site during the airport design. In order to determine the best orientation of a future runway, the calculations must be performed for all possible directions.
Considering wind currents (W) , the motion of the airplane is defined as follows:
Where is the airplane position, is the airplane heading angle relative to North direction, is the velocity of the airplane, is the east component of the wind, and is the north component of the wind. The motion equations apparently describe the required runway length and orientation as well as the dependency of wind and airplane motion.
Every aircraft is tested according to the regulations prior to certification. The aircraft is tested by a pilot with average piloting skills in 90° crosswinds with a velocity up to 0.2 of the aircraft's stall speed in power off, gear down, and flaps down flight condition. This means that if the stall speed of the aircraft is 45 knots, it must be capable of landing in a 9-knot, 90° crosswind. The crosswind and headwind component chart allows for figuring the headwind and crosswind component for any given wind direction and velocity. Referring to Figure 2, the degrees determine the difference between the runway orientation and the wind direction while parallel quadrants denote the specific crosswind or headwind. Dimensions straight down and straight across specifies the headwind and the crosswind component at specific differences. This information is important during take-off and landing so that the appropriate runway can be picked if more than one direction exists at a particular airport.
The decision about applying a special method mainly depends on the type of input data available. Both FAA and ICAO standards employ the most critical aircraft expected to operate in the runway for allowable crosswind calculation. Hence, the most critical airplane is considered as the largest with the highest approach speed. According to the safety terms, it is also recommended to provide a runway orientation that satisfies crosswinds below the critical value.
Each aircraft has a maximum allowable crosswind component derived from flight test experiments. The crosswind component increases with the size of the aircraft, for example, it is 33 knots (16.98 m/s) for an Airbus A320 and 17 knots (8.75) for a Cessna 172. The FAA coding system is employed to relate airport design criteria to the operational and physical characteristics of the aircraft projected to use the airport, while ICAO standards consider take-off weight, airport altitude, and the required take-off length [9]. According to the FAA, an allowable crosswind component (ACC) depends on the Runway Design Code (RDC). The RDC is a string composed of a letter and a Roman numeral; the letter, from A to E, is related to the aircraft approach speed (A low speed, E high speed), while the Roman numeral, from I to VI, is related to the wingspan or tail height (I small size, VI great size). Actually, the RDC includes also third information which is related to visibility, but it is not considered in determining the ACC. The ACC for some different airplanes (average value of different models of an airplane type) is reported in Table 1.
Both the ICAO and EASA (the European Aviation Safety Agency) establish the ACC as a function of the minimum required take-off length: 10 knots (5.1 m/s) for lengths smaller than 1200 m, 13 knots (6.7 m/s) for lengths smaller than 1500 m, and 20 knots (10.3 m/s) for lengths greater than 1500 m [9,10]. These dimensions about ACC refer to a dry runway surface. When the runway surface is wet with the risk of hydroplaning or covered with slush or snow, the ACC decreases. For example, the ICAO and EASA ACC of 20 knots reduce to 13 knots when the runway is characterized by poor braking conditions. According to mentioned items, 15 knots (7.7 m/s) is considered as the ACC threshold in the following analysis.
The required take-off and landing field lengths depend on tailwind, therefore the minimum length of the runway for safe take-off and landing must be determined by tailwinds. Often the same aircraft has equal tailwind limits for the take-off and landing operations, but sometimes the limit is different for the two phases. Tailwind as one of the most important landing components which mostly contributes to overrun during landing and its effect is amplified when the runway surface is wet or contaminated. Moreover, many of the accidents happened for tailwinds greater than 10 knots (5.1 m/s).
Wind rose diagram
The main operation in determining the orientation of a runway is the preparation of the wind rose diagram, which gives an explicit view on how wind speed and direction are distributed at a particular location over a specific period of time. It is a very useful representation because a large quantity of data can be summarized in a single plot. The importance of the information given by wind roses is known for more than half a century [11]. Wind roses applied for runway design are composed of 36 wind sectors, each one spanning 10 degrees. Typically, each wind sector represents four to six wind classes. A possible variant of the wind rose consists of representing each direction, the average and/or the maximum wind speed, or any percentile of the wind speed along each direction.
The wind rose template has a polar coordinate system that is made of circles and radial lines. Circles on the template represent the wind speed, while the radial lines illustrate the angles or the wind blowing directions. Each cell bounded by two circle segments and two radial lines stores the percentage of times that the winds correspond to a given direction and velocity range (frequent winds). The template is rotated around the center of the wind rose in order to search for an optimal runway orientation. At each rotating angle, the total percentage of allowable crosswinds in the wind rose that is covered by the template is calculated, and the best angle that can give the maximum percentage of coverage is determined.
Several works with different methodologies were performed in accordance with the wind rose to determine runway orientation. Jia, et al. presented a geographic information system (GIS)-based wind rose method called Airport Runway Optimization (ARO) to determine the orientation of a runway for the effective layout of airport facilities [12]. This method uses a set of customized GIS operators and the database management tools to solve both the partial coverage problem and runway orientation optimization based on given wind data and allowable crosswinds. Similar work was performed by Chung using wind rose analysis [13]. Mosa [14] and Oktal [15] presented a computer model for optimizing the runway orientation based on a given wind data and ACC. Most computer models, as the interpretation of wind rose, are based on a mathematical formulation that transfers circles and radial lines of the wind rose method into points with numeric coordinates.
The considered airport for wind data analysis is the Genaveh runway which is an under-construction abandoned runway. It is concerned to be 11-29 oriented with a nominated length of 1.70 km to 4.20 km. The runway is located at latitude and longitude of 29.57 N and 50.56 E, respectively, east of the Persian Gulf near the sea (less than 4 km) in a flat area (less than 5-meter altitude above sea level) and has not been dedicated an ICAO code yet. The METAR (Meteorological Aerodrome Report) data of this airport have been collected for a period of 5 years (2014-2018) with a 10 minutes time resolution. Obviously, the vast collected data bank agrees with the EASA requirements, which states that a minimum of five years of observation with at least eight ones per day (while 144 daily observations were used in this study) must exist [9]. The METAR data contain information about average wind speed and direction, temperature, visibility, cloud cover, etc. A time processing procedure allows analyzing the data to produce the wind roses diagram.
Simulation and Results
Airport data collection is really challenging and time taking procedure. A huge database must be provided and examine for runway design. Based on meteorological synoptic data, the wind speed and direction, pressure, temperature, time and date of occurrence were collected with a 10 minutes time resolution during five years (over 200000 time intervals and more than 1.2 × 10⁶ data). The results of the data analysis are presented in the following.
Orientation analysis
According to the classified wind data, the wind roses diagram of the Genaveh airport in the period of 2014-2018 have been illustrated in Figure 3, Figure 4 and Figure 5 for the total period and different seasons. These diagrams include both the measured average speeds and directions. In summer the spectrum of winds is more western and in winter is more northern. Although different winds are observed in the hot and cold seasons, the overall wind spectrum indicates a dominant northwest (NW) wind. According to the results, the dominant wind direction of the Genaveh airport greater than 6 m/s occurs in 300 degrees, followed by 310, 290, and 280 degrees, and then the most frequent winds blow from NW. Winds blow mostly from the arcs ENE and WNW (near the NW) where the NW winds are stronger than others. Therefore, they are roughly aligned with the imaginary axis along the NW, which is approximately the runway orientation.
Figure 6 illustrates the average hourly wind speed distribution during the five years of examined data. The horizontal axis depicts the hours of the day, while the vertical axis presents the percentage of occurrence of a specific velocity. It is concluded that the high-speed frequent winds occurred between the hours 06:00 and 14:00 of the daytime while the lower speeds blow at other times. Figure 7 illustrates the average hourly wind direction distribution, using a different color spectrum indicating the runway orientation. According to Figure 7, it is observed that between the hours of 06:00 and 14:00, the frequent prevailing wind directions vary from 250 degrees to 310 degrees as approaching the noon and the 300 degrees is the prevailing wind blow direction. Accordingly, the lower speed winds are very frequent during the night and in the morning.
According to Figure 8 of the hourly wind, in an interval of 250-320 degrees, the hourly wind distribution presents that the high frequent winds occur from 06:00 to 15:00. Figure 9 verifies these results and illustrates that the critical high-speed winds (> 6 m/s) are more frequent from 09:00 to 12:00. Therefore, the design orientation must be around this critical condition while covering all strong winds in the day time.
Crosswind-tailwind analysis
Regarding three critical values of crosswind, Figure 10 illustrates Genaveh peak crosswind components percentage of exceedance versus runway orientation. The distribution of the absolute values of 11-29 Genaveh airport crosswind and tailwind are shown in Figure 11. Absolute values mean that crosswinds from left and right are considered similarly, and the same is true regarding headwinds and tailwinds. The crosswind distribution plot helps to estimate graphically the wind coverage once the ACC of the runway has been defined. Similarly, the plot of tailwinds distributions allows estimating how frequently the threshold of 10 knots or 5.1 m/s, is exceeded. The distribution of absolute crosswind is illustrated in Figure 12 for all orientations of Genaveh airport. The influence of orientation on wind coverage is apparently observed. The resulting calculated wind coverage values are reported in Table 2 for all the runway orientations of the Genaveh airport. The highest wind coverage established by the FAA has obtained form 12-30 and 13-31 orientations while the 12-30 orientation demonstrates a lower wind speed in 100% coverage and a higher percentage of the tailwind. These results support the initial results according to wind rose analysis.
According to the results, especially the wind rose and the crosswind analysis, the best orientation for Genaveh airport is concluded to be 12-30, and consequently, the previous orientation has not been considered appropriately. In order to validate our results, the nearest runways data with similar meteorological conditions are presented and compared in Table 3 and Figure 13. Based on Figure 13, eleven runways near Genaveh landing site have been selected. Accordingly, the selected runways along with some important metrological characteristics have been presented in Table 3. Obviously, the predominant orientation is 300 degrees to 310 degrees with runway lengths of more than 2200 meters. In this statistical study, the runways local wind streaming from the south and north of the Persian Gulf as the source of wind streaming have been selected and examined. Local runway data analysis assists in understanding the coastline wind behavior while 11-29 orientation (considered orientation of Genaveh runway in the previous design) seems to be a discontinuity in the wind streaming behavior in runway design.
Runway length/width analysis
Various factors including the weight of aircraft, runway slope, weather condition, and elevation with respect to sea level affect the runway length requirements. Runway length requirements for each aircraft along with related general guidelines have been defined and published in FAA AC 150/5325-4B standards [4]. This Advisory Circular (AC) provides guidelines for airport designers and planners to determine recommended runway lengths for new runways or extensions of existing runways. Various factors govern the suitability of available runway lengths, most notably airport elevation above mean sea level, mean maximum temperature of the hottest month, wind velocity/speed, airplane operating weights, take-off and landing flap settings, runway surface condition (dry or wet), effective runway gradient, presence of obstructions in the vicinity of the airport, and, if any, locally imposed noise abatement restrictions or other prohibitions. Among these factors, certain ones have an operational impact on available runway lengths. Hence, for a given runway the usable length made available by the airport authority may not be entirely suitable for all types of airplane operations. Fortunately, airport authorities, airport designers, and planners are able to mitigate some of these factors. Independently, airport authorities working with their local lawmakers can establish zoning laws to prohibit the introduction of natural growth and man-made structural obstructions that penetrate existing or planned runway approach and departure surfaces. Effective zoning laws avoid the displacement of runway thresholds or reduction of take-off runway lengths thereby providing airplanes with sufficient clearances over obstructions during climb outs. Airport authorities working with airport designers and planners should validate future runway demand by identifying the critical design airplanes. In particular, it is recommended that the evaluation process assess and verify the airport's ultimate development plan for real changes that could result in future operational limitations to customers. In summary, the goal is to construct an available runway length for new runways or extensions to existing runways that is suitable for the forecasted critical design airplanes.
The basic length for a primary runway at an airport is determined by considering either the family of airplanes having similar performance characteristics or a specific aircraft requiring the longest runway. Both the Advisory Circular, as well as the FAA's Airport Design, classify aircraft based on weight. The standards include the aircraft fleet profile designed to be representative of the small and large aircraft.
The runway length requirements in this investigation are defined in accordance with the aircraft characteristics of Airport Planning Manuals (APM) distributed by the corresponding aircraft manufacturers. These manuals provide consideration for most factors that influence the basic runway length required for aircraft operations. Figure 14 [4] demonstrates the sample calculation worksheets to compute the basic runway length for the small airplane with fewer than 10 passenger seats, while Figure 15 [4] illustrates the worksheets for heavier type correction of basic runway length.
The design table for two types of the airplane, the small airplane of 12,500 pounds (5,670 kg) or with less maximum certificated take-off weight, and large airplane with more than 12,500 pounds (5,670 kg) of maximum certificated take-off weight are listed in the Figure 14 and Figure 15.
For Genaveh airport the mean daily maximum temperature in the hottest month of the year is 39.5 ℃ (103.1 °F), therefore the runway length for 95% and 100% coverage of small airplanes are 3200 ft (≈ 976 m) and 3800 ft (≈ 1160 m), respectively.
According to a maximum temperature in the hottest month of the Genaveh, the runway length is about 9800 ft (≈ 3000m) for 100% coverage of airplanes within a maximum certified take-off weight of more than 12,500 lbs (5,670 kg) up to and including 60,000 lbs (27200 kg) at 90 percentage of useful load.
Runway lengths for regional jets and those airplanes with a maximum certified take-off weight of more than 60,000 lbs (27,200 kg) requires the following information: The critical design airplanes under evaluation and their APMs, the maximum certificated take-off weight or take-off operating weight for short-haul routes, maximum certificated landing weight, airport elevation above mean sea level, effective runway gradient, and the mean daily maximum temperature of the hottest month at the airport. The recommended runway length obtained for this weight category of airplanes is based on using the performance charts published by airplane manufacturers, i.e., APMs, or by contacting the airplane manufacturer and/or air carriers for the information. Regardless of the approach taken by the airport designer, the design procedure described below must be applied to the information/performance charts. Both take-off and landing runway length requirements must be determined with applicable length-adjustments in order to determine the recommended runway length. The requirements for the longest take-off and landing runway for the critical airplanes under evaluation are considered as the recommended runway length. Table 4, represents the required runway length for some heavy type airplanes which have the most flight sorties in Iran, according to manufacturing APM.
The characteristics related to airport design of the most used aircraft in Iran and some types of other are shown in Table 4. Wheel track (a distance between double main/aft landing gears) and wingspan determine the runway and taxiway widths. The wheel base (longitudinal distance between main and nose landing gears) is related to airplane turning activities in the taxiway area. Additionally, wingspan and aircraft length rules the design of the apron/Taxiway area. According to the jet blast area, the runway length must be 10% greater than the biggest wingspan of landed airplanes while pavement strength is based on the aircraft weight and on the distribution of the weight between the landing gears [16]. Passenger terminal facilities are sized to accommodate peak hour demand, which is highly influenced by aircraft passenger capacity.
Conclusion
The analysis of wind data is of fundamental importance to design a new runway. Crosswind and tailwind components must be examined in the airport area throughout a long period of time in order to determine the optimal runway orientation and required length. The FAA and EASA have legislated that the runway orientation must satisfy 95% of the wind coverage. ACC depends on the runway features as well as the aircraft operating on it. Considering dry conditions, the ACC of 15 knots (7.7 m/s) was applied for the analysis of wind data of Genaveh unconstructed airports. Five years of METAR data have been collected for the investigation of runway orientation and length. Crosswinds and tailwinds have been calculated for each measured data and their maximum values have been determined. The developed data and the related computations are severely important for the management of airport design and provide instant information regarding the runway orientation, location, and length design.
The results of our analysis are unlike what has been designed or considered to be designed. Accordingly, the results show that the best runway orientation for Genaveh airport is 12-30 (120-300 degrees) since its coverage exceeds the 95% threshold value based on the standard requirements and therefore have the best performance comparing other directions.
Additionally, this study follows the statistics data to calculate the effective runway length based on the most frequent aircraft which are considered to perform take-off and landing on Genaveh airport. For instance, runway length requirement ranges from 1,100 m (ATR-42) to over 4,400 m (DC-1040), a difference of 300%. The passenger capacity range is even wider: from 30 seats (EMB120) to 600 seats (the intended capacity of B747-300). Finally, the maximum take-off weight ranges from 11,500 kg (EMB-120) to over 362,000 kg (B747-400). It is very important to notice these differences since they perform a high influence on airport design. Runway length is highly limited by land availability and land costs; the amount of runway required by aircraft is, therefore, determinant for the airport cost. Thus, investigating the FAA, APMs and most used intended aircraft in light and heavy categories as well as the airplanes taxiway/apron and related facilities, the Genaveh runway length must have a length of at least 3500 meters.
Data Availability Statement
All data, models, and code generated or used during the study appear in the submitted article.