
International Journal of Earth Science and Geophysics
(ISSN: 2631-5033)
Volume 4, Issue 1
Research Article
DOI: 10.35840/2631-5033/1816

Article Formats
Experimental Study on CO2 Saturation of Low-Permeability Sandstone under Supercritical CO2 Injection
Table of Content
Figures
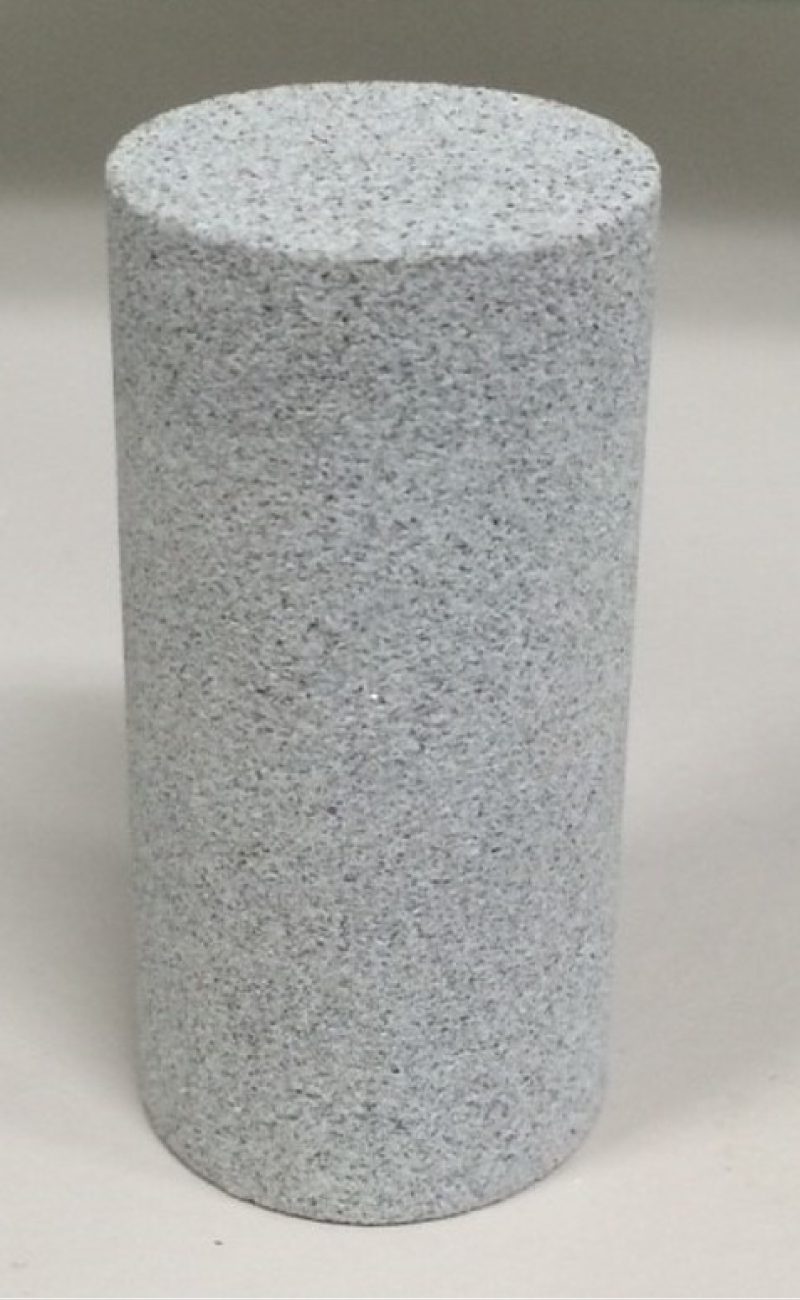
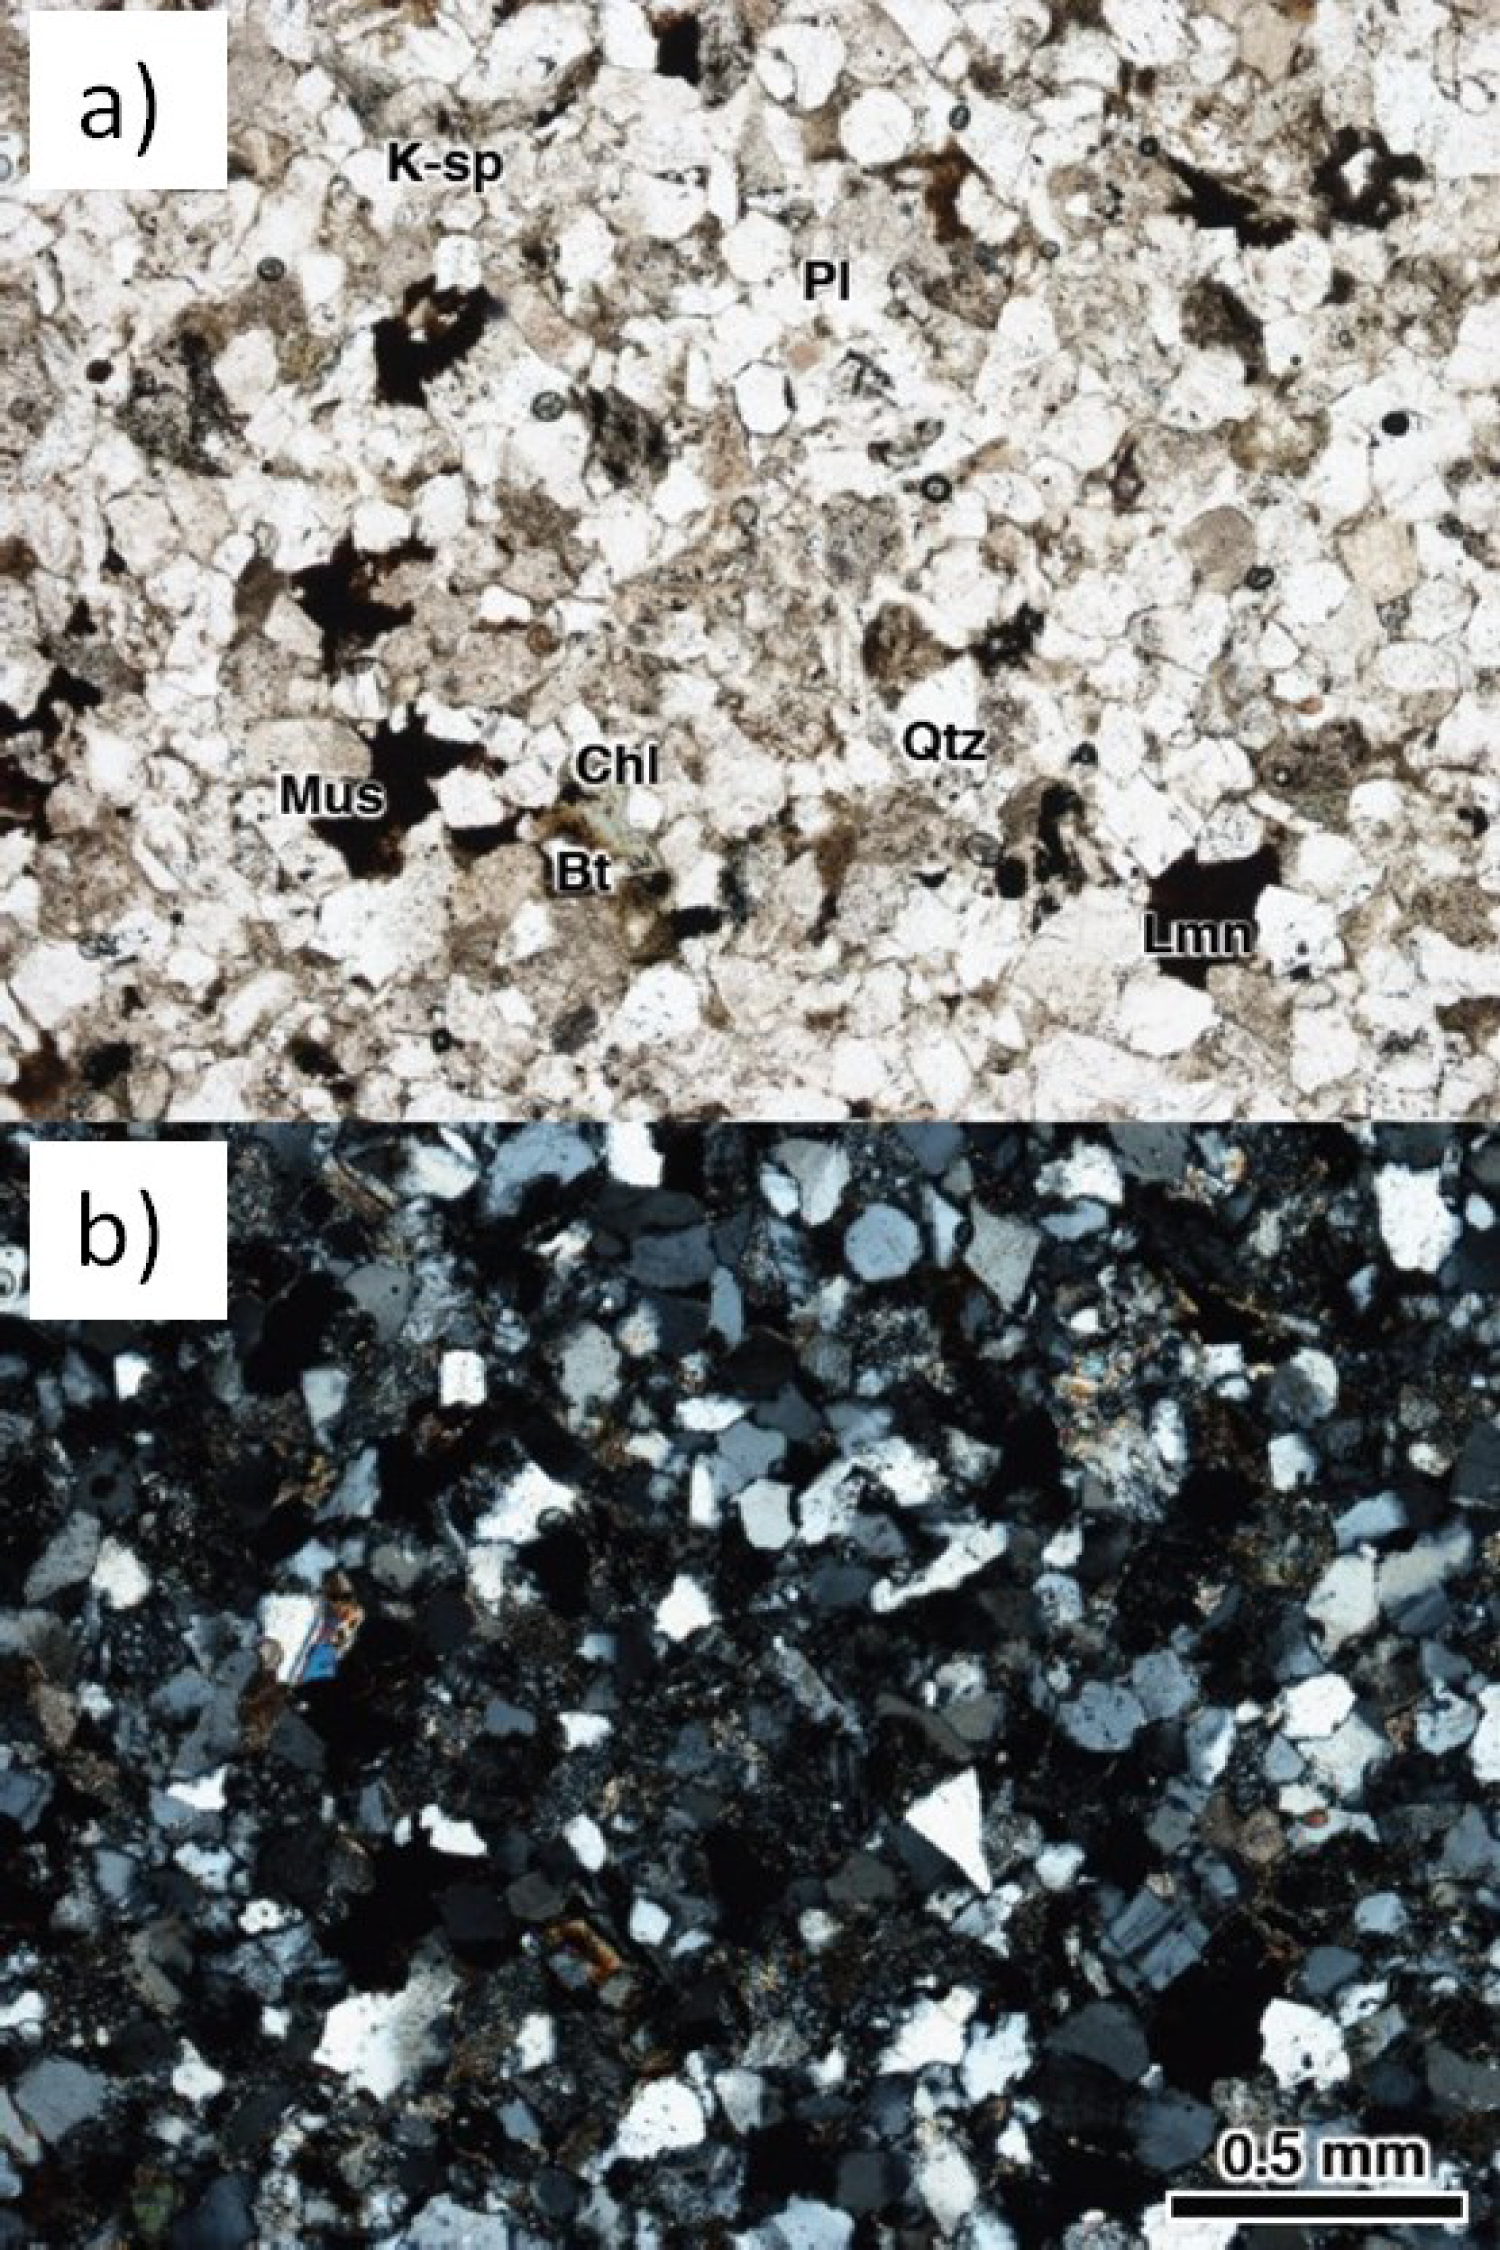
Figure 2: Photo of microscope images of Ainoura sandstone...
Photo of microscope images of Ainoura sandstone a) Open; b) Close.

Figure 3: Pore size distribution of Ainoura sandstone...
Pore size distribution of Ainoura sandstone.
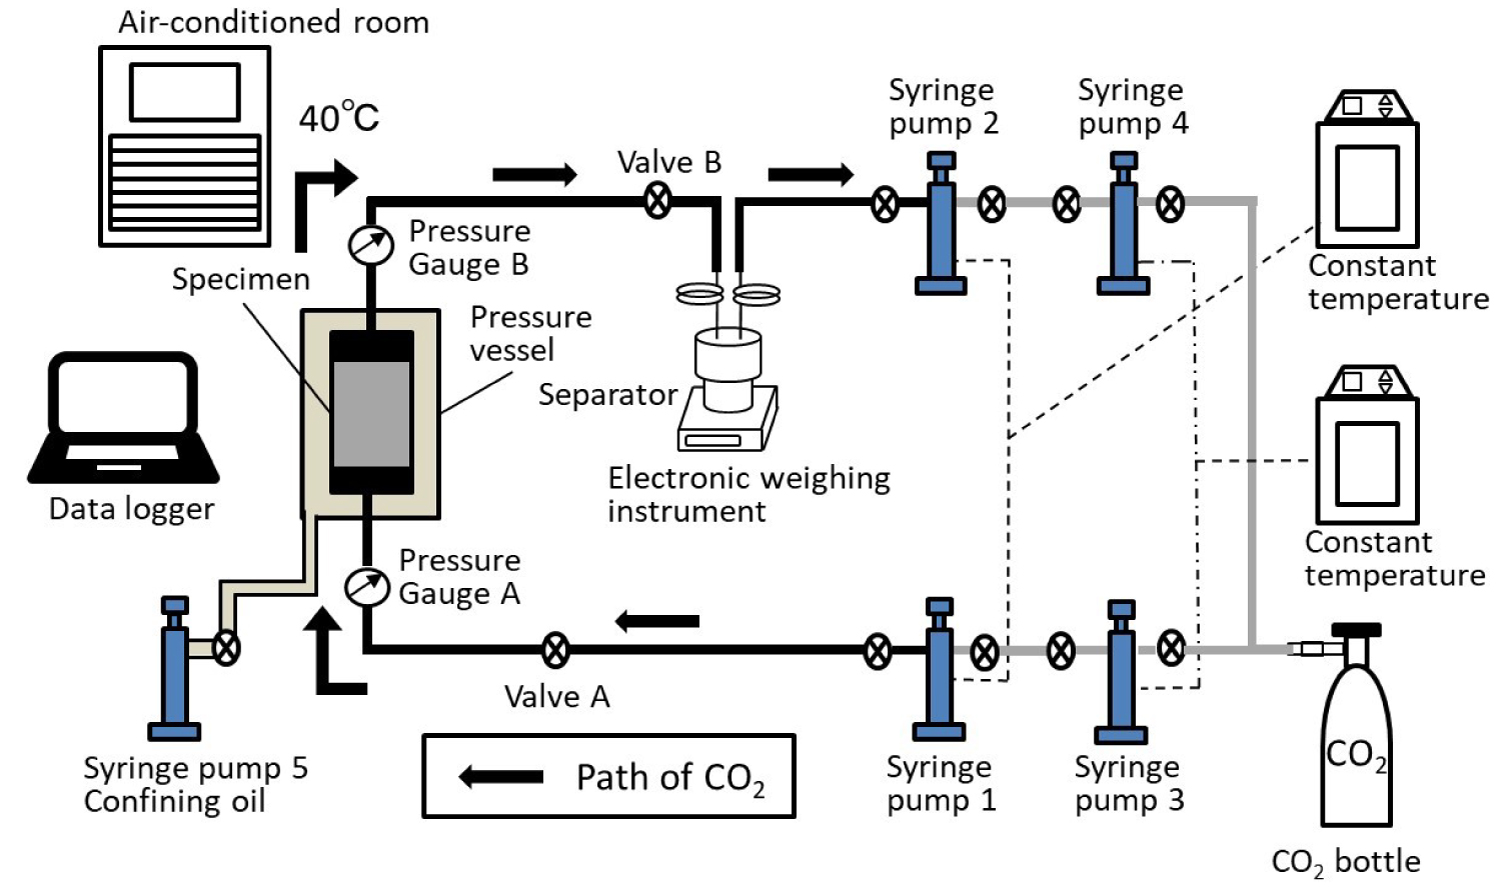
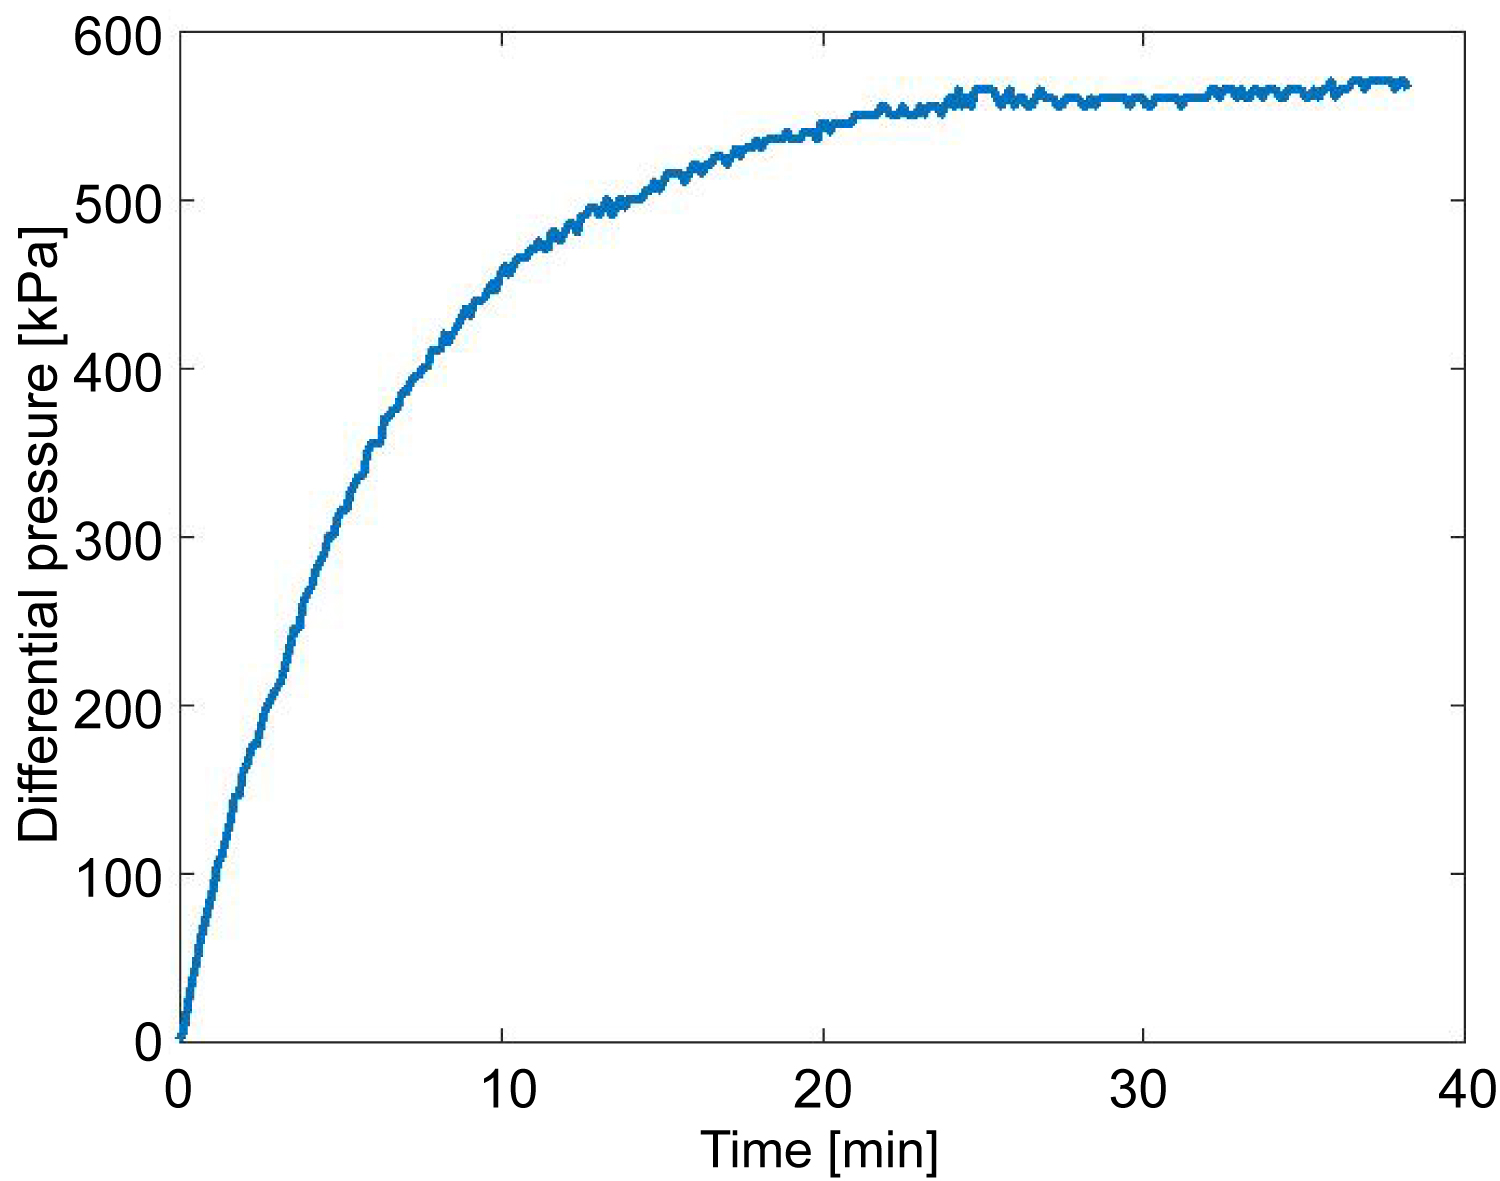
Figure 5: The change of differential pressure (âóP) during...
The change of differential pressure (âóP) during the water permeable test.

Figure 6: The change of the differential pressure and...
The change of the differential pressure and the weight of the separator.
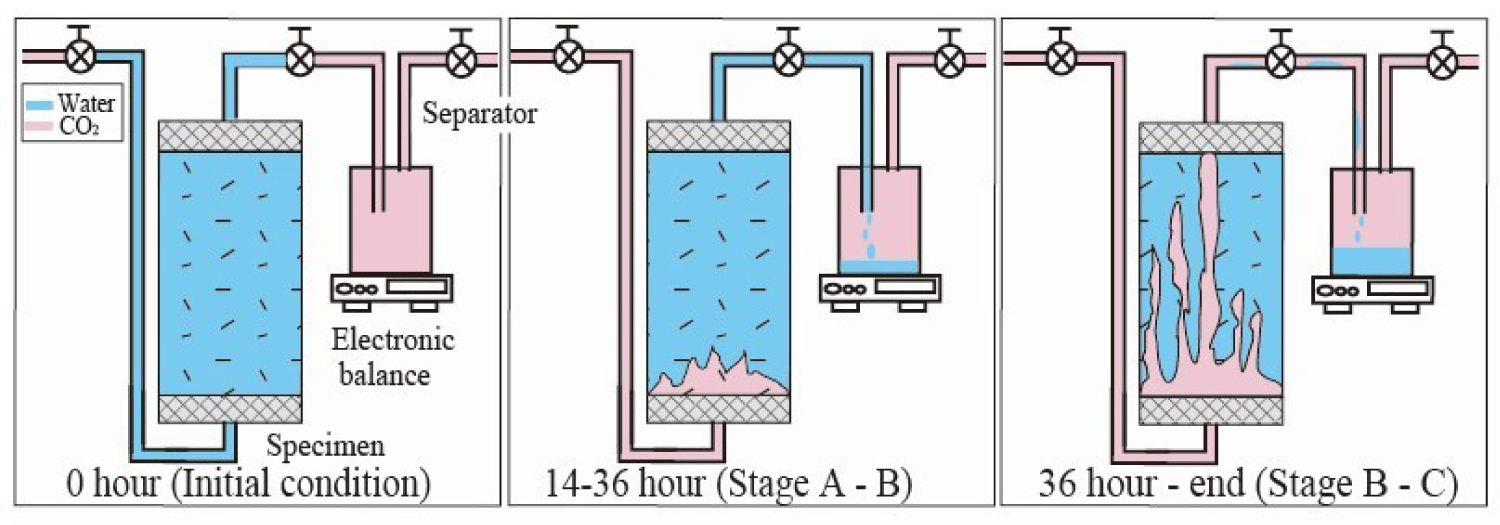
Figure 7: The stage of the CO2 behavior in the water...
The stage of the CO2 behavior in the water saturated specimen and the separator.
References
- IPCC (2014) Climate change 2014: Synthesis report. Contribution of Working Groups I, II and III to the Fifth Assessment Report of the Intergovernmental Panel on Climate Change. IPCC, Geneva, Switzerland, 151.
- Takahashi T, Ohsumi T, Nakayama K, Koide K, Miida H (2009) Estimation of CO2 aquifer storage potential in Japan. Energy Procedia 1: 2631-2638.
- IPCC Special Report Carbon Dioxide Capture and Storage (2005) A Special Report of Working Group III of the Intergovernmental Panel on Climate Change.
- Bennion B, Bachu S (2005) Relative permeability characteristics for CO2 displacing water in a variety of potential sequestration zones in the Western Canada Sedimentary Basin. In: Paper SPE 95547, Presented at the 2005 SPE Technical Conference and Exhibition, Dallas, TX, 15.
- Bennion B, Bachu S (2006) The impact of interfacial tension and pore size distribution/capillary pressure character on CO2 relative permeability at reservoir conditions in CO2-brine systems. In: Paper SPE 99325, Presented atthe SPE/DOEFifteenth Symposium on Improved Oil Recovery, Tulsa, OK, USA, 10.
- Bennion B, Bachu S (2006) Supercritical CO2 and H2S-brine drainage and imbibitions relative permeability relationships for intercrystalline sandstone and carbonate formations. In: Paper SPE 99326, Presented at the SPE Europec/EAGE Annual Conference and Exhibition, Vienna, Austria, 13.
- Bennion B, Bachu S (2006) Dependence on temperature, pressure and salinity of the IFT and relative permeability displacement characteristics of CO2 injected indeep saline aquifers. In: Paper SPE 102138, Presented at the 2006 SPE Technical Conference and Exhibition, San Antonio, TX, 24-27 September, 10.
- Bennion DB, Bachu S (2008) Drainage and imbibition relative permeability relationships for supercritical CO2/brine and H2S/brine systems in intergranular sandstone, carbonate, shale, and anhydrite rocks. SPE Reservoir Evaluation & Engineering 11: 487-496.
- Bachu S, Bennion B (2008) Effects of in-situ conditions on relative permeability characteristics of CO2-brine systems. Environmental Geology 54: 1707-1722.
- Akbarabadi M, Piri M (2011) Geologic storage of carbon dioxide: An experimental study of permanent capillary trapping and relative permeability. International Symposium of the Society of Core Analysts held in Austin, Texas, USA.
- Shi JQ, Xue Z, Durucan S (2011) Supercritical CO2 core flooding and imbibition in Tako sandstone-Influence of sub-core scale heterogeneity. International Journal of Greenhouse Gas Control 5: 75-87.
- Perrin JC, Benson S (2010) An experimental study on the influence of sub-core scale heterogeneities on CO2 distribution in reservoir rocks. Transport in Porous Media 82: 93-109.
- Krevor SCM, Pini R, Zuo L, Benson SM (2012) Relative permeability and trapping of CO2 and water in sandstone rocks at reservoir conditions. Water Resources Research 448.
- Bennion DB, Bachu S (2005) Relative permeability characteristics for supercritical CO2 displacing water in a variety of potential sequestration zones. Western Canada Sedimentary Basin, SPE Annual Technical Conference and Exhibition, Dallas, Texas, SPE 99547.
- Chun Chang, Quanlin Zhou, Lu Xia, Xiaoyuan Li, Qingchun Yu (2013) Dynamic displacement and non-equilibrium dissolution of supercritical CO2 in low-permeability sandstone: An experimental study. International Journal of Greenhouse Gas Control 14: 1-14.
- Andreas Busch, Alexandra Amann-Hildenbrand (2013) Predicting capillarity of mudrocks. Marine and Petroleum Geology 45: 208-223.
- Olsen HW, Nichols RW, Rice TL (1985) Low-gradient permeability measurement in a Tri-axial system. Geotechnique 35: 145-157.
- Head KH (1982) Manual of soil laboratory testing. Pentech Press, 2.
- Honda H, Kitamura K, Takaki S, Ikemi H, Mitani Y (2017) Measurement of Electrical Impedance and P-wave Velocity of a Low Permeable Sandstone Core During the Displacement of Saturated Brine by CO2 Injection. Energy Procedia 114: 4879-4885.
- Okabe H, Y Tsuchiya (2008) Experimental investigation of residual CO2 saturation distribution in carbonate rock. International Symposium of the society of Core Analysts, Abu Dhabi, UAE.
- Suekane T, T Nobuso, S Hirai, M Kiyota (2008) Geological storage of carbon dioxide by residual gas and solubility trapping. International Journal of Greenhouse Gas Control 2: 58-64.
Author Details
Corresponding author
Hiroyuki Honda, Department of Civil Engineering, Kyushu University, 774 Motooka Nishi-ku, Fukuoka, Japan.
Accepted: January 20, 2018 | Published Online: January 22, 2018
Citation: Honda H, Kitamura K, Ikemi H, Mitani Y (2018) Experimental Study on CO2 Saturation of Low-Permeability Sandstone under Supercritical CO2 Injection. Int J Earth Sci Geophys 4:016.
Copyright: © 2018 Honda H, et al. This is an open-access article distributed under the terms of the Creative Commons Attribution License, which permits unrestricted use, distribution, and reproduction in any medium, provided the original author and source are credited.
Abstract
Carbon capture and storage (CCS) is the key technology to reduce the CO2 emission. Geological storage in low-permeability sandstone is expected to increase CO2 storage potential due to the high quality reservoir like an oil or gas reservoir is limited near emission source. However, CO2 behavior in the low-permeability sandstone is still unclear. The principal aim of this study is to determine the change of the CO2 saturation of the water saturated sandstone as the first step of elucidating the CO2 penetration mechanism. Our target sandstone shows 1.09 × 10⁻¹⁷ m2 (= 0.01 mD) that is not regarded as a storage reservoir. In this study, we conducted the supercritical CO2 injection into water-saturated low-permeability sandstone core by the unsteady method. Experimental conditions such as temperature and pressure were reproduced in situ reservoir conditions. The injection flow rate is set as low as possible to avoid increasing pore pressure. CO2 injection was carried out for about 100 hours until steady state. During the CO2 injection, differential pressure on both ends of the specimen was monitored to show step by step changes in the CO2 penetration process. In addition to differential pressure measurement, the weight of the discharged fluid from the specimen was also measured. Using the data of discharged fluid and flow rate data, CO2 saturation of the entire specimen was calculated with the mass-balance method. An ultra-low injection rate which is a unique point of this experiment caused a time lag between the timing of differential pressure change and weight of separator change. As a result, the increase in CO2 saturation started as CO2 reached the specimen and continued after CO2 breakthrough the specimen. After CO2 breakthrough, the rate of increase in CO2 saturation decreased and shows a constant value before the differential pressure approaches steady state and finally, CO2 saturation showed 0.47. We could grasp the very slow CO2 behavior in the specimen due to the low flow (CO2 injection) rate.
Keywords
Carbon capture and storage, Supercritical CO2, Low-permeability sandstone, CO2 saturation, Laboratory test
Introduction
Geological storage of carbon dioxide (CO2) plays an important role to mitigate the CO2 emission to the atmosphere [1]. It is highly desirable to introduce carbon capture and storage (CCS) technology, particularly in conjunction with newly constructed coal-fired power plants. In Japan, CCS potential has been estimated to be 146 Gt of CO2 [2]. To achieve this level of storage, it will be necessary to store CO2 not only in the high permeable reservoir but also in the low permeable reservoir that has previously been viewed to be of little use. A reservoir with high permeability like an oil or gas reservoir requires an impermeable layer ("cap rock") on the top. Physical trapping to block upward migration of CO2 is provided by a layer of shale and clay rock above the storage formation [3]. Depending on cap lock for the stability of CO2 storage, there is a possibility of CO2 leakage due to the destruction of cap lock. Especially in Japan that has frequent seismic activity, the risk of destruction of cap lock becomes high.
Compared with a highly permeable sandstone, low-permeability sandstone has a property of retaining CO2 in itself due to the complexity of the pore structure. In addition to the physical trapping, slow penetration of fluids including CO2 in the low-permeability sandstone causes the dissolution in the in situ water over time scales of hundreds of years to thousands of years. CO2 dissolution in the in situ water increases in storage potential per rock. After CO2 is dissolved in the in situ water, chemical reactions between the dissolved CO2 and rock minerals form ionic species will occur. The injected CO2 will be converted to solid carbonate minerals over millions of years [3]. Although the reaction occurring in the reservoir is complicated, the future for storage in low-permeability sandstone is great.
In the latest research, there are many laboratory core-flood experiments on CO2 saturation in the specimen and on the relative permeability composed of CO2 saturation using either an unsteady-state method [4-11] or a steady-state method [12,13]. The difference these two types of injection methods is whether to inject one fluid or to inject a fluid with a fixed ratio. Regarding the time spent on CO2 injection, the steady-state method spends a lot of time [14]. Especially in the low-permeability sandstone we use in this research, CO2 injection by steady-state method takes a lot of time. CO2 injection into the low-permeability sandstone by unsteady method is valid. The laboratory core-flood experiments were also carried out for a large number of rock cores such as the type of rock, porosity and their distribution and permeability. But most of the sandstone is high permeability. There are little studies on low-permeability sandstone for the CO2 storage [10,15]. Low-permeability sandstone is considered only as a shielding layer ("cap lock") [16]. In this study, we conduct the CO2 injection into the low-permeability sandstone as CO2 storage. Our target sandstone shows one or two -order low permeability than the sandstone in the latest researches [10,15]. The ultimate goal is to measure the relative permeability in order to grasp the two-phase flow behavior of water/brine and CO2 in the low-permeability sandstone. As a research in the preliminary stage, we evaluate the change of CO2 saturation under the reservoir condition during the long-hours CO2 injection. In this study, we developed an experimental system that could maintain pressure and temperature condition for a long time CO2 injection including the separator that obtains the weight of the discharged fluid. Our study complements a few data set of the low-permeability sandstone.
Rock Sample
We use Ainoura sandstone samples (23.4 kN/m3) for CO2 injection test. The sandstone was collected in the Sasebo coast area of north-west Kyushu Island, Japan. One of the largest coalfields in Japan is located near the rock acquisition area, and this kind of sandstone exists in large areas around Japan at the depths that would be appropriate for CCS reservoirs. The rock core (Figure 1) was shaped a cylindrical shape 50 mm in diameter and 100 mm in height.
Figure 2 shows polarizing microscope images of the petrographic thin section. The particle size of Ainoura sandstone is specified as 0.02-0.6 mm (well-sorted), and the main particle size is 0.1-0.3 mm (fine to medium grained). The grains show low-grade roundness and are homogeneous. The sandstone is classified as Arkosic sandstone and mainly composed of quartz and feldspar.
Pore-size distribution was estimated by a mercury porosimeter (SHIMADZU,AUTOPORE III). The sandstone has a bi-modal pore size distribution (showed in Figure 3, porosity: φ = 11.9%, pore size: peak = 103 nm and 105 nm).
Experiment
Experimental system
Reproducing in situ reservoir conditions, the temperature and pore pressure was above the critical point (31.1 ℃ 7.38 MPa) of CO2 and CO2 was to be a supercritical state. In this paper, we use "CO2" as supercritical CO2. A schematic diagram of the experimental system is shown in Figure 4. The temperature of entire experimental system and apparatus were set at 40 ℃. The flow injection method is combined the flow pump method [17] and the constant head permeability test method [18]. Both fluid and confining pressure were set by using syringe pumps. We used silicon oil for applying the confining pressure. The up and downstream pressures on the specimen were measured by pressure gauges able to measure hydraulic pressure. The differential pressure generated on both ends of the specimen was calculated by the difference between the pressure gauges (A and B) values on the up and downstream sides of the specimen.
We installed a separator with high-pressure resistance to estimate the CO2 saturation (SCO2) of the specimen during the CO2 injection test. In this study, CO2 displaced saturated water, and both fluids were produced on the downstream side. SCO2 in the pore volume of the specimen was measured by the weight change of the supercritical fluid vessel. Discharged fluid on the downstream side (a mixture water and CO2) flowed into the separator and was separated into water and CO2 based on the difference in their densities. Only water remained in the separator and CO2 was captured downstream side by the syringe pump. The weight change was monitored by the electronic balance under the separator continuously.
Experimental procedure
The rock core was soaked in water for a few days prior to being sealed with silicon. After soaking, the specimen was placed in a core holder, coated with silicon (5 mm thickness) for preventing CO2 escaping from the side of the core, and air dried for two days. The specimen was set into a triaxial chamber, which was filled with oil; any bubbles were discharged from the core by using a vacuum pump at the same time. The specimen was therefore initially in a water-saturated state. As compared with high-permeability rock, it is difficult to saturate low-permeability rock with water after it has been sealed with silicon, which is why we saturated the rock prior to coating it.
The experimental procedure can be divided into three steps: Preparation, water permeability testing, and CO2 injection testing.
First, the confining pressure was loaded using syringe pump 5 (Figure 4) to reach 10 MPa. After that, the confining pressure and pore pressure were increased to maintain a differential pressure value of 10 MPa as follows. Syringe pump 5 was set to gradually reach 20 MPa while syringe pumps 1 and 2 were set to reach 10 MPa. The temperature of the syringe pumps, pipes, and pressure vessels were set to be maintained at 40 ℃ by the temperature control system. The system was given about 24 hours for the pressure and temperature to stabilize.
After the pressure/temperature stabilized, the water injection test was conducted to measure the absolute permeability of the specimen. From the upstream side of the specimen, only water was injected at a constant flow rate (10 μL/min, syringe pumps 1), and the downstream boundary condition of constant pressure (10 MPa, syringe pumps 2) was maintained. The test was continued until the differential pressures upstream of the specimen reached a steady state. A corresponding value of permeability was later determined from the steady state pressure value by using Darcy's law (Eq. (1)).
After the water permeability test, pore pressure was reset to 10 MPa and remained in the experimental system between Valve A and B including the specimen and the separator and pipes. The initial condition of the specimen was water saturated for the CO2 injection test. The experimental system including pumps 1, 2, 3, and 4 were dried and filled with CO2. When the pressure and temperature reached 10 MPa and 40 ℃, respectively, we injected CO2 at a constant flow rate (10 μL/min). During the injection test, pressure gauge data, the flow rates of the syringe pumps, and the temperature of the experimental system was continuously recorded.
As with the water experiment, a separator was installed downstream of the specimen between valve B and pump 2. An electronic scale measured the weight of the separator and the fluid vessel at regular intervals. The separator was initially filled with CO2.
Experimental results
A time series of the measured differential pressure on up- and downstream of the specimen during the water permeability test is shown in Figure 5. From Darcy's law (Eq. (1)), permeability can be calculated as,
Where, Q is volumetric fluid (pure water) flow rate (m3/s), A is cross-sectional area of the specimen (m2), L is length of specimen (m), ΔH is differential pressure (Pa), µ is dynamic viscosity of the fluid (Pa s), ρ is the density of the fluid (kg/m3), and g is the acceleration due to gravity (m/s2). Water permeability or Hydraulic conductivity (k) at the steady state: was calculated to be 1.49 × 10⁻¹⁰ m/s, and absolute permeability (k0) at the steady state = 1.0916 × 10⁻¹⁷m2, (= 0.01 mD) from Eq. (2).
Figure 6 shows the measured differential pressure up- and downstream of the specimen and the weight data from the separator during the CO2 injection test. The differential pressure changes can be divided into three stages (A, B, and C, Figure 7).
Stage A (0-14 hours) is the period when CO2 pushes the water into the pipe on the upstream side but it does not reach to the specimen. This pattern and magnitude are similar to the results obtained from the previous water permeability test (Figure 5).
In stage B (14-36 hours), the differential pressure begins to increase more rapidly until it reaches a peak. At that time, the injected CO2 penetrates into the bottom of the specimen and begins displacing the saturated water in the specimen pores.
In stage C (36 hours to the end), the injected CO2 flows all the way through the specimen and becomes stable flow because it has more bypass rather than sweep flow with the water fractions trapped in the specimen pores (irreducible water saturation). This process was also suggested by Bennion and Bachu [14] as the characteristic flow in when the pore size distribution is bi-modal.
The separator weight change is zero from the start of CO2 injection to 10 hours. It indicated that discharged water has not reached the separator. At 10 hour, the value of weight increases, and at 41 hours, they stop. There is a 5-hour gap between the time the weight increases stopped (41 hours) and the differential pressure peaked (36 hours). This time lag was caused by the distance between the specimen and the separator.
Discussion; Estimation of CO2 Saturation
It was necessary to account for the time lag between the separator weight and differential pressure peaks in the estimation of SCO2. The basic concept of calculating SCO2 is that the volume of discharged water collected in the separator is equal to the volume of the injected CO2 occupying the pore space of the specimen. We estimated SCO2 for each of the three stages identified in the previous section. The density of water and CO2 is 996.5129 kg/m3 and 628.6112 kg/m3, respectively. We use these value to estimate the SCO2.
Stage A (0-14 hours)
The initial state of the separator is CO2 saturated (Figure 7). At the start of the procedure, the injected CO2 pushes the water in the upstream pipe and the water penetrates into the specimen. The result of differential pressure (Figure 6) shows that the CO2 reached the specimen 14 hours after the start of the procedure. The weight of the separator began to increase at about 10 hours. At that time, the pipe on the downstream side filled with water that was originally in the downstream pipe and the water discharged from the specimen. The weight increase from 10 to 14 hours is a result of this water being pushed into the separator. Therefore, although the weight of the separator increased during stage A, SCO2 did not increase (i.e., SCO2 = 0) until 14 hours.
Stage B (14-36 hours)
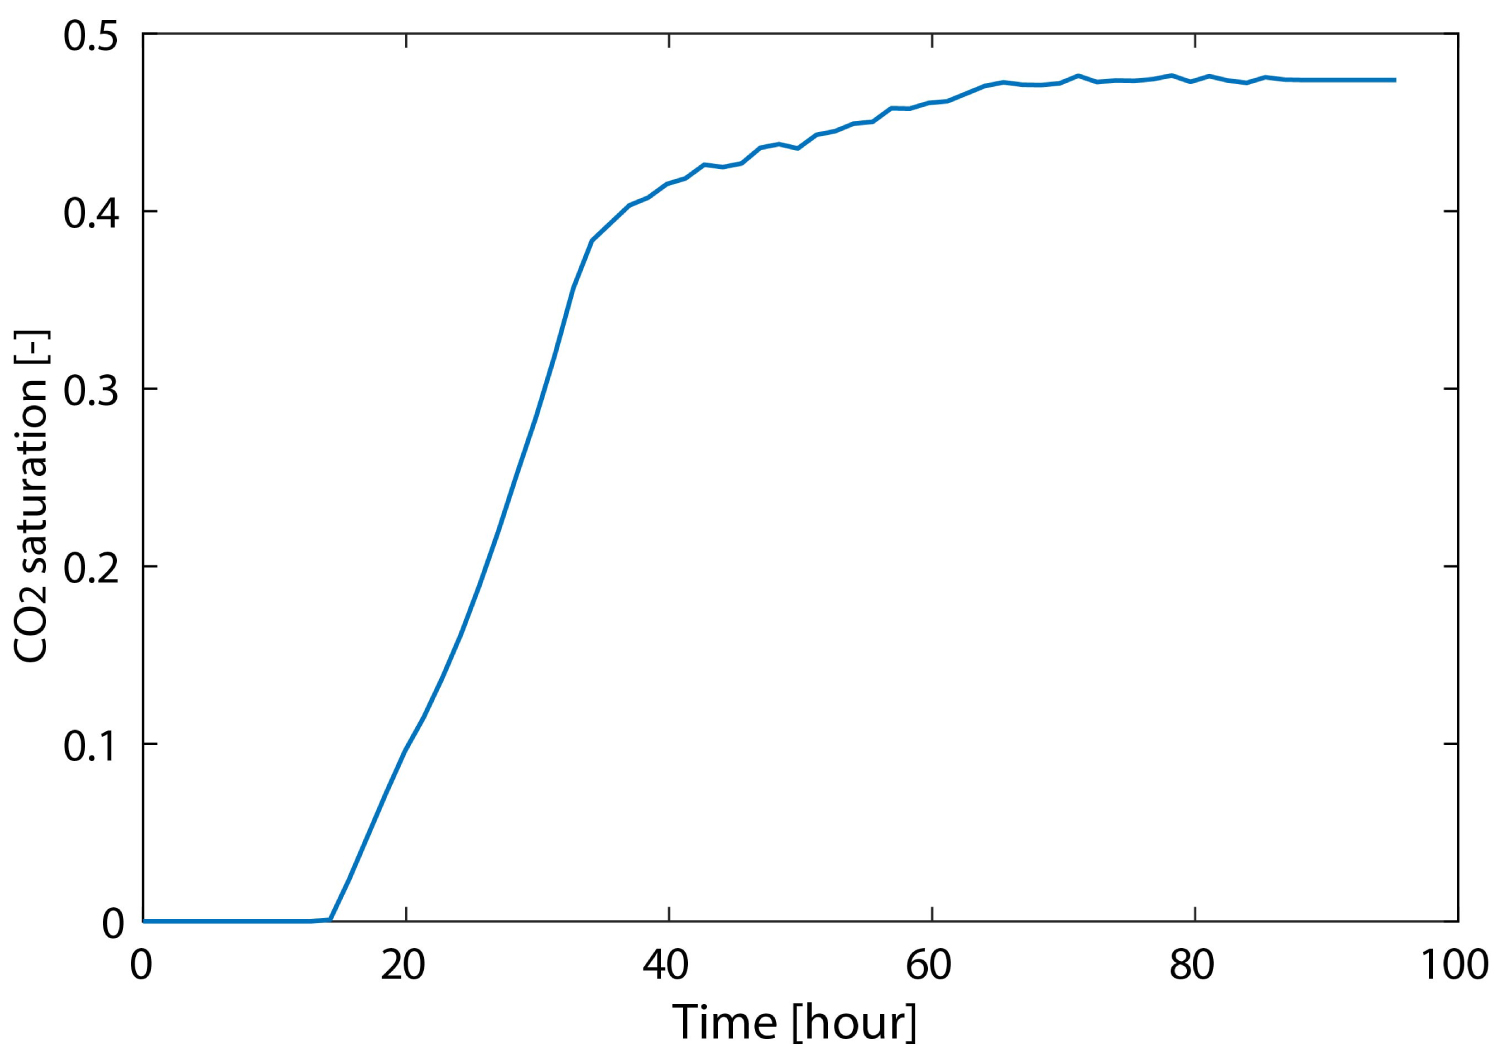
In this stage, CO2 penetrates into the specimen and the discharged fluid (only water) from the specimen is collected in the separator. In consideration of the 5 hour time lag, SCO2 from 14 to 36 hours was estimated by using separator data from 19 to 41 hours. The increase in separator weight was caused by the displacement of injected CO2 and saturated water. Because the weight increment of the separator is the difference between the initial weight of CO2 in the separator and the weight of water flowing into the separator, the volume of extruded water from the specimen can be calculated from the separator data. Moreover, SCO2 can be calculated by dividing the volume of extruded water from the specimen by the void volume of the specimen. Using the method, SCO2 was estimated to be as much as up to 0.39 at 36 hours.
Stage C (36 hours to the end)
After CO2 passes through ("breaks through") the specimen, the weight of the separator increased slowly and eventually became stable. In this state, the CO2 gradually expands the flow path and the discharged fluid from the specimen is a fluid mixture of water and CO2. The discharged water from the specimen was captured in the separator. SCO2 was calculated by using the weight change of the separator as was done in stage B. 41 to 72 hours SCO2 increased slightly. From 72 hours, the CO2 flow path no longer expanded. For the estimation of SCO2, there is no data for the last 5 hours, which shifts the data of the separator forward 5 hours. However, since the weight of the separator did not change from around 72 hours, the last value of SCO2 is assumed to be continuous for the last 5 hours. Final SCO2 shows 0.47. Estimated change of SCO2 summarizes in Figure 8.
Compared with our previous research [19], SCO2 shows larger value (We got only the maximum SCO2). Due to the different experimental system, sample size, experimental conditions and flow rate, we could not simply compare, but maximum SCO2 increased to 0.55 by increasing the injection rate. In the previous study, we also reported the consistency of the relationship between SCO2 and P-wave velocity measured during the CO2 injection.
From the other studies [4-16,20, 21], SCO2 varies from 0.10 to 0.60. The value obtained from this study is within the range. According to the CO2 injection on low-permeability or low-porosity sandstone (smaller than 1 mD or 15%) by unsteady-state method, SCO2 show 0.67 (Nugget, porosity = 14.28% [10]), 0.2 to 0.40 (Carbonate rock, porosity = 14.0% [20]), 0.48 (Rock core from the Erdos Basin, 0.59 mD, porosity = 12.4% [15]).
Conclusions
Supercritical CO2 injection test was carried out into low-permeability sandstone at a low flow rate by the unsteady method. We measured changes in the differential pressure between both ends of the specimen, flow rate and weight of discharged fluid from the specimen. CO2 saturation of low-permeability sandstone was also obtained by the mass-balance method and rose up to 0.47. These results indicate that low-permeability sandstone has a potential to storage CO2 in terms of CO2 saturation. We will conduct more experiment to improve accuracy and install the geophysical exploration technology for monitoring the CO2 behavior.
Acknowledgements
This work was supported by JSPS KAKENHI Grant Number JP16J05780 and Grant-in-Aid for Scientific Research (B) Number 25289331.