
International Journal of Earth Science and Geophysics
(ISSN: 2631-5033)
Volume 6, Issue 1
Research Article
DOI: 10.35840/2631-5033/1831

Article Formats
Geoelectrical Parameters for the Estimation of Groundwater Potential in Fracture Aquifer at Sub-Urban Area of Abakaliki, SE Nigeria
Table of Content
Figures
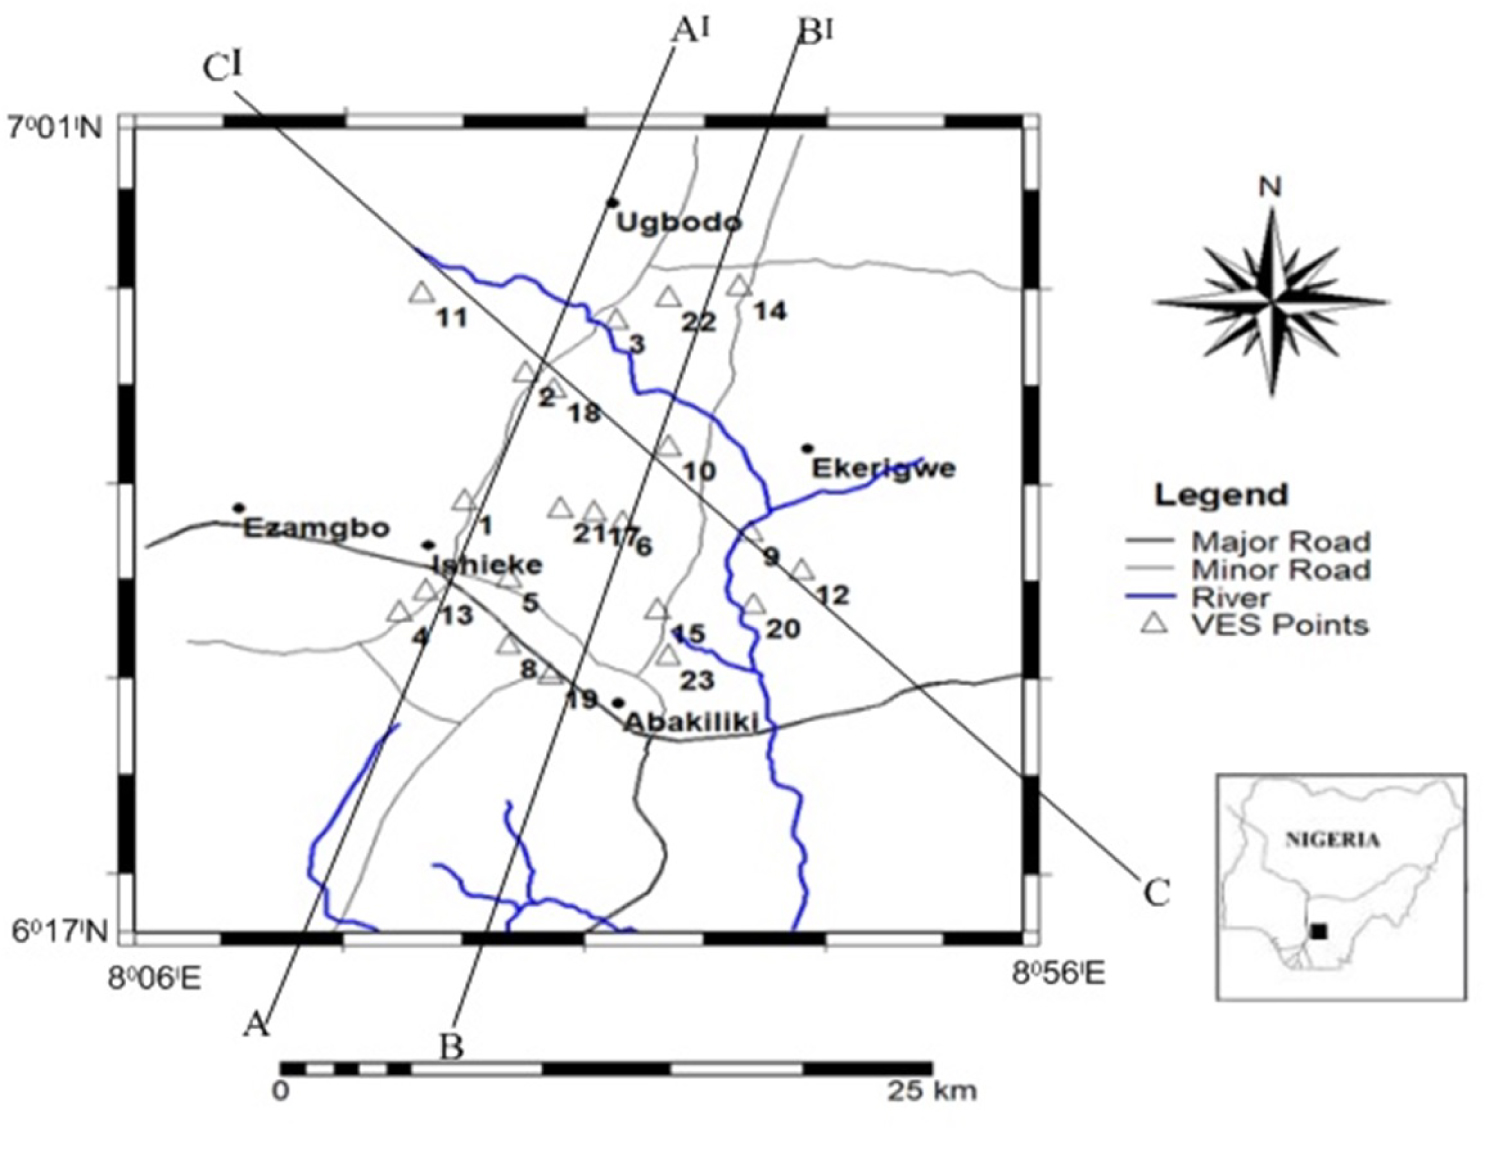
Figure 1: Topographic Map of the Study area....
Topographic Map of the Study area Showing VES points.
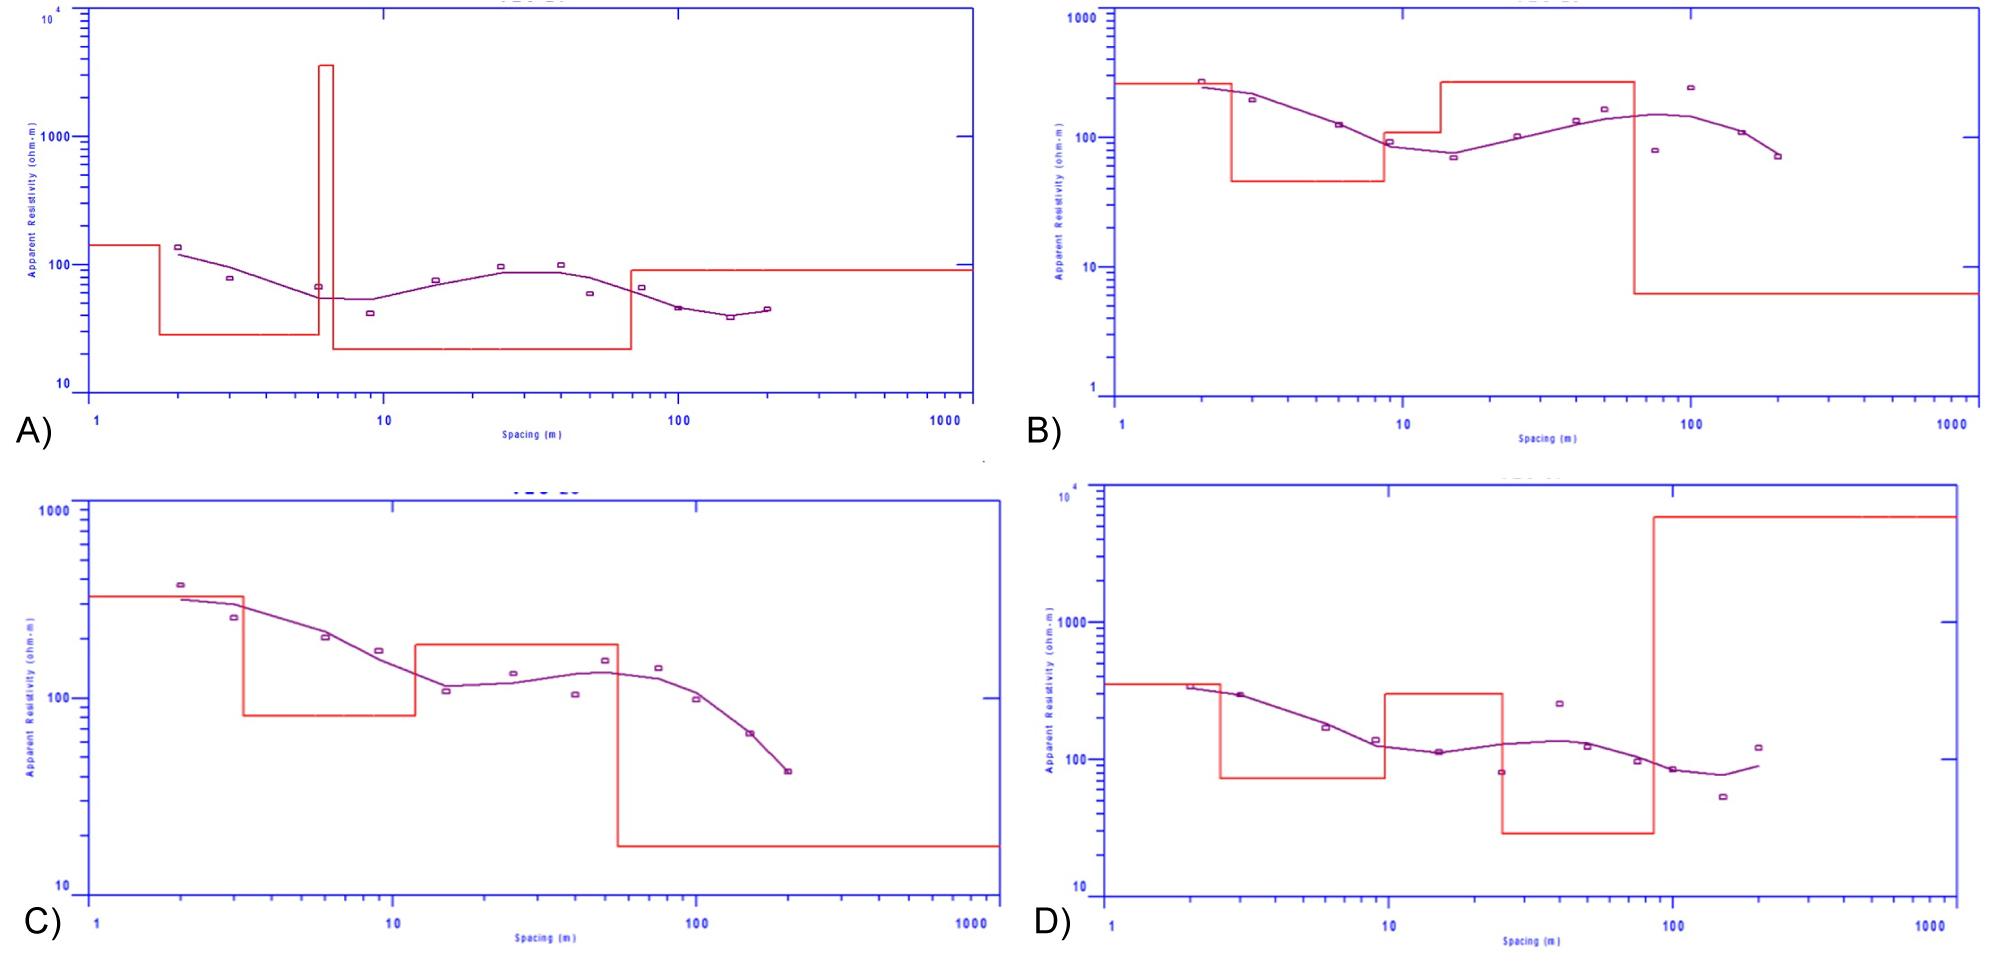
Figure 2: a) Modeling of a sounding point of VES 1. Curve....
a) Modeling of a sounding point of VES 1. Curve Type: HK (ρ1 > ρ2 < ρ3 > ρ4); b) Modeling of a sounding point of VES 6. Curve Type: HK (ρ1 > ρ2 < ρ3 > ρ4); c) Modeling of a sounding point of VES 10. Curve Type: HK (ρ1 > ρ2 < ρ3 > ρ4); d) Modeling of a sounding point of VES 16. Curve Type: Q (ρ1 > ρ2 > ρ3).
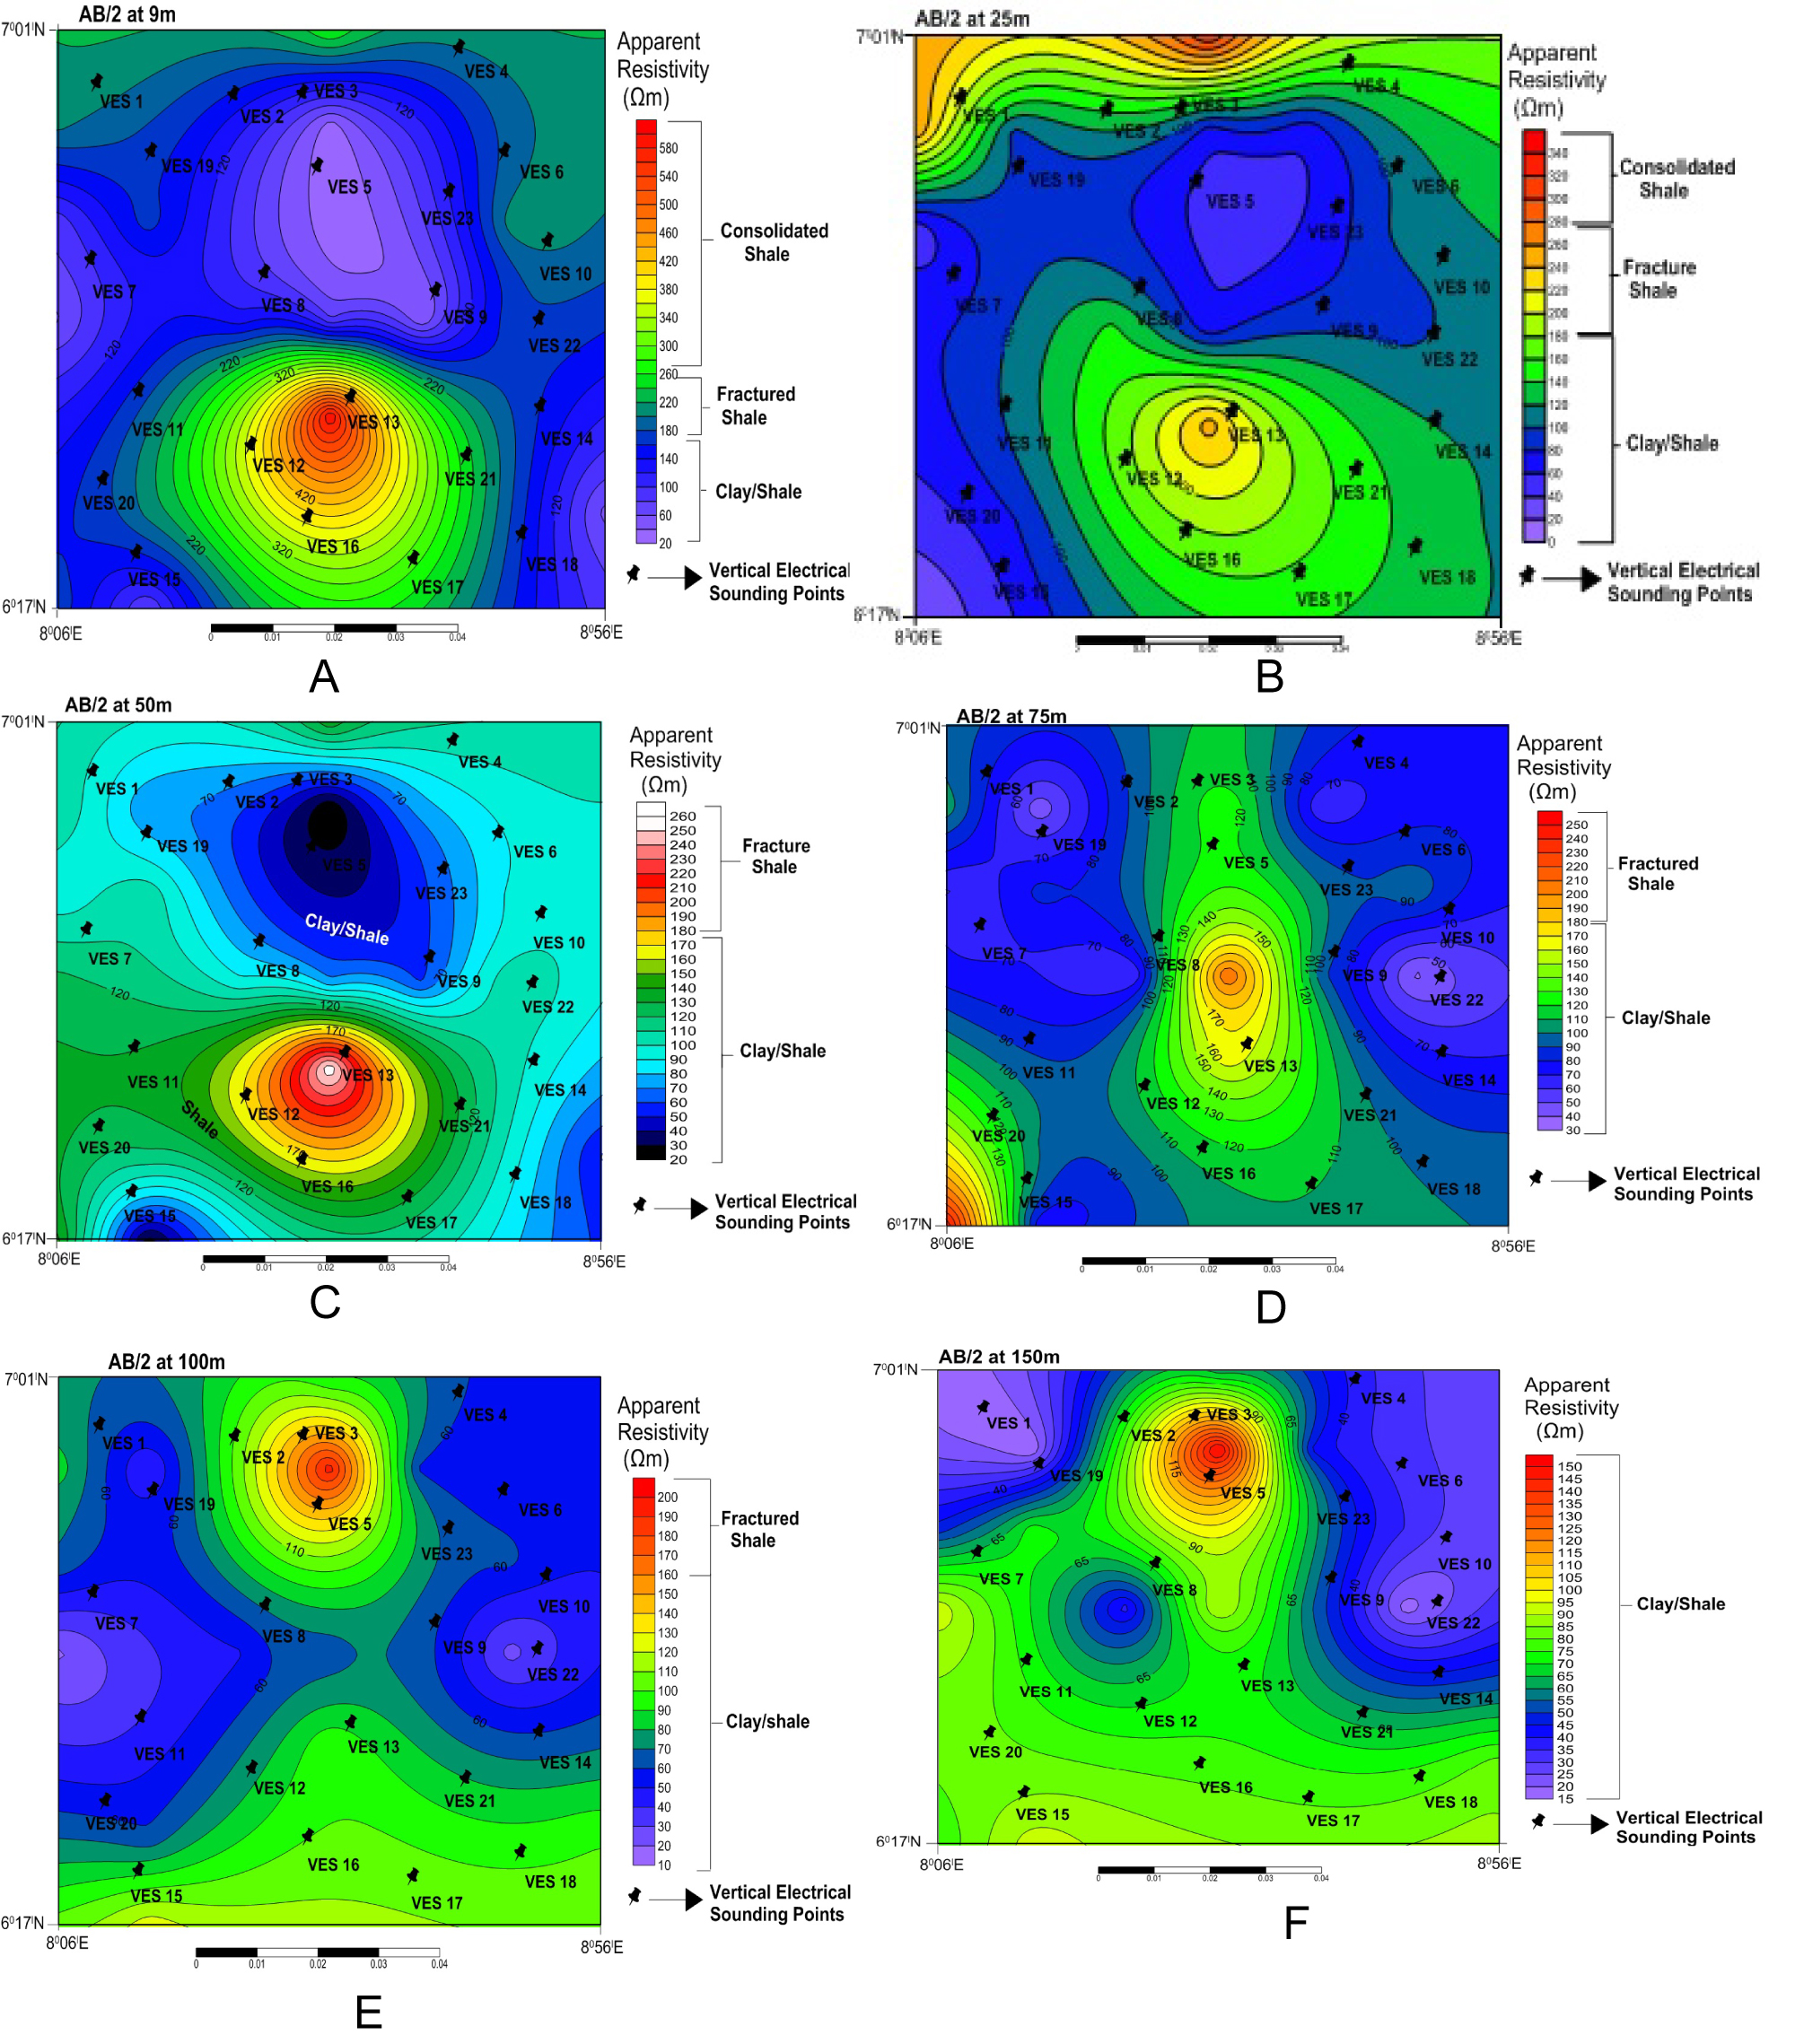
Figure 3: a-f) Depth slicing at AB/2 at spacing of....
a-f) Depth slicing at AB/2 at spacing of 9, 25, 50, 75, 100 and 150 m respectively.
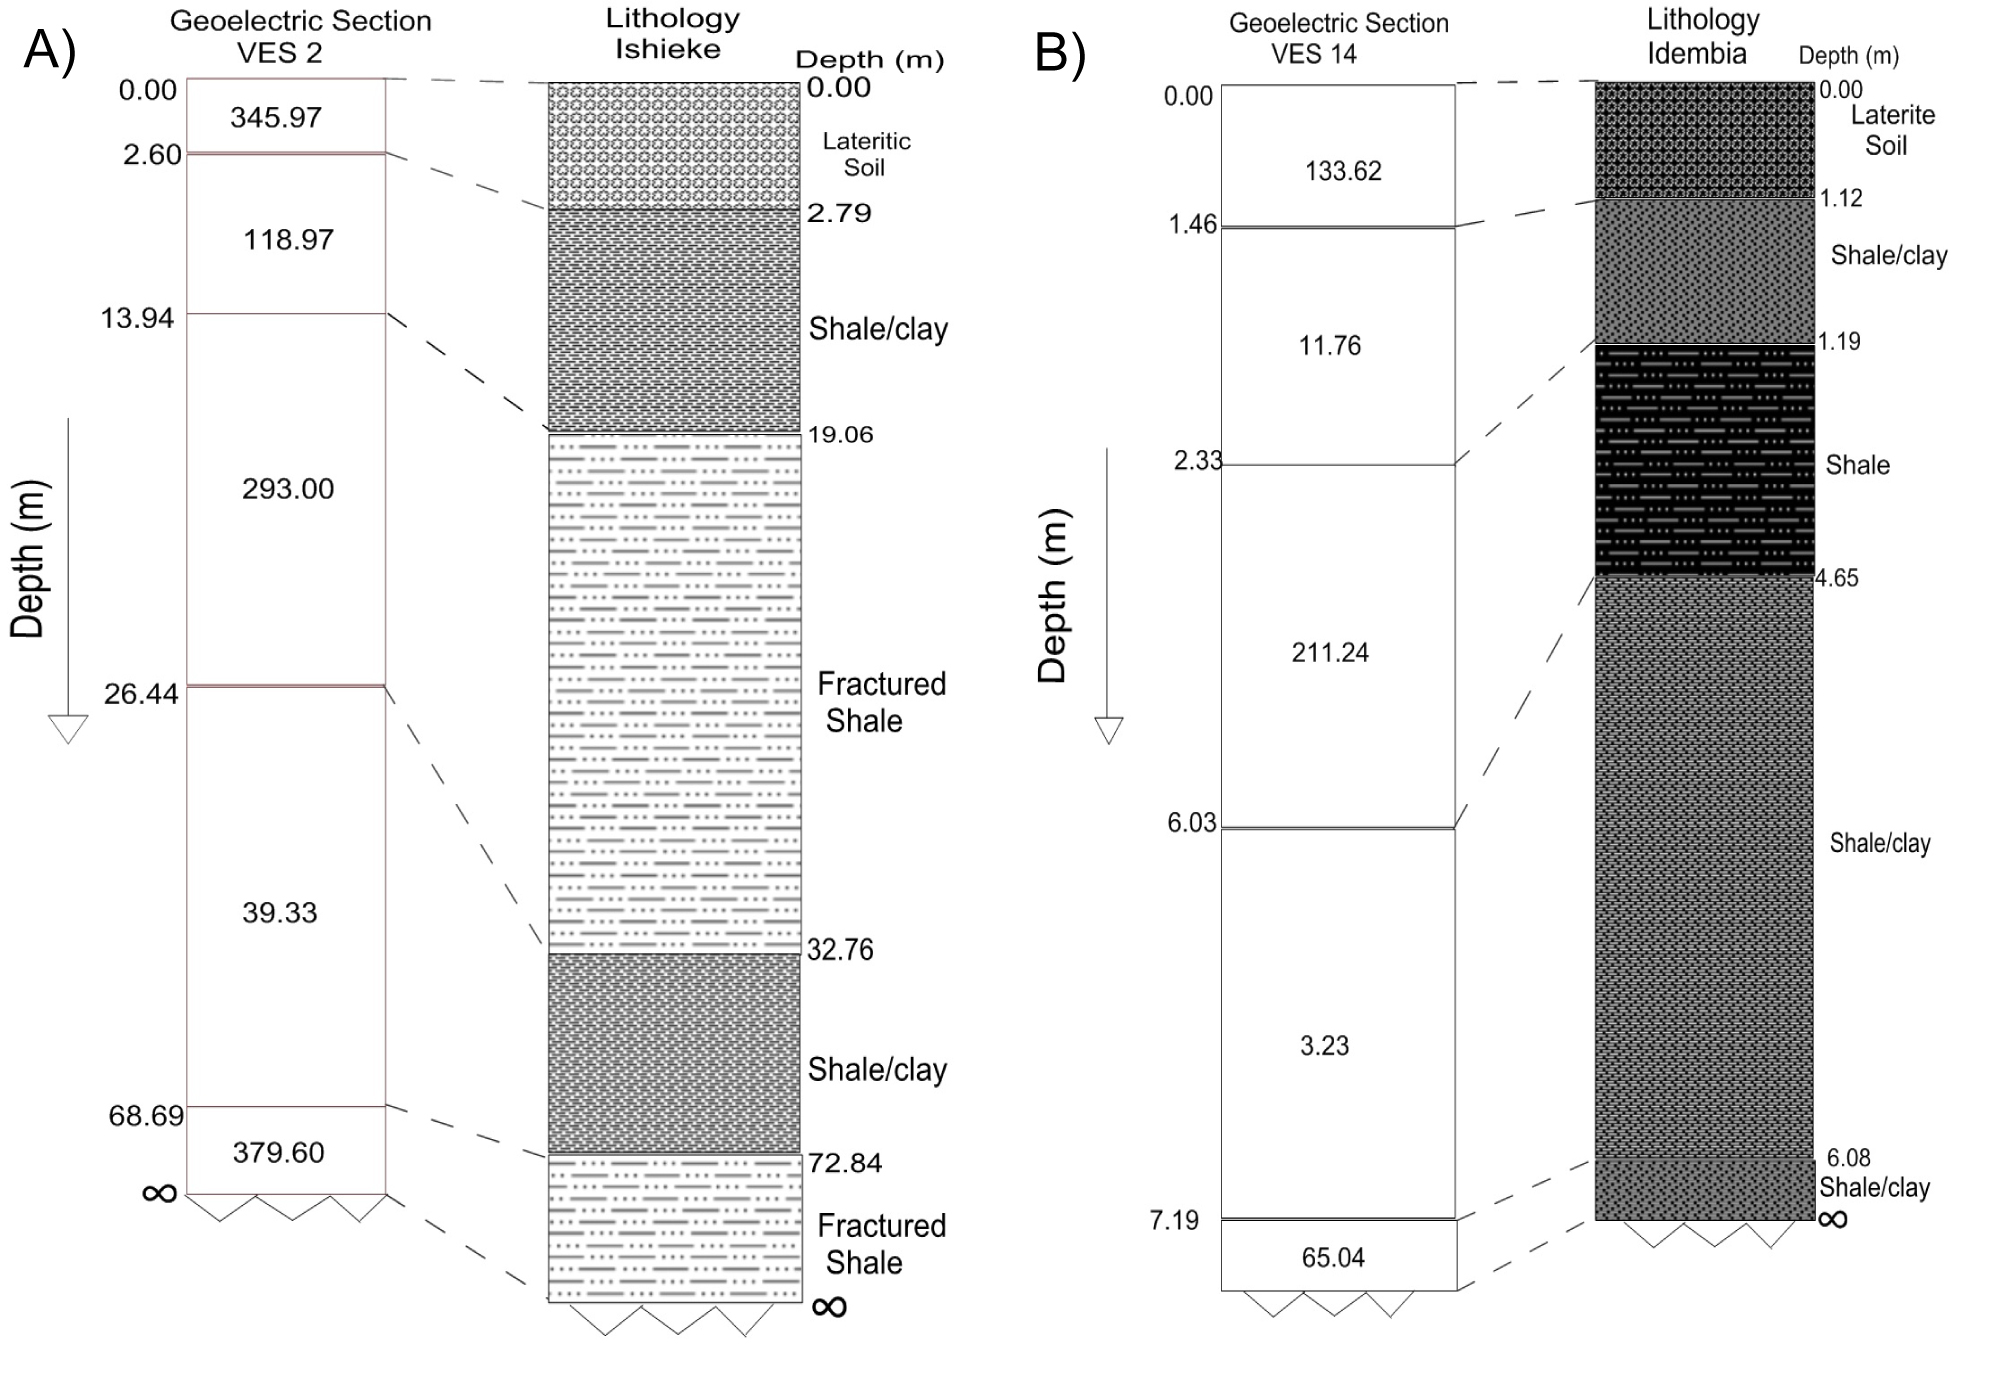
Figure 4: a,b) Geo-electric-lithologic logs correlation....
a,b) Geo-electric-lithologic logs correlation of the Ishieke (Successful) and Idembia (failed) area respectively.
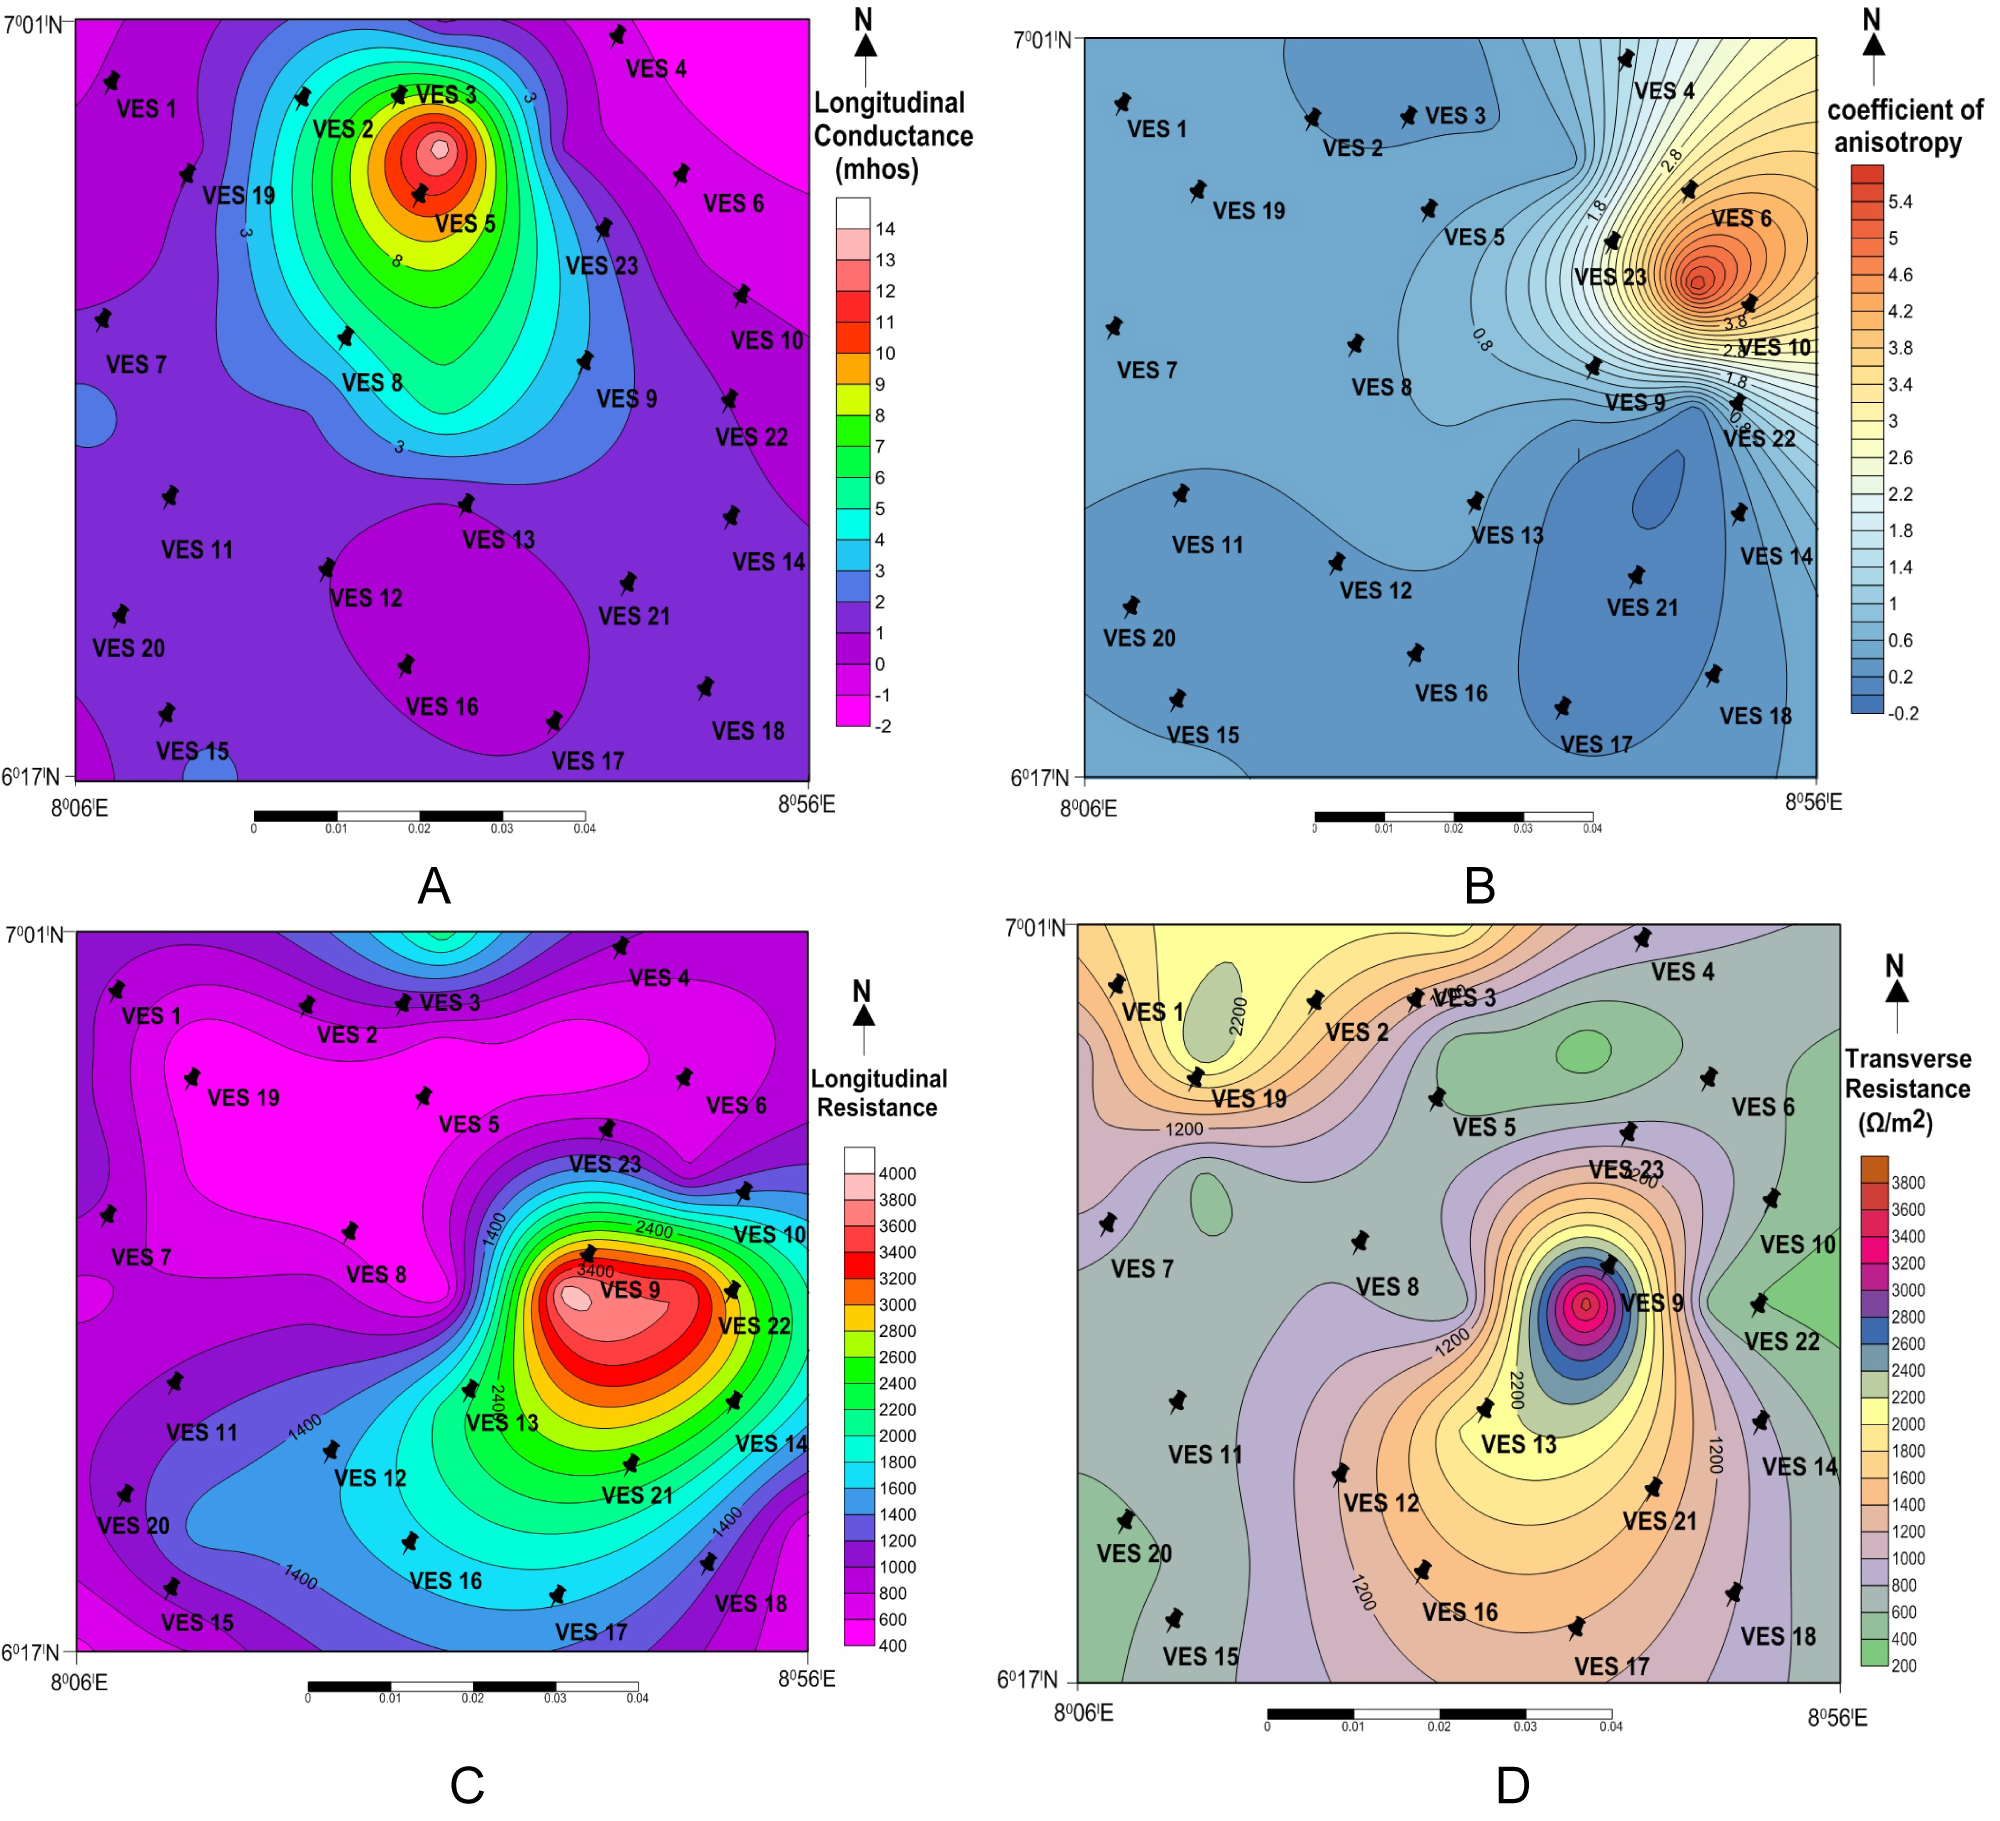
Figure 5: a-d) Plot of Longitudinal conductance, coefficient....
a-d) Plot of Longitudinal conductance, coefficient of anisotropy, longitudinal resistivity and transverse resistivity respectively.
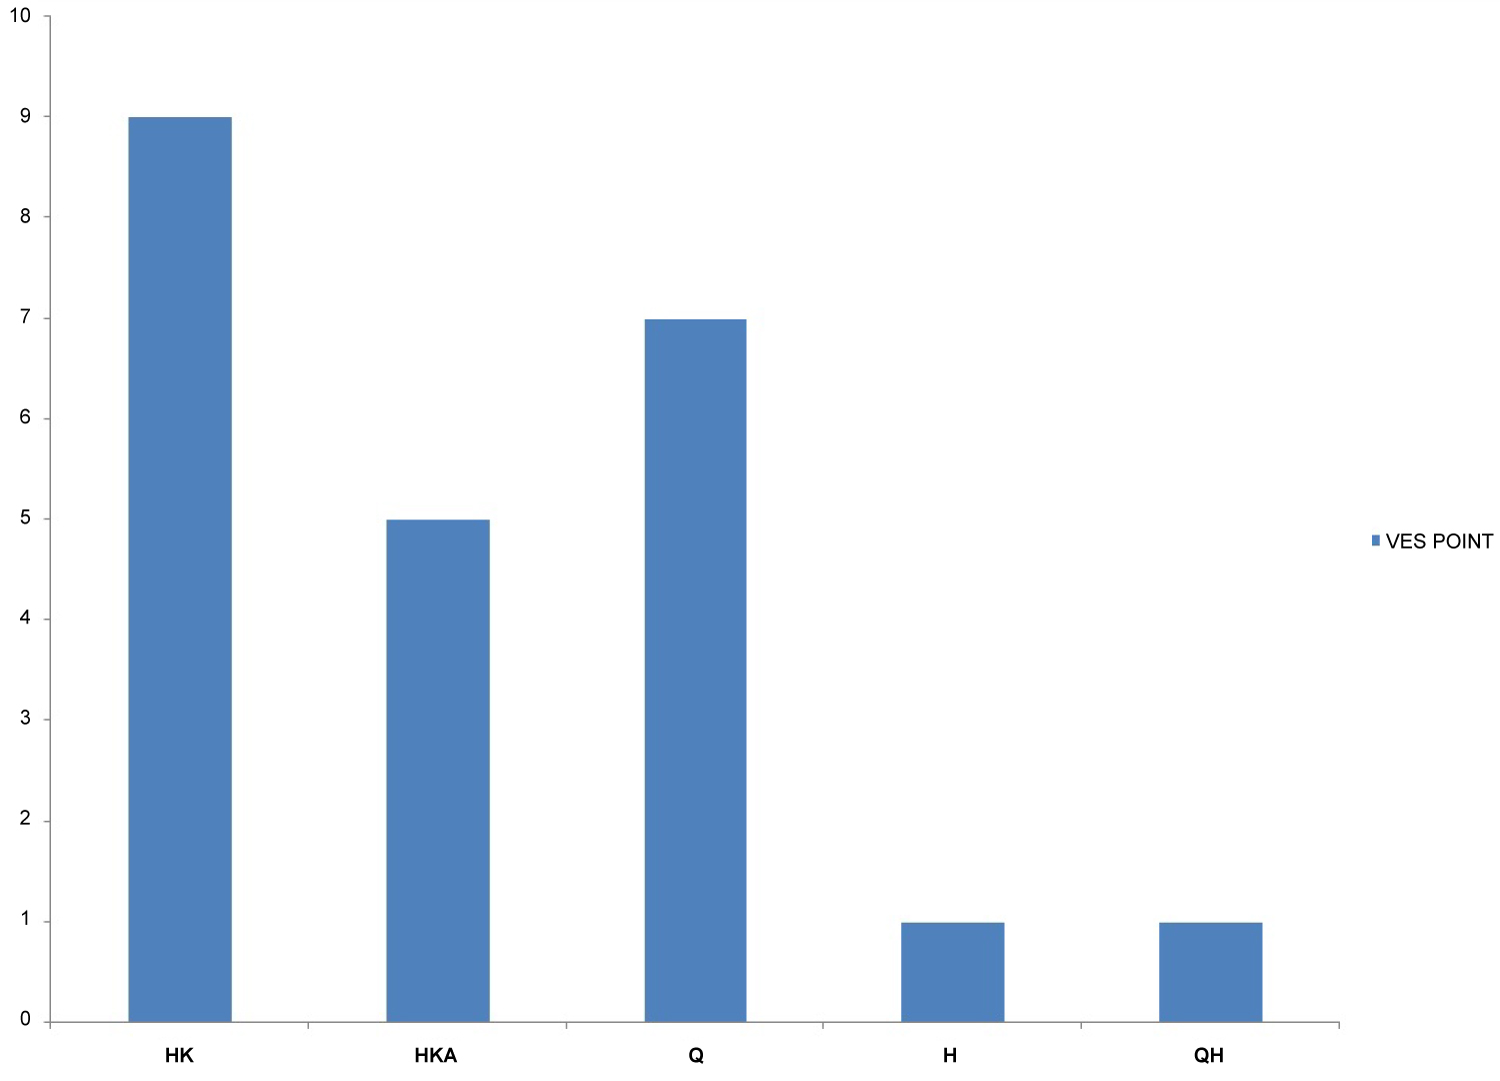
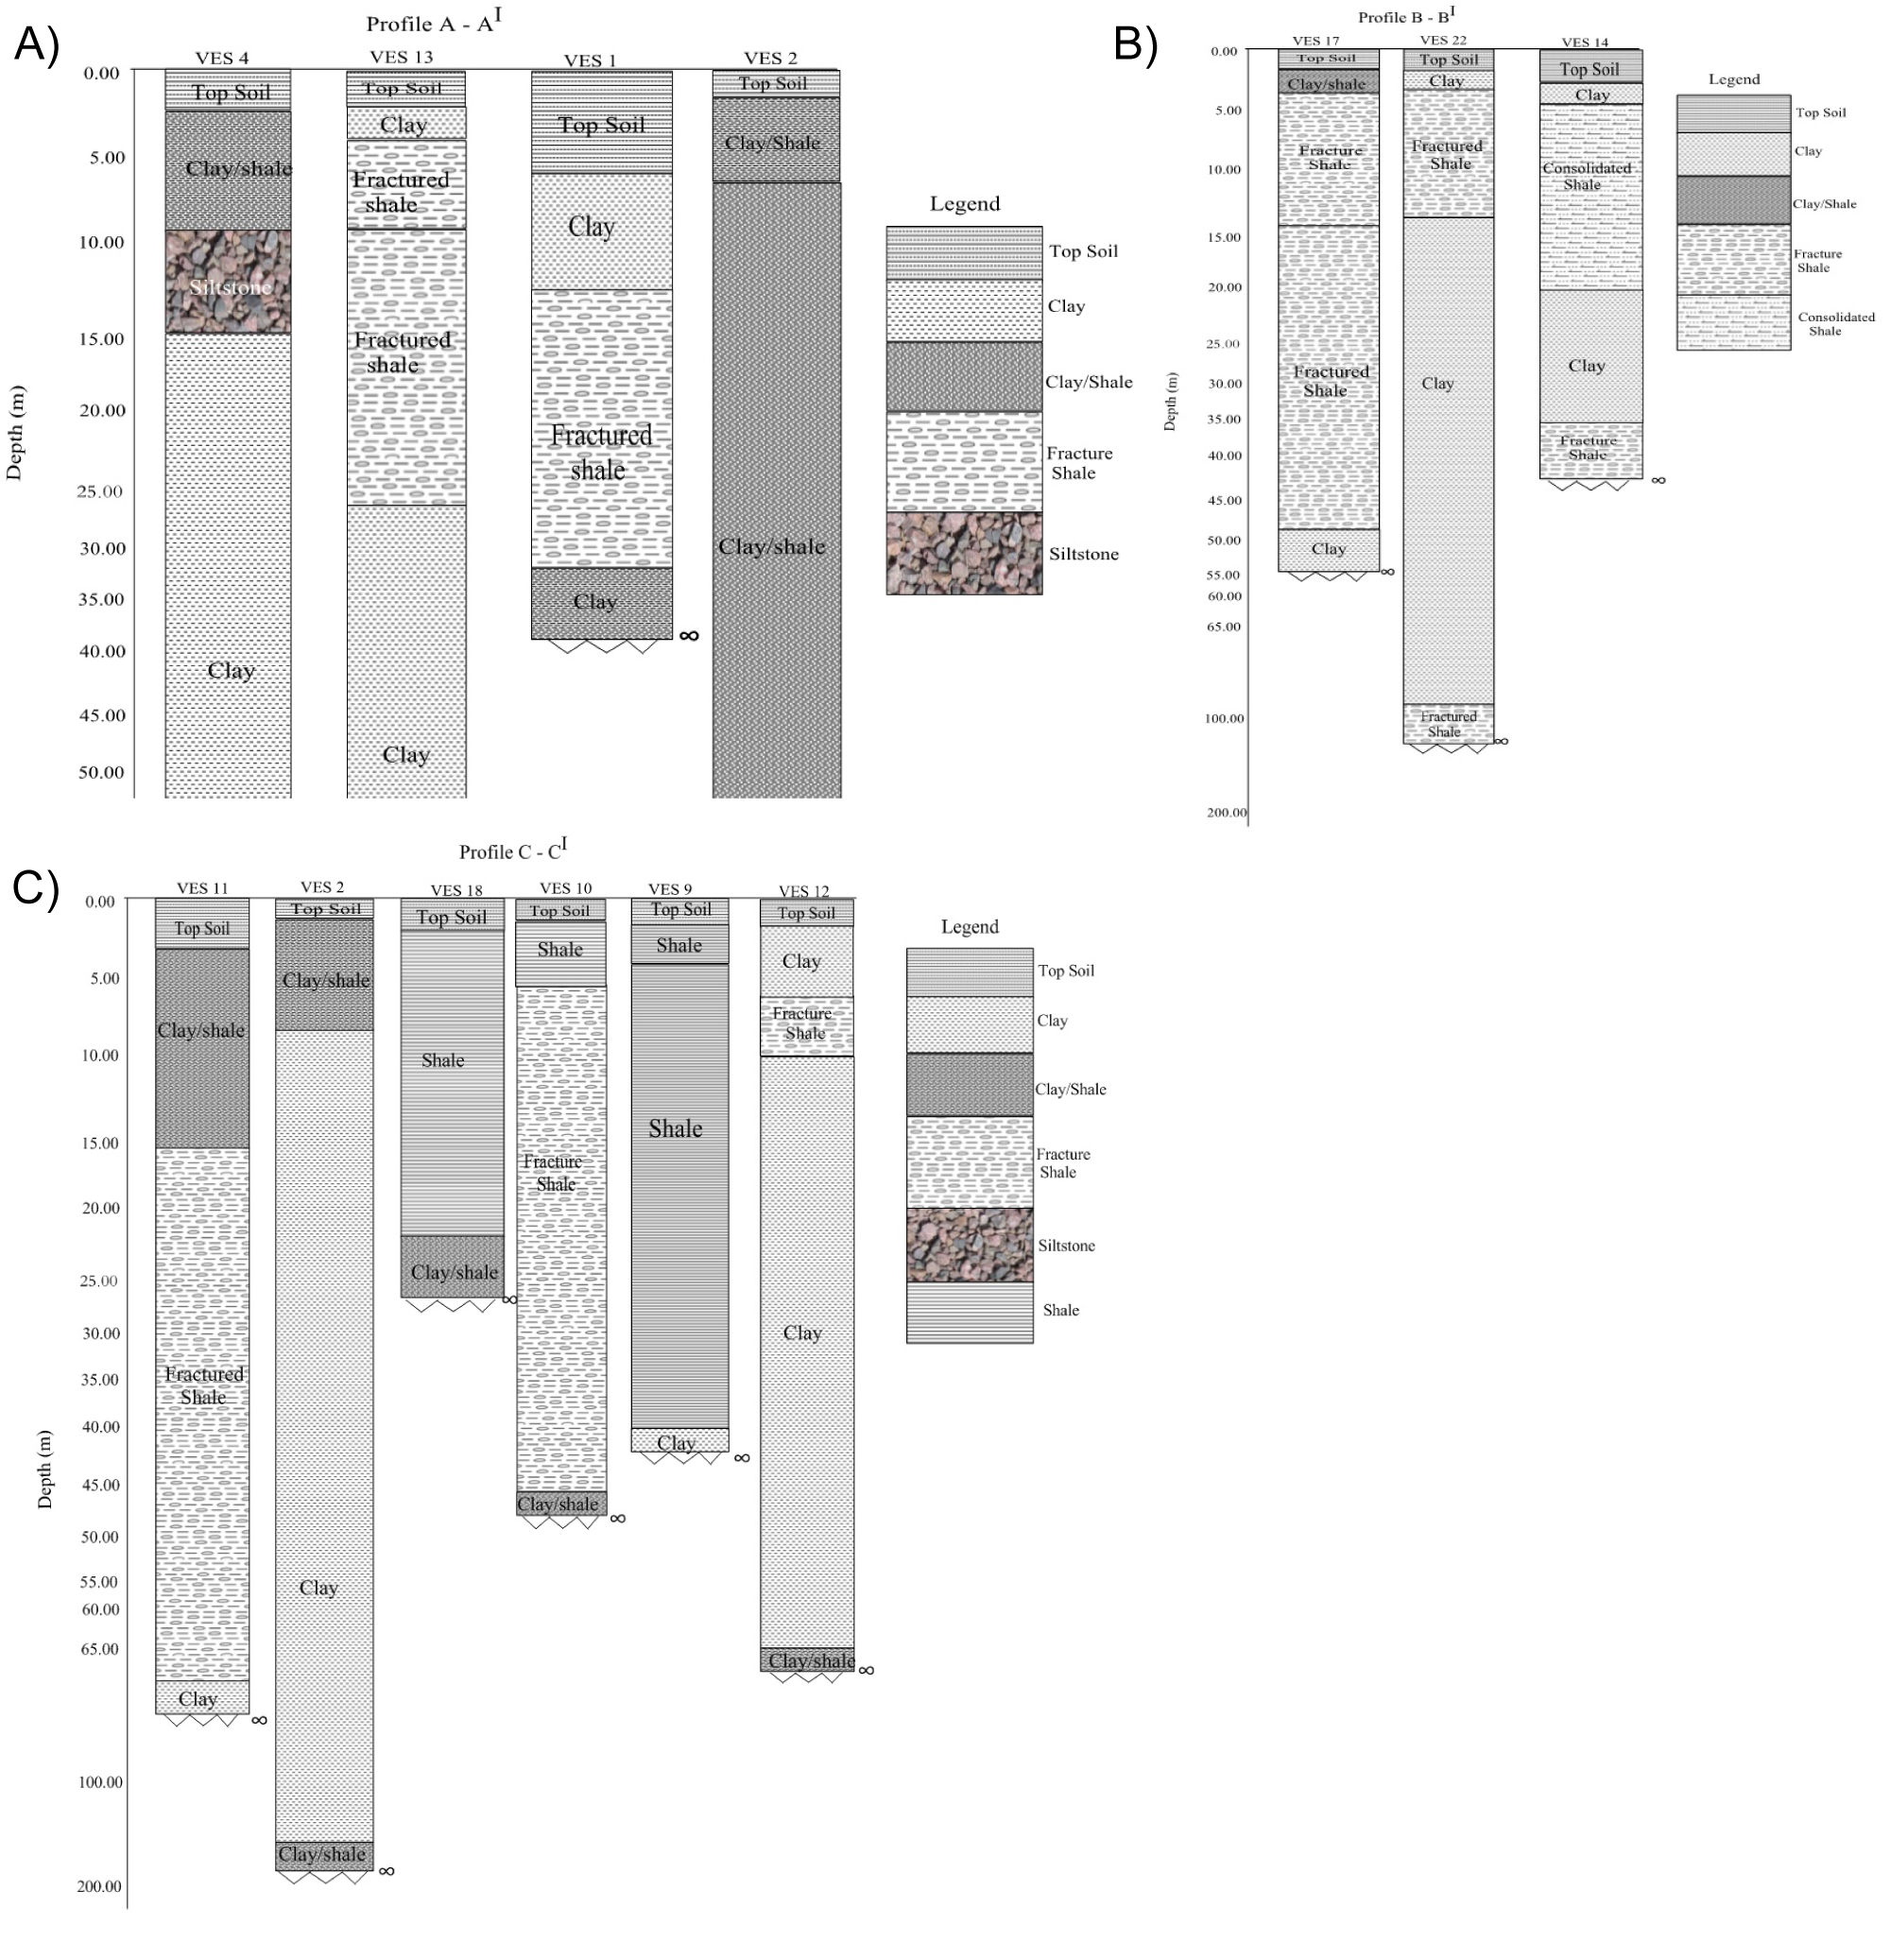
Figure 7: a) Profile of A-AI; b) Profile of B-BI....
a) Profile of A-AI; b) Profile of B-BI; c) Profile of C-CI.
Tables
Table 1: Summary of geophysical processes.
Table 2: Resistivity value of VES Points.
Table 3: Aquifer protective capacity rating of the studied formation on the basis of Oladapo and Akintorinwo's [22] longitudinal conductance scale.
Table 4a: Values of resistivity, thickness and depth for VES 1.
Table 4b: Values of Resistivity, Thickness and depth for VES 14.
Table 4c: Values of Resistivity, Thickness and depth for VES 27.
Table 4d: Values of Resistivity, Thickness and depth for VES 32.
Table 5: Description of AB/2 at various Spacing (9, 25, 50, 75, 100 and 150 m).
References
- Anomohanran O (2015) Hydrogeophysical and hydrogeological investigations of groundwater resources in Delta Central, Nigeria. Journal of Taibah University for Science 9: 57-68.
- Ebong D Ebong, Anthony E Akpan, Anthony A Onwuegbuche (2014) Estimation of geohydraulic parameters from fractured shales and sandstone aquifers of Abi (Nigeria) using electrical resistivity and hydrogeologic measurements. Journal of African Earth Sciences 96: 99-109.
- Eduvie MO (2002) Hydro-geological geophysical evaluation of groundwater resources of the gundumi formation and around Daura, North Western Nigeria, Water Resources. Journal of Nigeria Association of Hydro-geologist (NAH) 13: 46-49.
- Egwebe O, Aigbedion I, Ifedili SO (2004) A geo-electric investigation for groundwater at Ivbiaro Ebesse; Edo State: Nigeria. J of Appl Sci 22: 146-150.
- Oni TE, Omosuyi GO, Akinlalu AA (2017) groundwater vulnerability assessment using hydrogeologic and geoelectric layer susceptibility indexing at Igbara Oke, Southwestern Nigeria. NRIAG Journal of Astronomy and Geophysics 6: 452-458.
- Nwajide CS (2013) Geology of Nigeria's Sedimentary Basin. CSS Bookshops Ltd, Lagos, Nigeria, 56-98.
- MacDonald AM, Davies J (1997) Report on visit to undertake field work in support of the Oju community water supply and sanitation project. Water Aid Nigeria Internal Report.
- Murat RC (1972) Stratigraphy and paleogeography of the cretaceous and lower tertiary in Southern Nigeria. In: TFJ Dessauvagie, AJ Whiteman. African Geology, Ibadan University Press, Ibadan, Nigeria, 251-266.
- Hoque M (1977) Petrographic differentiation of tectonically controlled cretaceous sedimentary cycles, southeastern Nigeria Sedimentary Geology 17: 235-245.
- Reyment RA (1965) Aspects of the geology of Nigeria; the Stratigraphy of the Cretaceous and Cenozoic Deposits. Ibadan University Press, Ibadan, Nigeria.
- Benkhelil J (1989) The origin and evolution of the cretaceous benue trough (Nigeria). Journal of African Earth Sciences (and the Middle East) 8: 251-282.
- Farrington JL (1952) A preliminary description of the Nigerian lead zinc field. Economic Geology 47: 583-608.
- Agumanu AE (1989) The Abakaliki and the Ebonyi Formations: Sub-divisions of the Albian Asu River group in the Southern Benue trough, Nigeria. Journal of African Earth Sciences (and the Middle East) 9: 195-207.
- Cocker MD (1995) Geochemistry and hydrochemistry of the Oconee River Basin. In: Hatcher KJ, Proceedings of the 1995. Georgia Water Resources Conference, University of Georgia, Athens, Georgia, 67-70.
- Nwachukwu SO (1972) The tectonic evolution of the southern portion of the Benue Trough, Nigeria. Geological Magazine 109: 411-419.
- Orellaila E, Mooney HM (1966) Master tables and curves for vertical electrical sounding over layered structures. Interciencia, Madrid, 150.
- Kumar D, Rai SN, Thiagarajan S, Kumari R (2014) Evaluation of heterogeneous aquifers in hard rocks from resistivity sounding data in parts of Kalmeshwar taluk of Nagpur district, India. Curr Sci 107: 1137-1145.
- Chang SW, Clement TP, Simpson MJ, Lee K (2011) Does sea-level rise have an impact on saltwater intrusion? Advances in Water Resources 34: 1283-1291.
- Mele M, Bersezio R, Giudici M, Rusnighi Y, Lupis D (2010) The architecture of alluvial aquifers: An integrated geological-geophysical methodology for multiscale characterization. Mem Descr Carta Geol. d'It XC, 209-224.
- Maillet R (1947) The fundamental equations of electrical prospecting. Geophysics 12: 529-556.
- Olorunfemi MO, Ojo JS, Akintunde OM (1999) Hydro-geophysical evaluation of the groundwater potential of the Akure metropolis, southwestern Nigeria. J Min Geol 35: 207-228.
- Oladapo MI, Akintorinwa OJ (2007) Hydrogeophysical study of Ogbese, Southwestern, Nigeria. Glob J Pure Appl Sci 13: 55-61.
- Bhattacharya PK, Patra HP (1968) Direct current geoelectric sounding. Principles and Interpretation, Elsevier Publ Co, New York, 135.
- Henriet JP (1975) Direct application of the dar-zarrouk parameters in groundwater surveys. Geophys Prospect 24: 344-353.
- Braga ACO, Filho WM, Dourado JC (2006) Resistivity (DC) method applied to aquifer protection studies. Revista Brailiera Geofysica 24: 573-581.
- Toto EA, Kerrouri C, Zouhri L, Basri El, Ibenbrahim A, et al. (2008) Geoelectrical exploration for groundwater in Al Maha Forest, Ain Jouhra, Morocco. Hydrol Processes 22: 1675-1686.
- Telford M, Geldart LP, Sheriff RE, Keys DA (1976) Applied geophysics, Cambridge University Press, Cambridge.
Author Details
MO Eyankware1*, C Ogwah1, and AOI Selemo2
1Department of Geology, Faculty of Science, Ebonyi State University, Abakaliki, Nigeria
2Department of Geosciences, Federal University of Technology, Owerri, Imo State, Nigeria
Corresponding author
MO Eyankware, Department of Geology, Faculty of Science, Ebonyi State University, Abakaliki, Nigeria, Tel: +2348065269907.
Accepted: January 11, 2020 | Published Online: January 13, 2020
Citation: Eyankware MO, Ogwah C, Selemo AOI (2020) Geoelectrical Parameters for the Estimation of Groundwater Potential in Fracture Aquifer at Sub-Urban Area of Abakaliki, SE Nigeria. Int J Earth Sci Geophys 6:031
Copyright: © 2020 Eyankware MO, et al. This is an open-access article distributed under the terms of the Creative Commons Attribution License, which permits unrestricted use, distribution, and reproduction in any medium, provided the original author and source are credited.
Abstract
There is a limited availability of groundwater potential within the study area, as there is steady increase in population due to movement of various faculties to main campus of Ebonyi State University (Perm Site). Therefore new water supplies are required to meet the demands for water. A combination of resistivity and borehole data were used to identify different water bearing horizons and their protective capacity. Twenty-three Vertical Electrical Soundings (VES) using the Schlumberger configuration with maximum current electrode separations of 200 m was used to map the subsurface lithology. Distribution of the resistivity values at different depths were presented in maps. Correlation of the obtained resistivity values with the geology of the area showed three to six layers with varying hydrological properties exist in the study area. The fracture shale is identified as good water bearing formation and this formation possess low to high longitudinal conductance, high transverse resistance, and anisotropy values.
Keywords
Groundwater, Vertical electrical sounding, Aquifer, Fractured Shale and Dar-Zarrouk
Introduction
Water is regarded as one of the most important natural resource that sustains life on earth, it exist as surface water (lakes, streams, river and sea) and beneath the earth surface as groundwater. Anomohanran [1], stated that fresh surface water can be assessed easily in most places except for areas in the desert regions. Despite this advantage of easy accessibility, surface water is often polluted by anthropogenic activities making groundwater to be a viable option in satisfying our demand for quality water. Water scarcity and its quality is global problem especially in developing nations, the sustainable development goal is gear toward reduced water scarcity and also increase its quality to improve on human health. The study area is not left out in water scarcity challenge as various faculties of the Ebonyi State University has been moved by the state government from Presco campus to its Permanent site thereby causing increasing in population within the Permanent site main campus in turn resulting in high demand for groundwater. Various geophysics and specifically, geoelectrical resistivity method is generally, considered to be the most promising and most suitable method for ground water prospecting [2-4]. The vertical electrical sounding (VES) which essentially determines the vertical variation of subsurface resistivity with depth has been very successful in delineating subsurface layering, overburden thickness and depth to fractured aquifer. The geoelectrical resistivity surveys for groundwater exploration has also been used in determining aquifer protective capacity [5]. The selection of geophysical methods in groundwater exploration depends on the on the contrast between the physical properties of the target and the surrounding medium. For the purpose of this study emphasis will be place fractured shale aquifer, because groundwater within the study area exist in fracture shale [2,6]. MacDonald and Davies [7], stated that the predominant lithology in the study area is shale which ordinarily lacks the required permeability to supply water at economic quantity. However, previous research suggested that only where the shales are significantly fractured that you have water of economic quantity [6]. The study was aim at determining groundwater potential and protective capacity of water bearing unit.
Location and accessibility
The area is located between latitude 6017/N - 7001/N and longitude 8006/ E - 8056/E (Figure 1). It located close to Abakaliki the state capital in Ebonyi State. The area is accessible through Enugu- Abakaliki express way and network of other roads.
Geology of the study area
The area falls within the Lower Benue Trough (SBT). Murat [8] and Hoque [9] gave detailed information on lower Benue Trough using three tectonic sedimentary cycles, namely: Marine transgressions and regressions which started from the Albian to the Coniacian in age [6]. Marine transgression was the first that occurred in Benue Trough within the middle Albian period, with the deposition of the Asu River Group [8] Reyment [10]. The Asu River Group sediments are predominantly underlain by shales as stated by Reyment [10]. (Figure 2), siltstone, sandstone and limestone facies as well as extrusive and intrusive. Benkhelil [11] stated that Asu River Group has an average thickness of about 2000 m and uncomfortably overlies the Precambrian Basement. The Santonian tectonic phase give rise to series of fracturing and folding of these rocks, giving rise to chains of anticlines and syncline known as the Abakaliki Anticlinorium [10]. The dominant fracture trend that hosts the lead-zinc forming minerals is in NW- SE and NNW- SE [12]. In addition Agumanu [13], demarcated the Asu River Group sediment into Abakaliki and Ebonyi Formations. The Abakaliki formation is predominantly dark grey colored shale (weathered to brownish material in the greater part of the formation), blocky, and indurated in most locations, yet fissile in some locations.
Hydrogeology of the study area
Groundwater movement and storage within the study area is primarily influenced by thickness, lithology, and structure of rock formation [14]. Shale is an aquiclude and does not permit reasonable passage of water, especially when fresh and unweathered. But when fractured in most case, it serves as water bearing formation. As water bearing formation within the study area exists in fractured shale and limestone [15]. The major sources of water are stream, hand-dug well, manual borehole and motorized borehole.
Materials and Methods
The resistance of the earth was measured using Abem Terrameter SAS 1000 using Schlumberger electrode configuration, Twenty three (23) sounding were completed within the study area using the Schlumberger configuration with electrode spacing (AB) ranging from 2 to 200 m and the potential electrode spacing (MN) ranged from 0.5 m to 10 m. Global Positioning System (GPS) for taking accurate coordinate of the VES point and elevations, metal electrodes, measuring tape, labelled tag (used in locating station position), hammer (used in driving the electrodes into the ground). The Schlumberger array was adopted. The electrode spread of AB/2 was varied from 1 to a maximum of 100 m. The electrical resistances obtained were multiplied by the corresponding geometric factor (k) for each electrode separation to obtain the apparent resistivity. Qualitative interpretation of the smoothened curves was performed using master curves and standard charts [16] after which they were subjected to computer modeling using the IX1D software. The software makes provision for sounding data to be entered as apparent resistivities versus half current electrode spacing (AB/2) for Schlumberger array. The input parameters, depths and resistivities used for the starting model in the inversion process were estimated from the manually interpreted field curves. This software automatically interprets the Schlumberger sounding curves. The plotted curves reveal the number of layers, thickness, depth and the average resistivity for each layer at different VES points automatically.
Iso-resistivity measurement across the study area
Iso-resistivity maps show possible variations in resistivity for current electrode separation of AB/2 at 9 to 150 m respectively as shown in Figure 3a, Figure 3b, Figure 3c, Figure 3d, Figure 3e and Figure 3f. These were obtained by taking the resistivity values of various stations at a particular depth of AB/2 (m). Figure 3a, Figure 3b, Figure 3c, Figure 3d, Figure 3e and Figure 3f was used to produce maps of each depth AB at 9, 25, 50, 75, 100 and 150 m respectively.
Well data acquisition
A total of 3 wells and two productive and one abortive boreholes (BH1, BH2 and BH3) were visited where well information were taken (Figure 4a and Figure 4b).
1. The total longitudinal unit conductance (S) is calculated by using the formula.
For ‘n' layers, the total longitudinal conductance is
This parameter is used to quantitatively assess the properties of a thin conducting layer. Studies have shown that hydraulic conductance has an inverse relationship with electrical resistivity values, thus high groundwater potential aquifers are usually characterized by high conductance values [17]. TR of a geoelectric layer is defined as the product of h and its corresponding ρ [18,19].
The total transverse unit resistance (T) of a VES can be observed by using the equation.
The total transverse unit resistance is
The average longitudinal resistivity for a given VES curve is given by using the equation.
The longitudinal resistivity is
The average transverse resistivity for a given VES curve is given by using the equation.
The transverse resistivity is
The coefficient of anisotropy (λ) of a formation could be observed by using the formation.
The coefficient of anisotropy is
The parameters T and S (defined as transverse resistance and longitudinal conductance respectively) play an important role in the interpretation of sounding data. These are called the Dar-zarrouk parameters as shown in Eqn 1 to 5.
Results and Discussion
Secondary geo-electrical parameters
The true resistivity obtained as a result of interpretation may also subject to variations, since different lithological layers possess same resistivity and they will act as single geo-electric layer [17]. The secondary geo-electrical parameters are calculated to provide the results more realistic and are described as Dar-Zarrouk parameters [20]. The parameters of the area generated by this study are summarized in Table 1. Resistivity and thickness was used to map out the nature of materials that overlain the mapped aquifer, the longitudinal unit conductance (S), the transverse unit resistance (T) and the coefficient of anisotropy (λ) were used to determine its capacity to prevent infiltration of unwanted fluids into the aquifer. Olorunfemi, et al. [21] further stated that earth materials act as a natural filter to percolating fluids; therefore its ability to retard and filter percolating ground surface polluting fluids is a measure of its protective capacity. In other words, geologic materials overlying an aquifer could act as seal in preventing the fluid from percolating into it. The longitudinal conductance values are normally utilized in evaluating aquifer protective capacity. The aquifer protective capacity essentially assesses the natural ability of overburden units to filter or retard percolating fluid pollutants [21]. The significance of this aquifer parameter is that low S value shows poor aquifer protection zones, while high S value shows vice versa. The estimation shows that the total longitudinal conductance varies from 0.03 to 13.81 Ω-1 in the area (Figure 5a and Table 2). A comparison of the S results with the protective capacity rating model of Oladapo and Akintorinwa [22] indicates that the aquifer protective capacity in the study area is poor to excellent (Table 3).
Based on these estimates it was found that the coefficient of anisotropy λ ranges from 0.06 to 5.62 which depicts the true variation of the anisotropic character of rock formations. The area with high values of λ suggests that the fracture system must have extended in all the directions with different degrees of fracturing, which had greater water-holding capacity from different directions of the fracture(s) within the rock resulting in higher porosity, this is in line with [17]. At the same time, unidirectional fracture may not produce good yield of water and such areas show low values of λ. Consequently, it indicates the presence of macro-anisotropy in the present geoelectric strata in the area, which is clear to distinguish the individual layers for a given VES earth model [23] (Figure 5b and Table 2). Longitudinal resistivity (LR) calculated from VES ranges from 390.9 to 3929.04 Ωm, The longitudinal conductance is inversely proportional to average longitudinal resistivity. The higher average longitudinal resistivity value aquifers will be of freshwater zone where as lower average longitudinal resistivity value aquifers are identified with fractured shale which is of groundwater is moderate in these zones (Figure 5c and Table 2). Transverse resistivity (TR) varies from 268.64 to 3758.98 Ω.m2. Henriet [24], stated that on a pure empirical basics, it can be admitted that TR is directly proportional to transmissivity. Braga, et al. [25] and Toto, et al. [26] further pointed out that TR is used to determine zone of high groundwater potentials and areas suitable for drilling (Figure 5d and Table 2).
Vertical electrical sounding (VES) curves analysis
Four curve types exist in the study area, namely: HK, Q, HKA, Q, H and QH. The HK and Q VES curves are the predominant curve (Figure 6). The high degree of variation in curve types confirms the heterogeneity of the geology of the study area.
Geoelectric survey
For better understanding of the subsurface geology of the study area, modeling of VES curves were carried out. Four VES profile was carefully selected that cut across the study area ranging from profiles A-A̕, B-B̕, C-C̕ and D-D̕. Profile A-A̕ cut across VES 1, 2, 3, 4, 5 and 6, profile B-B̕ cut across VES 20, 21, 22 and 23, profile C-C̕ cut across VES 7, 8, 9, 10, 11, 12 and 13 and lastly profile D-D̕ cut across VES 14, 15, 16, 17, 18 and 19 see Figure 3a, Figure 3b, Figure 3c and Figure 3d. Has HKH curve, with first layer having resistivity value of 140.87 Ωm with thickness and depth of 1.73 m respectively and its interpreted as topsoil, the second layer has resistivity value of 28.54 Ωm with thickness of 4.27 m at depth of 6.00 m its interpreted as shale/clay, while the third layer has resistivity value of 3596.9 Ωm, with thickness of 0.71 m at depth of 6.72 m and its interpreted as siltstone, the fourth layer has resistivity value of 21. 09 Ωm, with thickness of 62.22 m at depth of 68.95 m, it's interpreted as shale/clay, lastly we have the fifth layer with resistivity value of 90.77 Ωm and its interpreted as shale/clay as shown Figure 2a and Table 4a. Has HK curve, with first layer having resistivity value of 260.23 Ωm, with thickness and depth of 2.54 m respectively and its interpreted as topsoil, the second layer has resistivity value of 46.00 Ωm, with thickness of 6.07 m at depth of 8.62 m and its interpreted as shale/clay, while the third layer has resistivity value of 109.21 Ωm with thickness of 4.91 m at depth of 1.53 m and it is interpreted as shale, the fourth layer have resistivity value of 268.65 Ωm with thickness of 50.09 m at depth of 63.63 m and its interpreted as fractured shale, lastly we have the fifth layer with resistivity value of 61.75 Ωm its interpreted a shale/clay as shown Figure 2b and Table 4b. The first layer resistivity value of 326.15 Ωm, with thickness and depth of 3.22 m respectively, its interpreted as top soil, layer two has depth of 11.84 m and thickness of 8.16 m with resistivity value of 285.88 Ωm, was interpreted as fractured shale and lastly, the fourth layer has resistivity value of 17.70 Ωm and was interpreted as shale/clay, it was observed that its VES 28 has HK curve as shown Figure 2c and Table 4c. First layer has resistivity value of 352.66 Ωm with thickness and depth of 2.54 m respectively and was thickness and depth of 2.54 m respectively and was interpreted as topsoil. Layer two has resistivity value of 72.078 Ωm with thickness and depth of 7.15 m and 9.70 m respectively and was interpreted as shale/clay, while the third layer has depth value of 25.12 m and thickness of 15.42 m with resistivity value of 299.16 Ωm, was interpreted as fractured shale, the fourth layer has resistivity value of 29.012 Ωm with thickness value of 60.28 m and depth of 85.40 m was interpreted as shale/clay, lastly, layer fire has resistivity value of 5872.8 Ωm, was interpreted as siltstone, it was observed that VES 37 has HKH curve as shown Figure 2d and Table 4d.
Geo-electric and lithologic logs correlation
A correlation of the geo-electric data of the layers and lithologic (borehole) logs is presented in Figure 4a and Figure 4b. Correlation analysis suggests that the first geo-electric layer corresponds to the top lateritic soil, the second correspond to clay/shale, third and fifth corresponds to fractured shale, fourth corresponds to clay/shale layer. This third most probably marks the upper level of the aquifer, while the fifth layer is considered to be the aquiferous unit (Figure 4a). This information shows good agreement with earlier data within the Asu River Group aquifer given by Ebong, et al. [2] although there tend to slightly change in resistivity value (Figure 4b). Showed failed borehole log correlation analysis suggests that the first geo-electric layer corresponds to the top lateritic soil, the second correspond to clay/shale, third corresponds to clay/shale, fourth and fifth layer corresponds to clay/shale layer Table 5.
Description of geo-correlation
The profile line that cuts across the study area are; profiles A-A/ B-B/, C-C/ and D-D/. Profile A-A̕ runs NW to NE direction, hence it can be called NW-SE direction. This profile line cut across the following VES points namely: VES 4, 13, 12, 1 and 2. It's depth of top soil ranges from 0.00 to 6.28 m the top soil formation is characteristics of laterite, with layers ranging from three to six and resistivity values ranges from 1.57 to 3596.9 Ωm. The inferred lithology of this profile are mainly top soil, clay, clay/shale, fractured shale siltstone and shale (Figure 7a and Table 2). Profile B-B̕ cut across VES 17, 22 and 14. It's depth of top soil ranges from 0.95 to 3.43 m represents the top soil formation is characteristics of laterite, with layers ranging from four to five and resistivity values ranges from 7.43 to 721.81 Ωm. The inferred lithology of this profile are mainly; top soil, clay, clay/shale, fractured shale siltstone and shale (Figure 7b and Table 2). Profile C-C' cut across VES 11, 2, 18, 10, 9 and 12. It's depth of top soil ranges from 0.93 to 3.22 m represents the top soil formation is characteristics of laterite, with layers ranging from three to five and resistivity values ranges from 1.57 to 1016.7 Ωm. The inferred lithology of this profile consists of top soil, clay, clay/shale, fractured shale siltstone and shale (Figure 7c and Table 2).
Note: Resistivity value of rock unit was tied to borehole data and Telford, et al. [27].
Summary and Conclusion
The combination of VES surveys and borehole data in the study area has contributed to a better understanding of the groundwater prospect and aquifer protective capacity in this part of sedimentary terrain of Southeastern Nigeria. The study area is underlain by three (3) to six (6) lithology these include the top soil (mostly laterite), clay/shale, siltstone, shale, consolidated shale and fractured shale. The resistivity, thickness of subsurface formations, longitudinal conductance (S), transverse resistance (R) and anisotropy (λ) were used to characterize the lithological formations and also groundwater potential and recharge zones were delineated. The study also revealed that most parts of the area are underlain by materials of poor to excellent protective capacity. From study it was observed that the middle part of the study area has high aquifer protective capacity compared to other part of the study area this could be attributed to the fact the area is underlain by shale and clay which are aquiclude and are known to have negligible permeability, hence it would difficult for contaminant to flow through such rock unit. The major curve type that cut across the study area is curve HK.