
International Journal of Earth Science and Geophysics
(ISSN: 2631-5033)
Volume 6, Issue 1
Research Article
DOI: 10.35840/2631-5033/1835

Article Formats
Integrated Interpretation of Multi-Geophysical Inversion Results using Guided Fuzzy C-Means Clustering
Table of Content
Figures
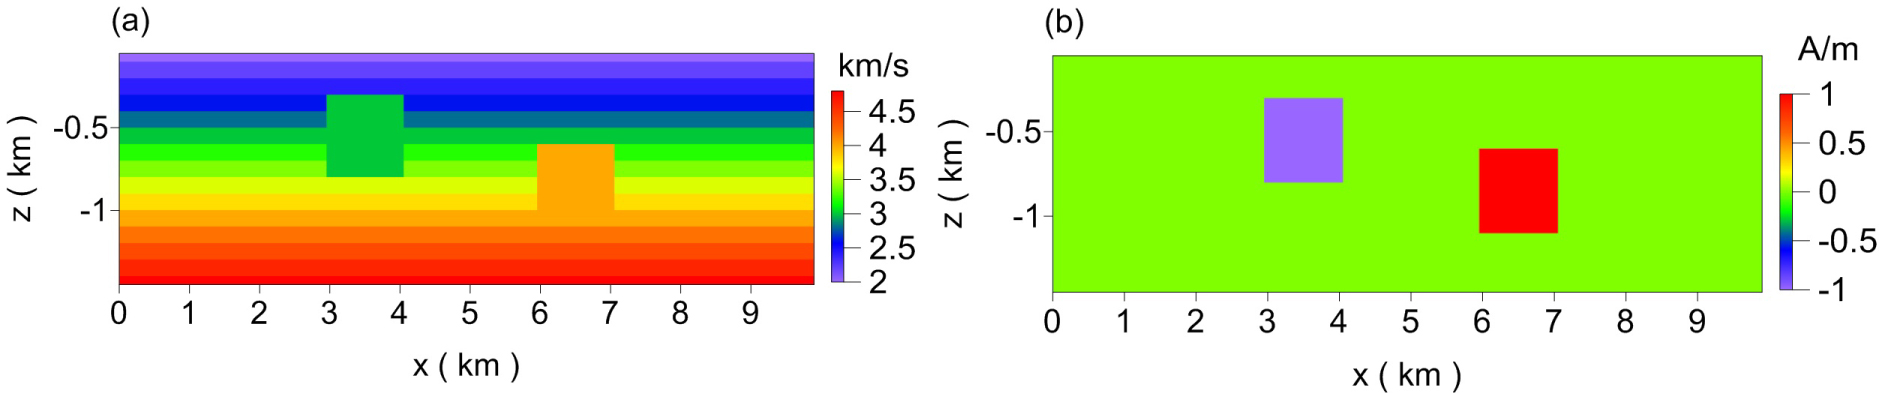

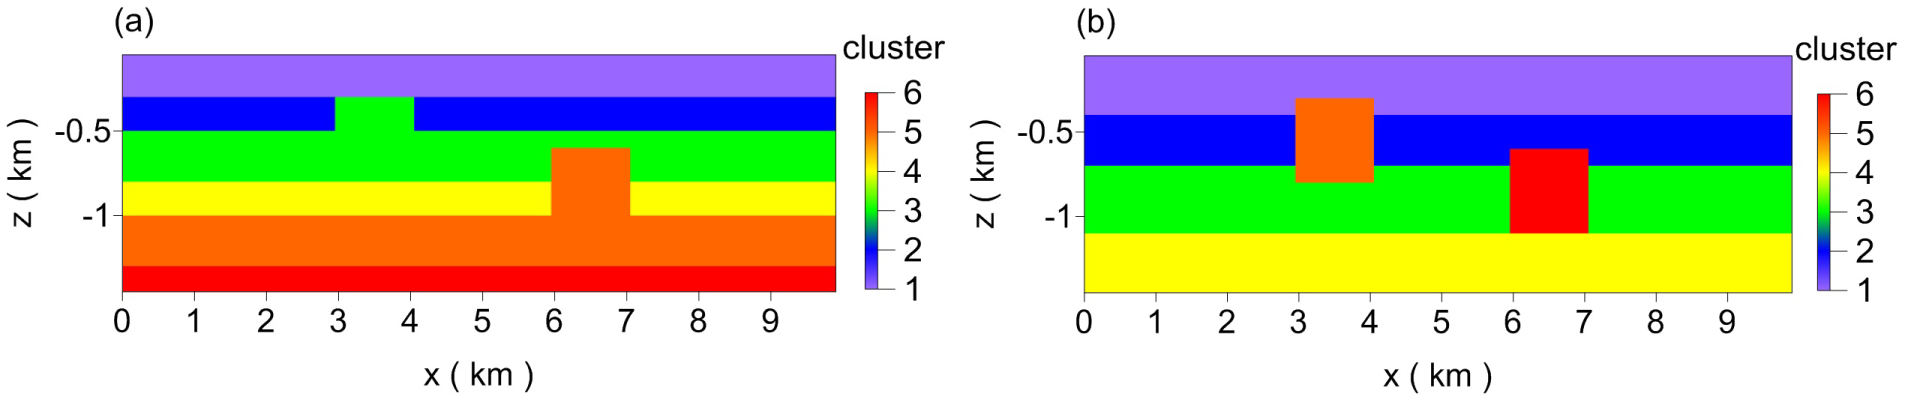
Figure 3: Results for different clustering methods....
Results for different clustering methods with velocity and magnetization. a) FCM; b) Guided FCM.
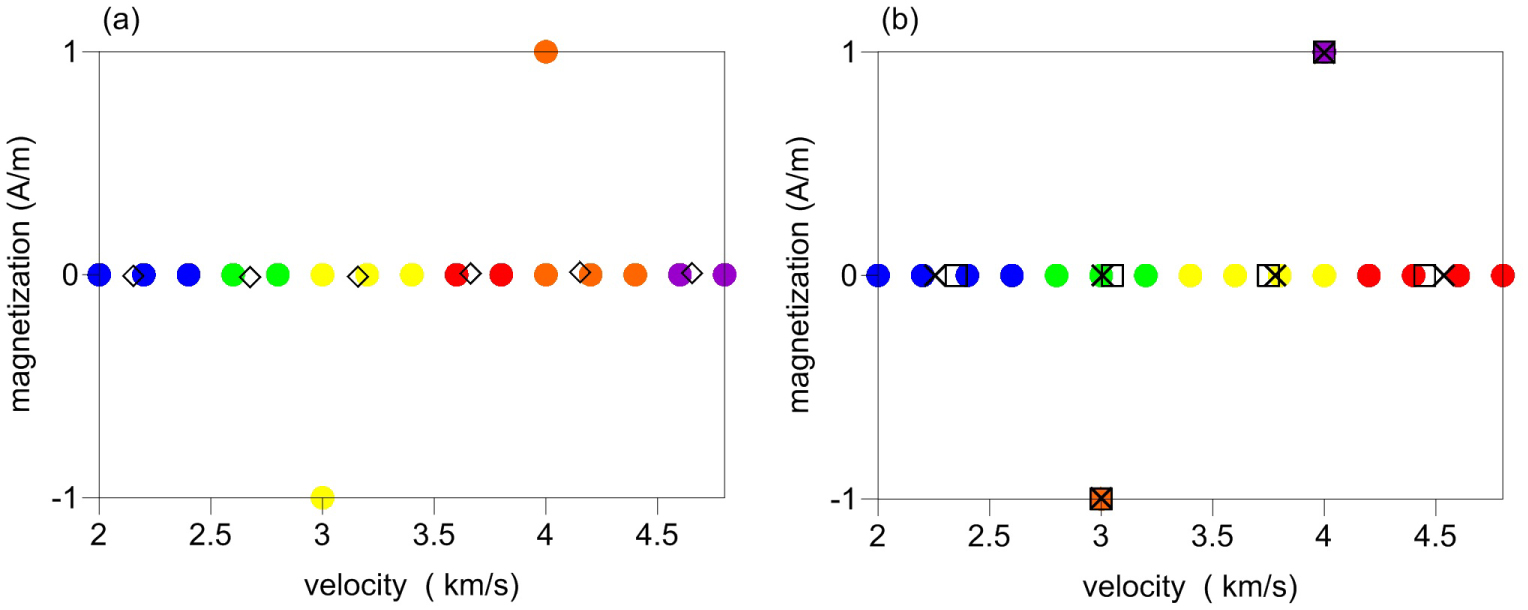
Figure 4: Cross-plot of values for two different physical....
Cross-plot of values for two different physical properties (the following symbols are used to express the following features: cross, center of the guided FCM clustering; diamond, center of the FCM clustering; square, constraint center; blue point, class 1; green point, class 2; yellow point, class 3; red point, class 4; orange point, class 5; violet point, class 6. a) FCM clustering with velocity and magnetization; b) Guided clustering with velocity and magnetization.

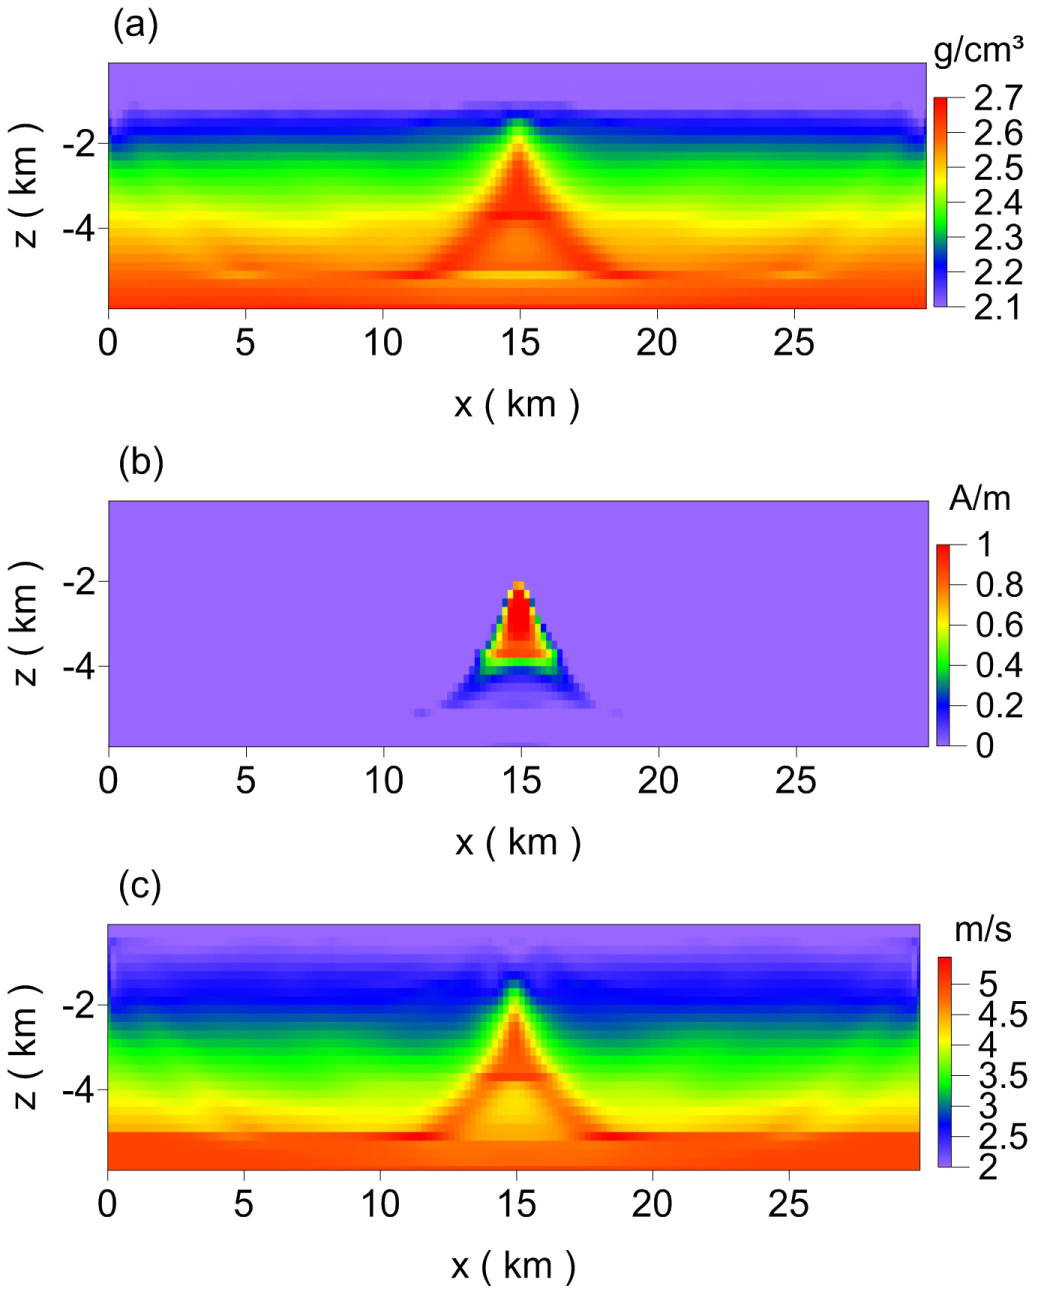
Figure 6: The joint inversion results. a) Joint....
The joint inversion results. a) Joint inversion results for density; b) Joint inversion results for magnetization; c) Joint inversion results for velocity.
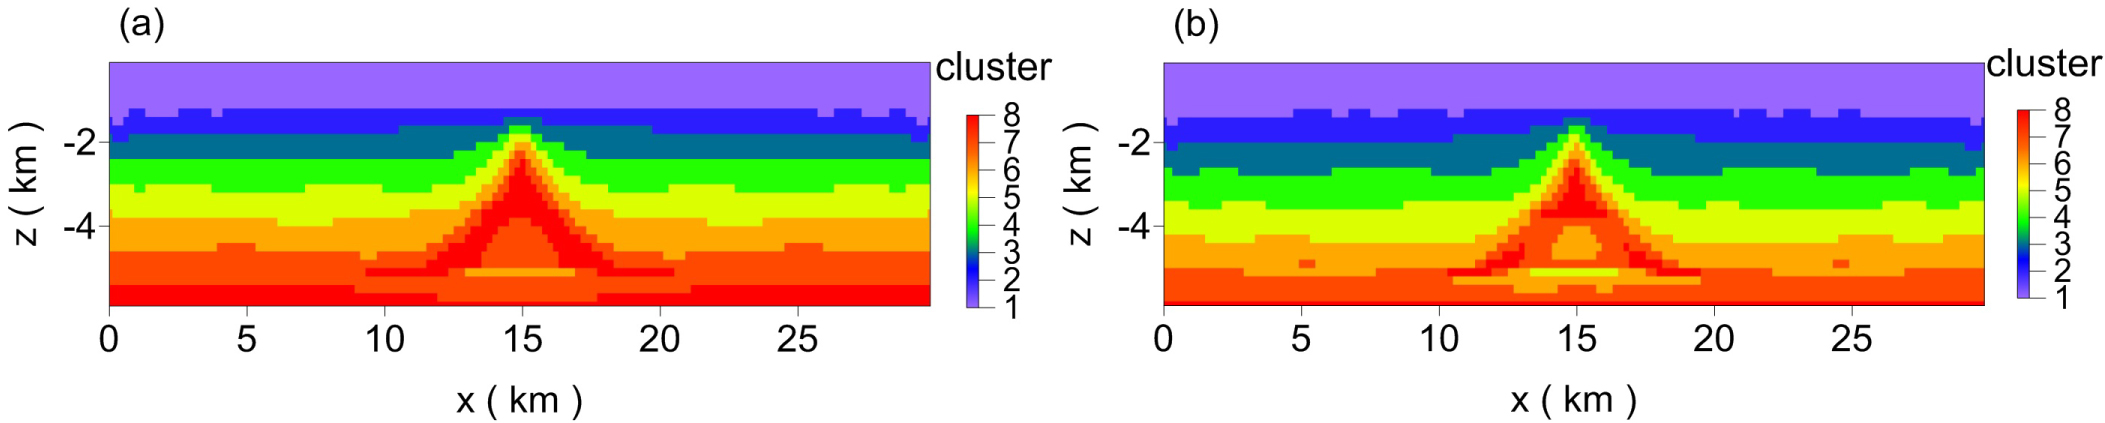
Figure 7: Results for different clustering methods with...
Results for different clustering methods with density. a) FCM; b) Guided FCM.
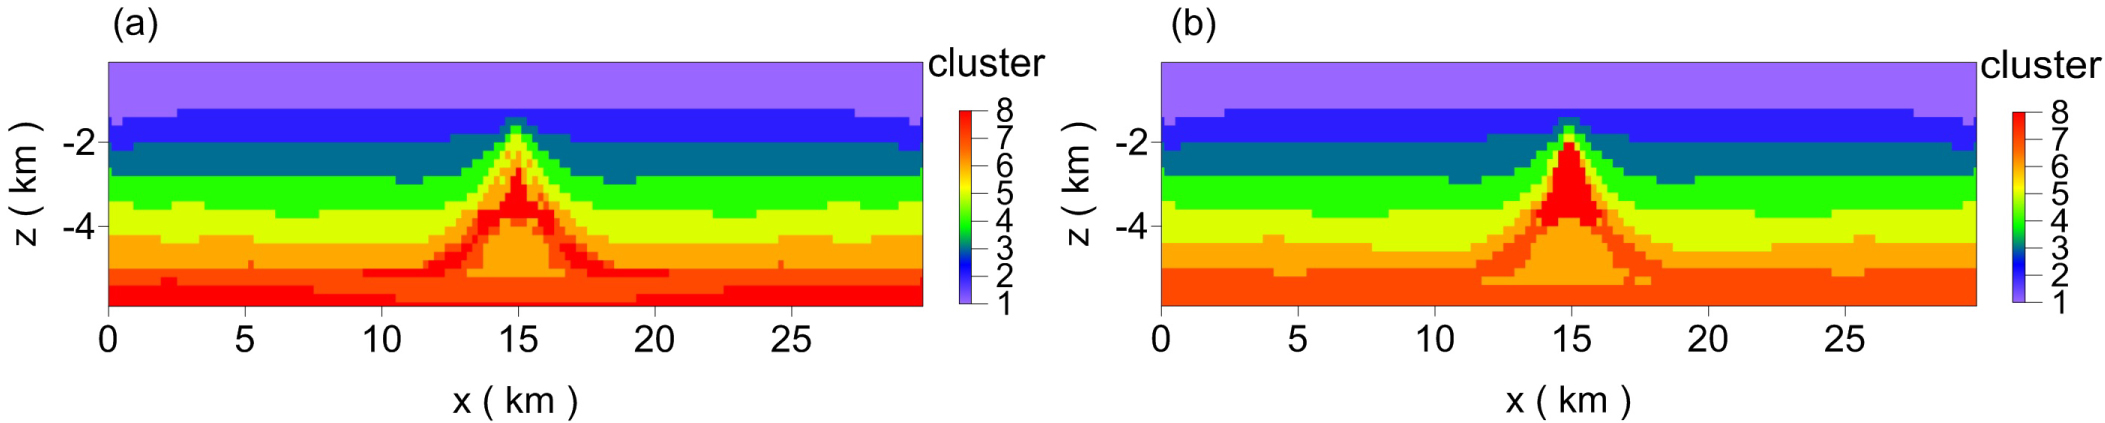
Figure 8: Results for different clustering methods with...
Results for different clustering methods with three physical properties. a) FCM; b) Guided FCM.

Figure 9: Cross-plot of values for two different physical...
Cross-plot of values for two different physical properties of three properties (the following symbols are used to express the following features: fork, center of FCM; diamond, center of the guided FCM; violet point, class 1; blue point, class 2; ocean-green point, class 3; green point, class 4; yellow point, class 5; orange point, class 6; brown point, class 7; red point, class 8). Here, (a) and (d) are the density and magnetization; (b) and (e) are the density and velocity; and (c) and (f) are the velocity and magnetization. a-c) Results for the FCM; d-f) Results for the guided FCM.
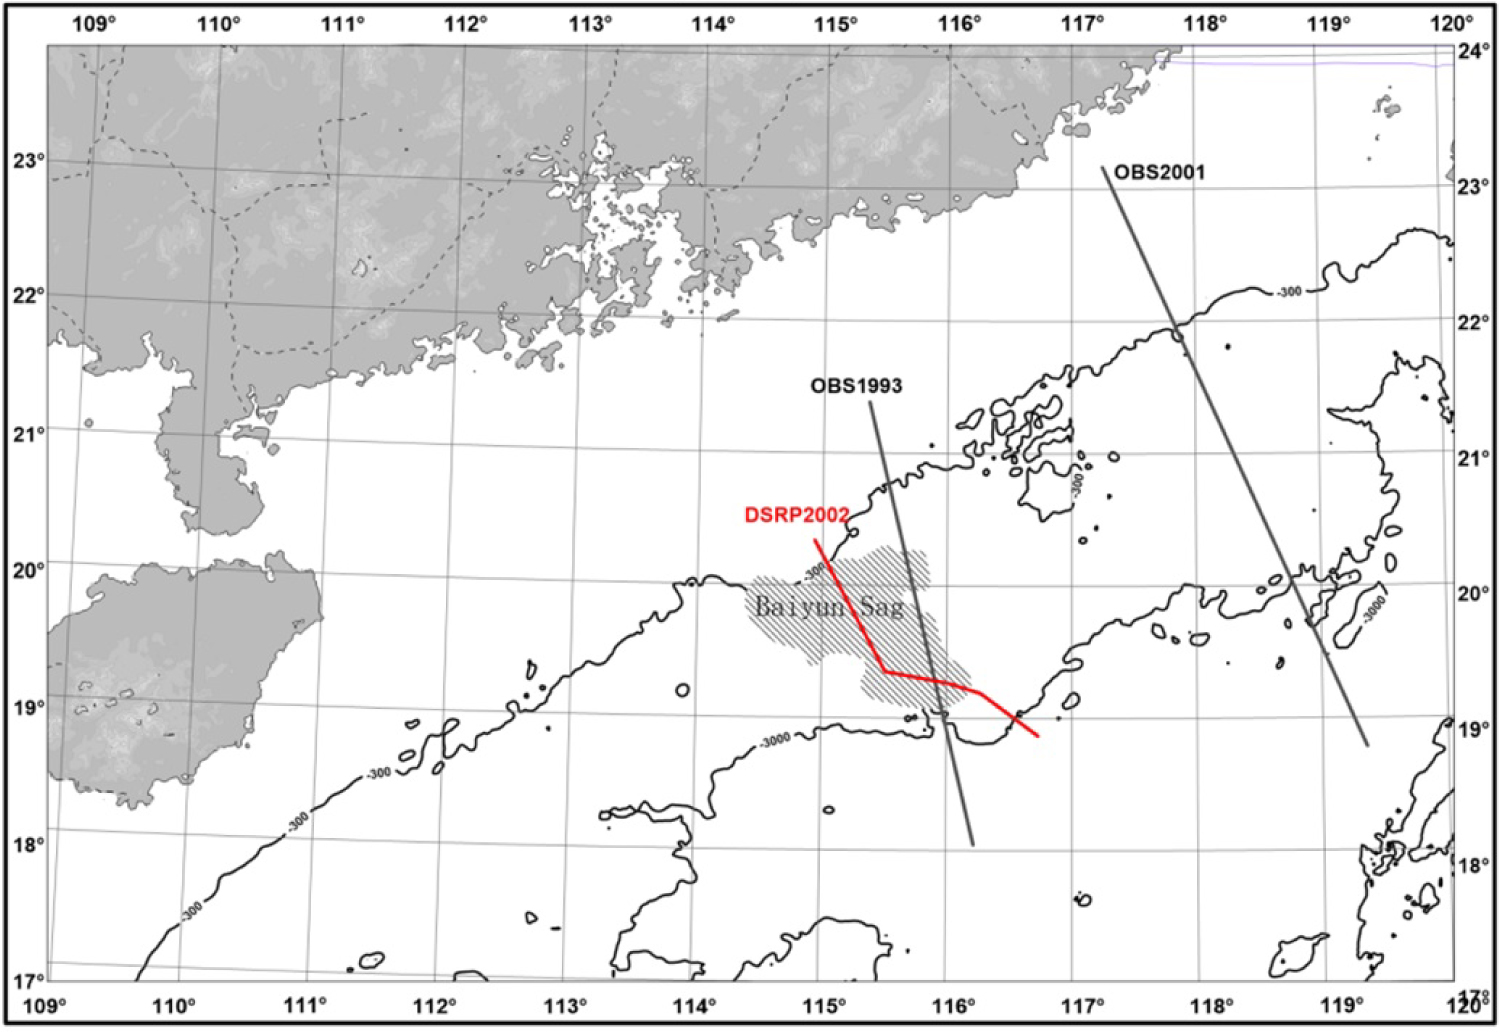
Figure 10: Location of the regional structure and deep...
Location of the regional structure and deep reflection seismic profile (DSRP2002) in the Baiyun Sag of the Pearl River Mouth Basin (modify from Huang, 2005 [45]).
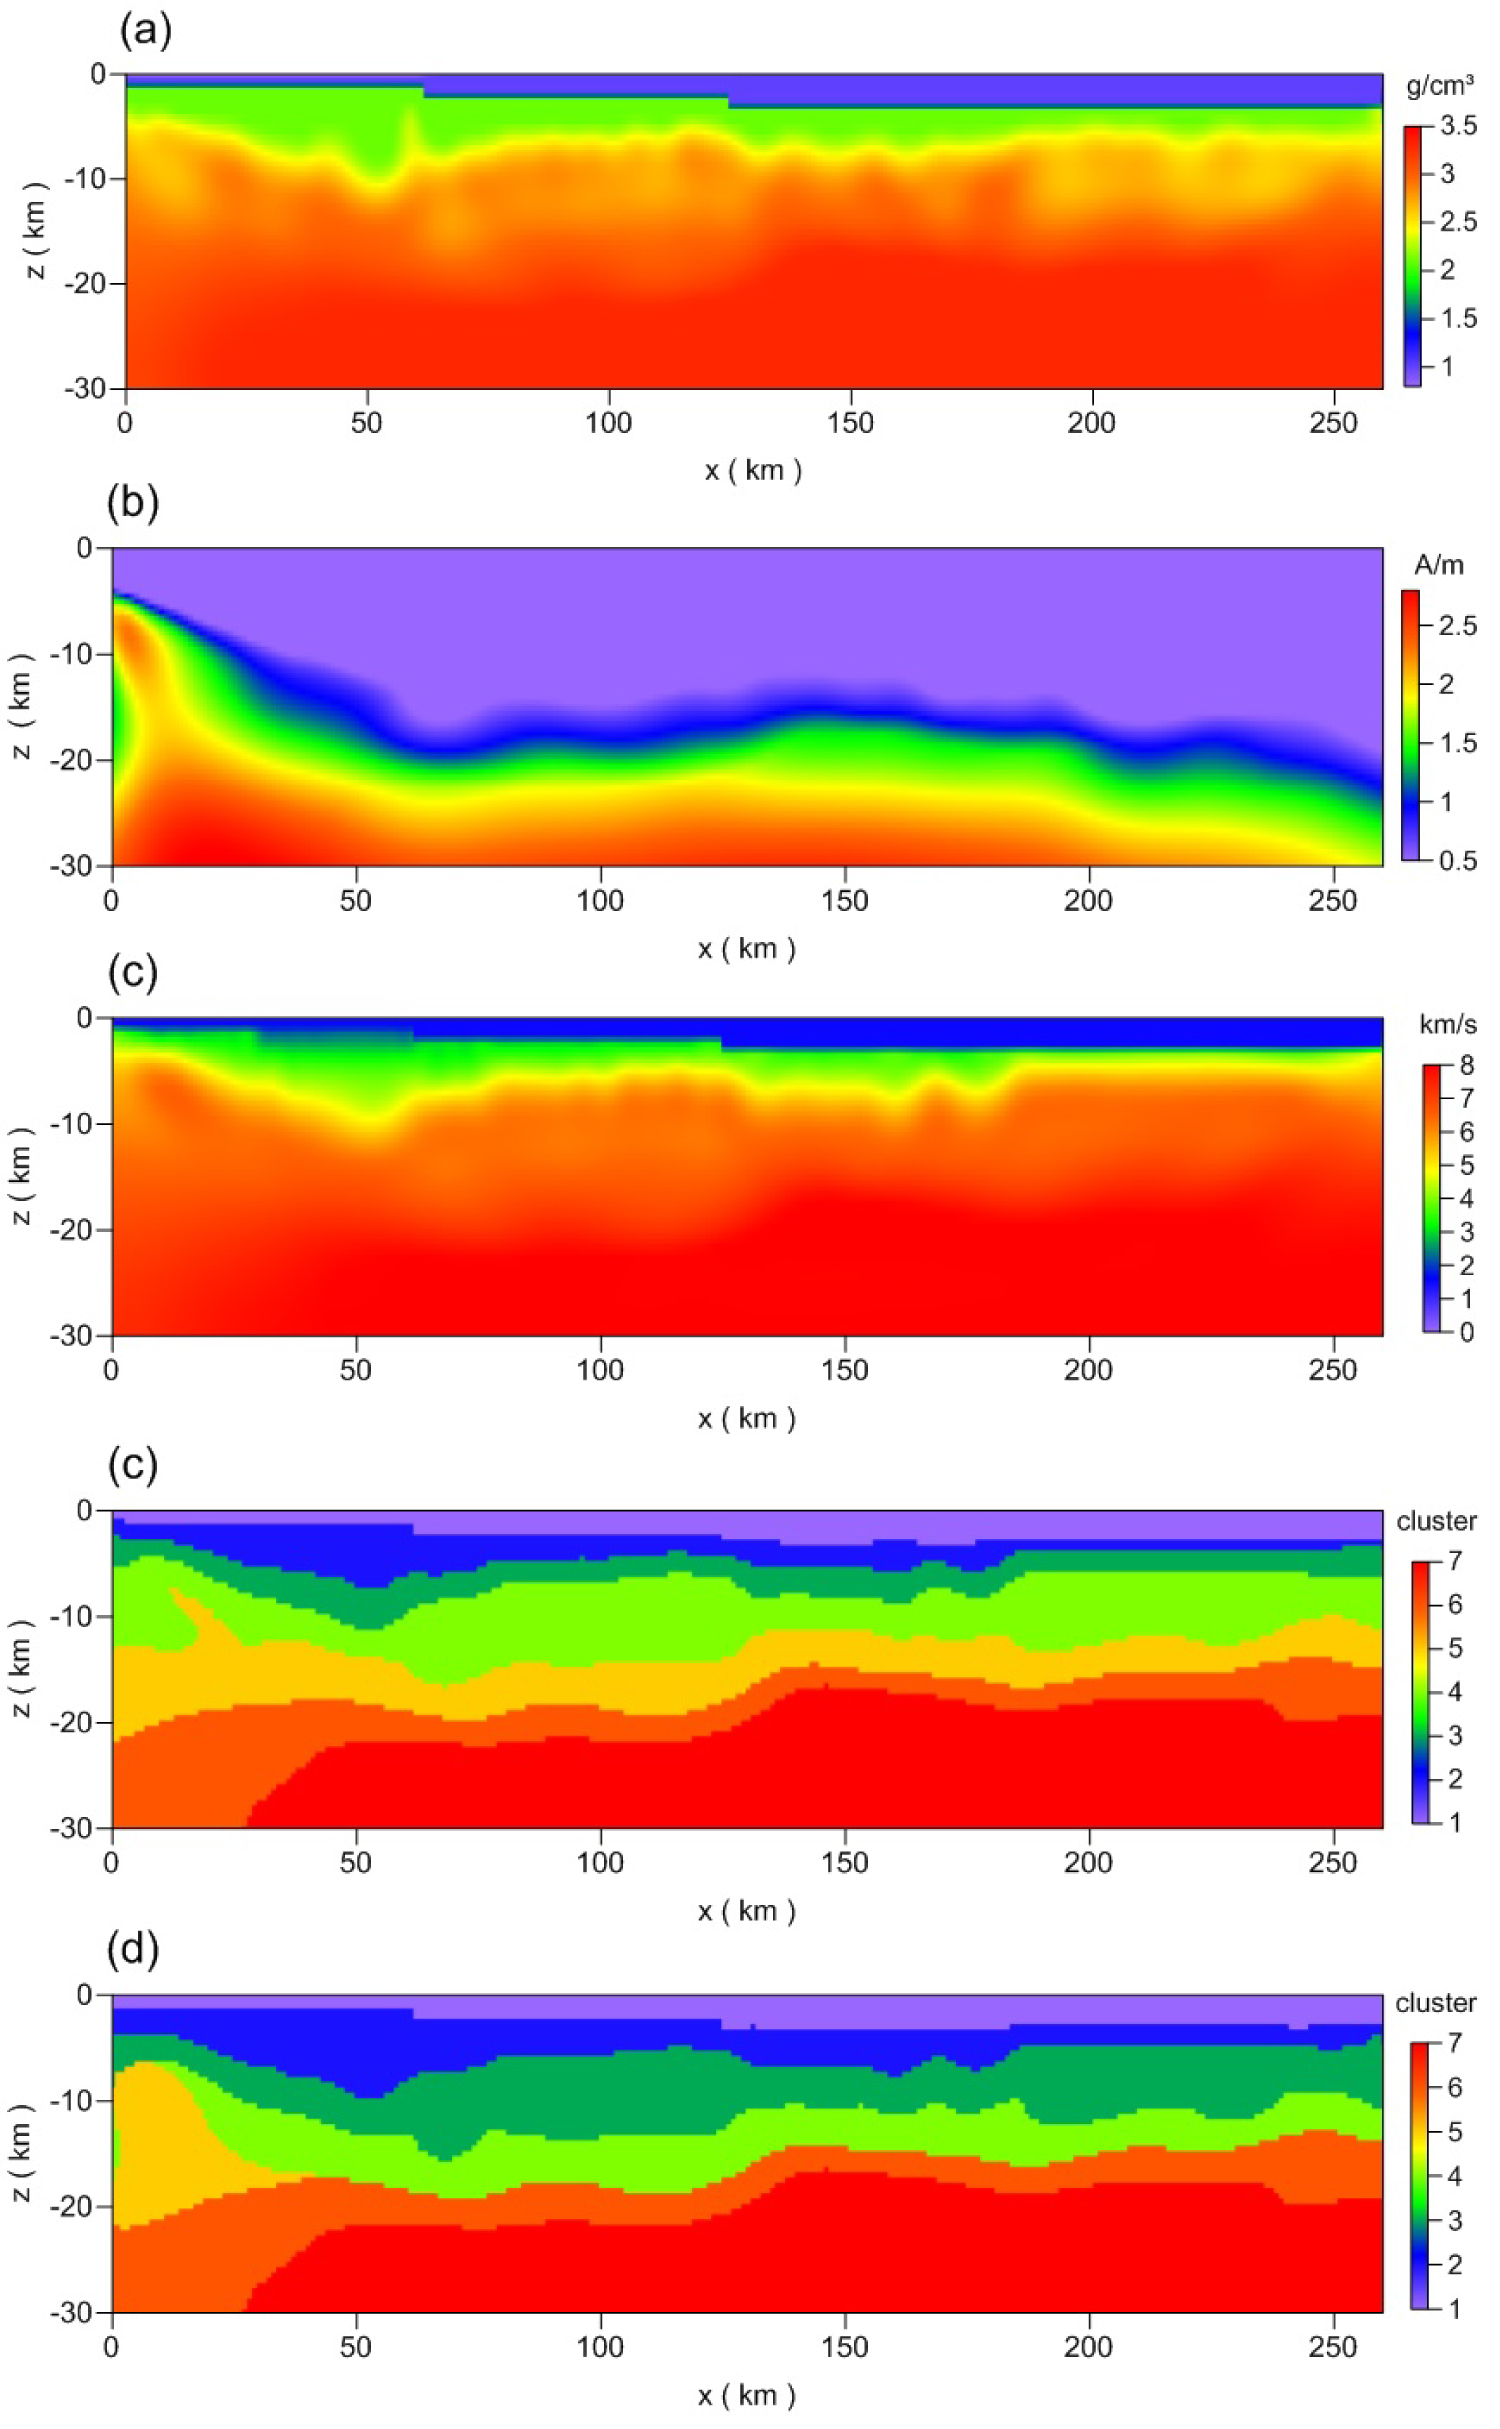
Figure 11: Joint inversion of the DSRP2002 section...
Joint inversion of the DSRP2002 section of the South China Sea and clustering results for the a) Density; b) Magnetic susceptibility; c) Velocity; d) FCM; and e) Guided FCM.
Tables
Table 1: The different constraint cluster centers of the simple model test.
Table 2: The physical property values of the complicated model.
Table 3: a priori constraint cluster centers of the model and cluster centers for two algorithms.
Table 4: Model RMS errors of the clustering model.
Table 5: Statistics for the density and magnetization in the South China Sea (School of Ocean and Geosciences, Tongji University, 2011-2015).
Table 6: a priori constraint cluster centers of the DSRP 2002 section of the South China Sea and cluster centers of the two algorithms.
References
- Oldenburg DW, Li Y (2005) Inversion for applied geophysics: A tutorial. Investigations in Geophysics 89-150.
- Paasche H, Tronicke J (2007) Cooperative inversion of 2D geophysical data sets: A zonal approach based on fuzzy c-means cluster analysis. Geophysics 72: A35-A39.
- Paasche H, Tronicke J, Dietrich P (2010) Automated integration of partially collocated models: Subsurface zonation using a modified fuzzy -means cluster analysis algorithm. Geophysics 75: P11-P22.
- Lelièvre PG, Farquharson CG, Hurich CA (2012) Joint inversion of seismic traveltimes and gravity data onunstructured grids withapplication to mineral exploration. Geophysics 77: K1-K15.
- Paasche H, Tronicke J (2014) Nonlinear joint inversion of tomographic data using swarm intelligence. Geophysics 79: R133-R149.
- McAuslan AC, Lelièvre PG, Farquharson CG (2015) A study of fuzzy c-means coupling for joint inversion, using seismic tomography and gravity data test scenarios. Geophysics Journal of the Society of Exploration Geophysicists.
- Hammer B, VillmannT (2002) Generalized relevance learning vector quantization. Neural Networks 15: 1059-1068.
- Shi G, Zhou X, Zhang G, Shi X (2004) The use of artificial neural network analysis and multiple regression for trap quality evaluation: A case study of the Northern Kuqa Depression of Tarim Basin in western China. Marine & Petroleum Geology 21: 411-420.
- Zhou H, Ning, Yang F, Xu Z (2007) Application of support vector machine to forecasting and calculating reservoir thickness. Progress in Geophysics 5: 1597-1601.
- Shi G (2008) Application of support vector machine to multi-geological-factor analysis. Acta Petrolei Sinica 29: 195-198.
- Zheng Y, Li G (2009) Application of support vector machine to stratum recognition. Journal of Henan Normal University 2: 37-39.
- Ruspini EH (1969) Pattern recognition with fuzzy objective function algorithms. Information and control 15: 22-32.
- Dunn JC (1973) A fuzzy relative of the isodata process and its use in detecting compact well-separated clusters. Journal of Cybernetics 3: 32-57.
- Bezdek JC (1981) Pattern recognition with fuzzy objective function algorithms. Plenum Press, New York and London.
- Bezdek JC, Hathaway RJ, Sabin MJ, Tucker WT (1987) Convergence theory for fuzzy c-means: Counter examples and repairs. IEEE Transactions on Systems Man & Cybernetics 17: 873-877.
- Cannon RL, Dave JV, Bezdek JC, Trivedi MM (1986) Segmentation of a thematic mapper image using the fuzzy c-means clustering algorithm. IEEE Transactions on Geoscience and Remote Sensing GE 24: 400-408.
- Trivedi MM, Bezdek JC (1986) Low-level segmentation of aerial images with fuzzy clustering. IEEE Transactions on Systems, Man and Cybernetics 16: 589-598.
- Noordam JC (2000) Geometrically guided fuzzy C-means clustering for multivariate image segmentation. Pattern Recognition 1: 462-465.
- De Bruin S, Stein A (1998) Soil-landscape modelling using fuzzy c-means clustering of attribute data derived from a digital elevation model (DEM): Geoderma 83: 17-33.
- Bragato G (2004) Fuzzy continuous classification and spatial interpolation in conventional soil survey for soil mapping of the lower Piave plain. Geoderma 118: 1-16.
- Güler C, Thyne GD (2004) Delineation of hydrochemical facies distribution in a regional groundwater system by means of fuzzy c-means clustering. Water Resources Research 40.
- Paasche H, Tronicke J, Holliger K, Green AG, Maurer H (2006) Integration of diverse physical-property models: Subsurface zonation and petrophysical parameter estimation based on fuzzy c-means cluster analyses. Geophysics 71: H33-H44.
- Orfanos C, Apostolopoulos G (2013) Multiparameter analysis of geophysical methods for target detection: The unified geophysical model approach. Geophysics 78: 1-13.
- Ward WOC, Wilkinson PB, Chambers JE (2014) Distribution-based fuzzy clustering of electrical resistivity tomography images for interface detection. Geophysical Journal International 197: 310-321.
- Pezdrcy P (1985) Algorithms of fuzzy clustering with partial supervision. Pattern Recognition Letters 3: 13-20.
- Bensaid AM, Hall LO, Bezdek JC, Clarke LP (1996) Partially supervised clustering for image segmentation. Pattern Recognition 29: 859-871.
- Noordam JC (2002) Multivariate image segmentation based on geometrically guided fuzzy C-means clustering. Journal of Chemometrics 16: 1-11.
- Sun J, Li Y (2015) Multidomain petrophysically constrained inversion and geology differentiation using guided fuzzy c-means clustering. Geophysics 80: 1-18.
- Sun J, Li Y (2016) Joint inversion of multiple geophysical data using guided fuzzy c-means clustering. Geophysics.
- Portniaguine O, Zhdanov MS (1999) Focusing geophysical inversion images. Geophysics 64: 874-887.
- Zhdanov MS (2002) Geophysical inverse theory and regularization problems. Elsevier Science.
- Gallardo LA, Meju MA (2003) Characterization of heterogeneous near-surface materials by joint 2D inversion of dc resistivity and seismic data. Geophys Res Lett 30: 1658.
- Gallardo LA (2004) Joint two-dimensional inversion of geo-electromagnetic and seismic refraction data with cross-gradients constraint. PhD dissertation, Lancaster University.
- Heincke B, Jegen M, Hobbs R (2006) Joint inversion of MT, gravity and seismic data applied to sub-basalt imaging. In Proceedings of the 76th Annual International Meeting, SEG, Expanded Abstracts, 784-789.
- Carcione JM, UrsinB (2007) Cross-property relations between electrical conductivity and the seismic velocity of rocks. Geophysics 72: E193-E204.
- Gallardo LA, Meju MA (2007) Joint two-dimensional cross-gradient imaging of magnetotelluric and seismic travel-time data for structural and lithological classification. Geophysical Journal International 169: 1261-1272.
- Gallardo LA, Meju MA (2011) Structure-coupled multi-physics imaging in geophysical sciences. Rev Geophys 49.
- Zhdanov MS, Gribenko A, Wilson G (2012) Generalized joint inversion of multimodal geophysical data using Gramian constraints. Geophys Res Lett 39: L09301.
- Molodtsov DM, Kashtan BM, Roslov YV (2011) Joint inversion of seismic and magnetotelluric data with structural constraint based on dotproduct of image gradients. In Proceedings of the 81st Annual International Meeting, SEG, Expanded Abstracts, 740-744.
- Molodtsov DM, Troyan VN, Roslov YV, Zerilli A (2013) Joint inversion of seismic travel times and magnetotelluric data with a directed structural constraint. Geophys Prospect 61: 1218-1228.
- Bo S, Yu P, Zhao CJ, et al. (2018) Linear correlation constrained joint inversion using squared cosine similarity of regional residual model vectors. Geophysical Journal International 215: 1291-1307.
- Bezdek JC, Ehrlich R, Full W (1984) FCM: The fuzzy c-means clustering algorithm. Computer & Geosciences 10: 191-203.
- Hansen PC, O'Leary DP (1993) The use of the L-curve in the regularization of discrete ill-posed problems. SIAM Journal on Scientific Computing 14: 1487-1503.
- Vogel CR (1996) Non-convergence of the L-curve regularization parameter selection method. Inverse problems 12: 535.
- Huang C, Zhou D, Sun Z, Hao H (2005) Deep crustal structure of Baiyun Sag, northern South China Sea as interpreted from deep seismic reflection profile. Chinese Science Bulletin 50: 1131-1138.
- Pang X, Ren JY, Zheng JY (2018) Petroleum geology controlled by extensive detachment thinning of continental margin crust: A case study of Baiyun sag in the deep-water area of northern South China Sea. Petroleum Exploration & Development 45: 29-42.
Author Details
Zhao Chongjin*, Yu Peng and Guo Jun
State Key Laboratory of Marine Geology, Tongji University, Shanghai, China
Corresponding author
Zhao Chongjin, State Key Laboratory of Marine Geology, Tongji University, Shanghai, China.
Accepted: June 23, 2020 | Published Online: June 25, 2020
Citation: Chongjin Z, Peng Y, Jun G (2020) Integrated Interpretation of Multi-Geophysical Inversion Results using Guided Fuzzy C-Means Clustering. Int J Earth Sci Geophys 6:035
Copyright: © 2020 Chongjin Z, et al. This is an open-access article distributed under the terms of the Creative Commons Attribution License, which permits unrestricted use, distribution, and reproduction in any medium, provided the original author and source are credited.
Abstract
With the development of Geophysics, a variety of geophysical methods are used to study the underground structure, so there are more and more inversion results with different physical properties. How to get the interpretation result from a variety of geophysical inversion results is a problem. The fuzzy C-means clustering (FCM) technique has been used in the geophysical interpretation process. To obtain better interpretations of inversion results, we added the a priori constraint information in the FCM method by using a guided FCM to cluster the multi-geophysical inversed results. Through model tests, it was proven that the guided FCM clustering technique performed better at characterizing the distributions of the layered medium than that without the guided FCM. In terms of field data applications, the guided FCM clustering can present more reasonable results for complex geophysical inversed data, and the findings demonstrate the practicability of using this method for interpretations of multi-property geophysical inversion results.
Keywords
FCM clustering, Interpretation, Guided, Multi-properties
Introduction
With the development of geophysical methods, we can get a lot of different geophysical inversion results. But how to used these inversion results and how to combine these different geophysical inversion results? Interpretations are the ultimate goal of geophysical inversion results, and the traditional method to explain geophysical inversion results is based on the certain experiences of geologists. In recent years, many geophysicists have begun to apply classification algorithms during geophysical data processing and inversion studies [1-6], among which the fuzzy C-means clustering (FCM), Support Vector Machine (SVM), and Neural Network (NN) techniques are widely used. SVM and NN have some precedent in oil and gas reservoir forecasts [7-11], but both of them are supervised learning classification methods that need a sufficient number of samples. Conversely, the FCM clustering algorithm is an unsupervised learning classification method that does not require enormous sample sizes [12-15].
The FCM algorithm has been widely used in the processing and analysis of remote-sensing images and medical images [16-18], and this approach also has been applied to geoscience problems including soil classification [19,20] and the determination of hydrochemical facies distributions in groundwater [21]. In terms of geophysical research, Paasche, et al. [22] used the FCM clustering technique to integrate information from separate inversions of cross-well, geo-radar, and seismic data in their investigation of an alluvial aquifer. Orfanos and Apostolopoulos [23] took a double-block model of the density and resistivity of two-dimensional inversion results as a data set, and then, data were clustered with the FCM algorithm, the fuzzy classification entropy under different cluster numbers was calculated, and the minimum of the classification entropy was verified as the correctness of judging the optimal cluster number in the model. Ward, et al. [24] classified the three-dimensional resistivity inversion results of small-scale ore-bearing areas into clusters by using FCM, and each data object was extracted in correspondence with the maximum value of membership of each category, and by subtracting the maximum value from 1, so the difference could describe the uncertainty of a data object; the region where the difference tends to be 0 indicates that the region belongs to the obvious stratum, and larger differences are indicative of stratigraphic interfaces. This notable research provides a way of thinking about the geologic explanation based on the membership degree. However, there is a large amount of a priori information in actual problems, and to combine the a priori information in actual problems for better clustering results, Pezdrcy [25] proposed a partial supervision fuzzy clustering algorithm. To engage in a deeper consideration of this problem, Bensaid [26] proposed a new semi-supervised fuzzy clustering algorithm. Noordam [27] incorporated a priori geometrical information into FCM clustering from the spatial domain to improve image segmentation. Sun and Li [28,29] referenced the mechanism of model constraint in geophysical inversions and took the model properties for block and background values as the a priori constraint cluster center; then, with this approach, one adds the misfit constraint functional of this center and clustering center to the objective function of FCM clustering, and subsequently, the modified objective function is added to the overall objective function of joint inversion so that the physical property values in the inversion results approach the real physical values of block and background.
There are a few applications of FCM clustering in relation to geophysical and geology integrated interpretations, especially for multi-physical properties. With the development of joint inversion techniques for multiple geophysical data, the uncertainties for the inversed solutions can be reduced, and the data used in the interpretation work area will become increasingly accurate [30-41]. Hence, it is meaningful to study a quantitative interpretation technique based on FCM. In this study, we apply the guided FCM clustering method to the inversion results of different physical properties, which can get an integrated interpretation underground model.
Methodology
FCM clustering is an unsupervised classification technique that can automatically group a set of objects into several subsets. In FCM clustering, the cluster center only depends on the distance relationship between data objects and the number of the initial categories. So, the obtained cluster centers are difficult to match with the true physical properties, but this problem can be solved by adding a priori information into FCM clustering. Sun and Li [28] developed a method that can incorporate statistical petrophysical data into a geophysical inversion and with it, extract the guided FCM clustering objective function from the inversion objective function and apply the guided FCM clustering into the inversed results. The objective function can be written as follows:
Where M is the number of data to be clustered, C is the number of clusters to be discovered, xi is the ith data object, pk is the center of the kth cluster, tk is a given kth constraint center, η is a weighting parameter, γi represents Lagrange parameters [28], μik is a membership value that measures the degree of the ith data object belonging to the kth cluster, and m is known as the fuzzification parameter [42].
The term will always be zero during the minimization process, so drop that term for simplicity and the final objective function becomes
The right term called a "guided" term,
The updated cluster centers pk would be:
From Eq. (4), the center is affected by η and tk. When η→0, the constraint center will not play a role and the algorithm regresses to fuzzy C-means clustering. When η→∞, the a priori constraint cluster center has become the main factor affecting the cluster center value and the cluster number should be known at first. A suitable η allows for the adjustment of the values for the two terms on the right of Eq. (2) to the same order of magnitude. We choose the way of selecting a fixed η is the L-curve method [43,44].
The above formula is for one physical property, if there are more than one physical property, the eq. (2) can be rewritten as followed:
Where xi = (xi1, xi2, xi3...)T, pk = (pk1,pk2,pk3...)T, tk = (tk1,tk2,tk3...)T, xi1 means physical property 1 such as velocity, xi2 means physical propery 2 such as magnetization and so on.
A quantitative description of the clustering accuracy can be provided by the root mean square (RMS) error of the Interpretation result:
Where mireal is the true clustering model, mical is the clustering model by the fuzzy C-means clustering, and Nm is the number of grids.
Model Testing
Simple model
In order to prove the validity of this method, we designed a 2D underground model. The model scale is 10 km × 1.4 km (10 km in the horizontal direction and 1.4 km in the vertical direction) and there are two-block in it. The number of grids is 100 × 14, and the horizontal and vertical grid spacing are both 100 m. The velocity of the left block is 3.0 km/s, the velocity of the right block is 4.0 km/s, and the velocity of the background region increases linearly from the top (2.0 km/s) of the model to the bottom (4.8 km/s) as shown in Figure 1a. The magnetization of the left block is -1.0 A/m, the magnetization of the right block is 1.0 A/m, and the magnetization background is 0.0 A/m as shown in Figure 1b. We hope that we can get an underground interpretation model through the guided fuzzy c-means clustering.
In order to make a comparison, we first conducted a single physical property guided clustering experiment. Taking the velocity model as an example, because of the background velocity of the velocity model is a gradient change, we assume that the background velocity is first divided into four clustering centers, in which the values are 2.3, 3.0, 3.8, 4.5, and the clustering center of the block is 3 and 4. And the guide FCM results of velocity model as show in Figure 2. We can see that the block and the background are obviously fused together. Thus, the advantage of using the single method in guiding clustering was not strong.
Therefore, we considered introducing multi-physical guided clustering. Next, the models for velocity and magnetization were integrated into a data set, which was clustered into six classes by the FCM algorithm (Figure 3a) and the guided FCM algorithm (Figure 3b). It can be seen that the background and block are clearly distinguished in Figure 3b. However, if only the FCM algorithm is used, the result is shown in Figure 3a. Even if the magnetization attribute is added, the block cannot be distinguished well.
At the same time, we counted the priori constraint cluster centers of velocity, the cluster centers of velocity for the two clustering algorithms with a single property, and the cluster centers of velocity for the two clustering algorithms with two properties are shown in Table 1. The centers of the guided FCM with two properties and the constraint centers paired better.
Then we drew the cross-plots of values for the two properties pairings in pairs (Figure 4). As shown in Figure 4, we found that the cluster of each layer in the physical property values statistics of guided FCM clustering was closer to the true physical property values than that of FCM clustering, which shows that the results were more consistent with the physical distribution in the true model; thus, the guided FCM clustering could be used successfully to divide the two blocks. This proved that the guided FCM clustering has a higher accuracy than FCM clustering in the interpretations of inversion results.
Complicated model
In this section, the joint inversion results of the complicated model are considered as an example to illustrate the difference of the FCM algorithm and guided FCM algorithm in dealing with the multi-layered model interpretations.
The inversion results were derived from the work of Bo, et al.’s previous study [41]. The result area is 30 km × 6 km (30 km in the horizontal direction and 6 km in the vertical direction). The number of grids is 150 × 30, and the horizontal and vertical grid spacing are both equal to 0.2 km. There is a triangle anomalous body in the model, with higher density, higher magnetization, and higher velocity (Figure 5), and the physical property values are listed in Table 2. And the true cluster of model showed in Figure 5. The results of joint inversion are shown in Figure 6a, Figure 6b and Figure 6c, which were based on the work of Bo, et al. [41].
Our work is to reconstruct the underground model according to the joint inversion results of the three physical properties (Figure 6) and the Table 2.
According to Table 2, the value of the priori constraint cluster center coincides with the model property, so we divided the data into eight classes for this test. First, we do the single physical propriety with the guided FCM. The results for the two clustering algorithms along with the density inversion results are shown in Figure 7. And, the priori constraint cluster centers, cluster centers, and guided cluster centers are presented in Table 3.
We found that class 8 appeared at the bottom of the model. And, there were some wrong classes under the triangle body and the layer interfaces were not very flat.
Then, the inversion results for density, velocity, and magnetization were integrated into a data set, which was clustered into eight classes by the FCM algorithm and guided FCM algorithm. The results are shown in Figure 8.
By comparing Figure 8a and Figure 8b, it is obvious that the effect of guided FCM clustering is better than that of FCM clustering, and the thickness and depth of each layer corresponded to the true model, especially the 7th layer, as it was clustered into the anomaly body in FCM clustering and the anomaly body was clustered into the 6th layer. However, in the guided FCM clustering, the 7th layer was classified more accurately, and there was only a slight deviation in the shape between the high-velocity anomaly body and the true model, where the overall shape was similar to the true model.
Next, we drew the cross-plots of values for three properties pairings in pairs (Figure 9). We can see that the physical properties statistics of both algorithms showed a strong normality, but the peak of each layer in the physical property values statistics for the guided FCM clustering was closer to the true physical property values than that for the FCM clustering, which demonstrates that it is more consistent with the physical distribution in the true model. This finding proves that the guided FCM clustering has a higher accuracy than FCM clustering in inversion result interpretations.
The model RMS errors of different clustering algorithms with different data were analyzed separately (Table 4). The model RMS of the guided FCM clustering with three properties was the smallest, which indicates that this result was closest to the model.
Field Example
In this study, a section (DSRP2002) of the Baiyun Sag in the Pearl River Mouth Basin of the South China Sea was selected as the research object, and the location is shown in Figure 10. This line passes through the Baiyun Sag and is located at the intersection of the Eurasian Plate, the Pacific Plate, and the Indo-Australian Plate. The geological conditions are complicated, and Huang [45] conducted a detailed analysis of the velocity structure in this area.
The comprehensive geophysical exploration team of Tongji University (2011-2015) produced a statistical table for the density and magnetization in the South China Sea on the basis of research statistics for the rock density, velocity, and magnetic characteristics (see Table 5), and based on this work, We obtained the joint inversion results for gravity, magnetic, and seismic characteristics on the survey line (Figure 11a, Figure 11b and Figure 11c); in this paper, FCM clustering and guided FCM clustering were performed on the results. The gravity-magnetic-seismic joint inversion results and a priori constraint cluster center (Table 5) were selected. The specific numerical values and two clustering algorithms were used, and the cluster centers of the results are listed in Table 6, while the clustering results are shown in Figure 11d and Figure 11e.
Combined with the analysis of the joint inversion results, in FCM clustering, the anomaly body on the left was clustered into a layer, the upper crust was only 2 km thick, and the depth of the lower crust was uplifted to 5-12 km. In contrast, the thickness of the upper crust was about 7-8 km in guided FCM clustering, the depth range of the lower crust was nearly 12 km to 20 km, and the morphology of the anomaly body was clear. The Moho depth is 30 km at the northern Baiyun Sag, and it becomes 19 km at the end of the survey line. Results of guided FCM clustering were consistent with those of the strong crust thinning and apparent uplifting of the Moho surface in Pang [46]. Thus, it can be seen that guided FCM clustering has higher accuracy than FCM clustering in geophysical interpretations.
Conclusion
Different geophysical methods provide different method for us to study the underground structure. In this study, we apply the guided FCM clustering method to the inversion results of different physical properties, so as to obtain a consistent underground interpretation model. In this way, we can obtain clustering results that are consistent with the geophysical characteristics. Through experiments, it was proven that the guided FCM algorithm has a better boundary delineation ability than the FCM algorithm. The guided FCM clustering method produces more accurate results for interpretations of complicated data. In summary, the method has demonstrated the practicality and effectiveness of the proposed method for interpretations of multi-physical geophysical data.
Data Availability Statement
The data used to support the findings of this study are available from the corresponding author upon request.
Acknowledgments
The authors express their sincere thanks for the support from the Chinese National Natural Science Foundation (41806065, 41774123), National Key R&D Program of China (2016YFC0601104), National Science & Technology Major Project (2016ZX05004-003), Shanghai Science and Technology Commission (18DZ1204200), and State Key Laboratory of Marine Geology (Tongji University) (MG20180310).