
International Journal of Earth Science and Geophysics
(ISSN: 2631-5033)
Volume 6, Issue 2
Research Article
DOI: 10.35840/2631-5033/1837

Article Formats
Quality Assessment and Reserve Estimation of the Egnaeja Iron Ore Deposit, North-Central Nigeria using Integrated Approach
Table of Content
Figures
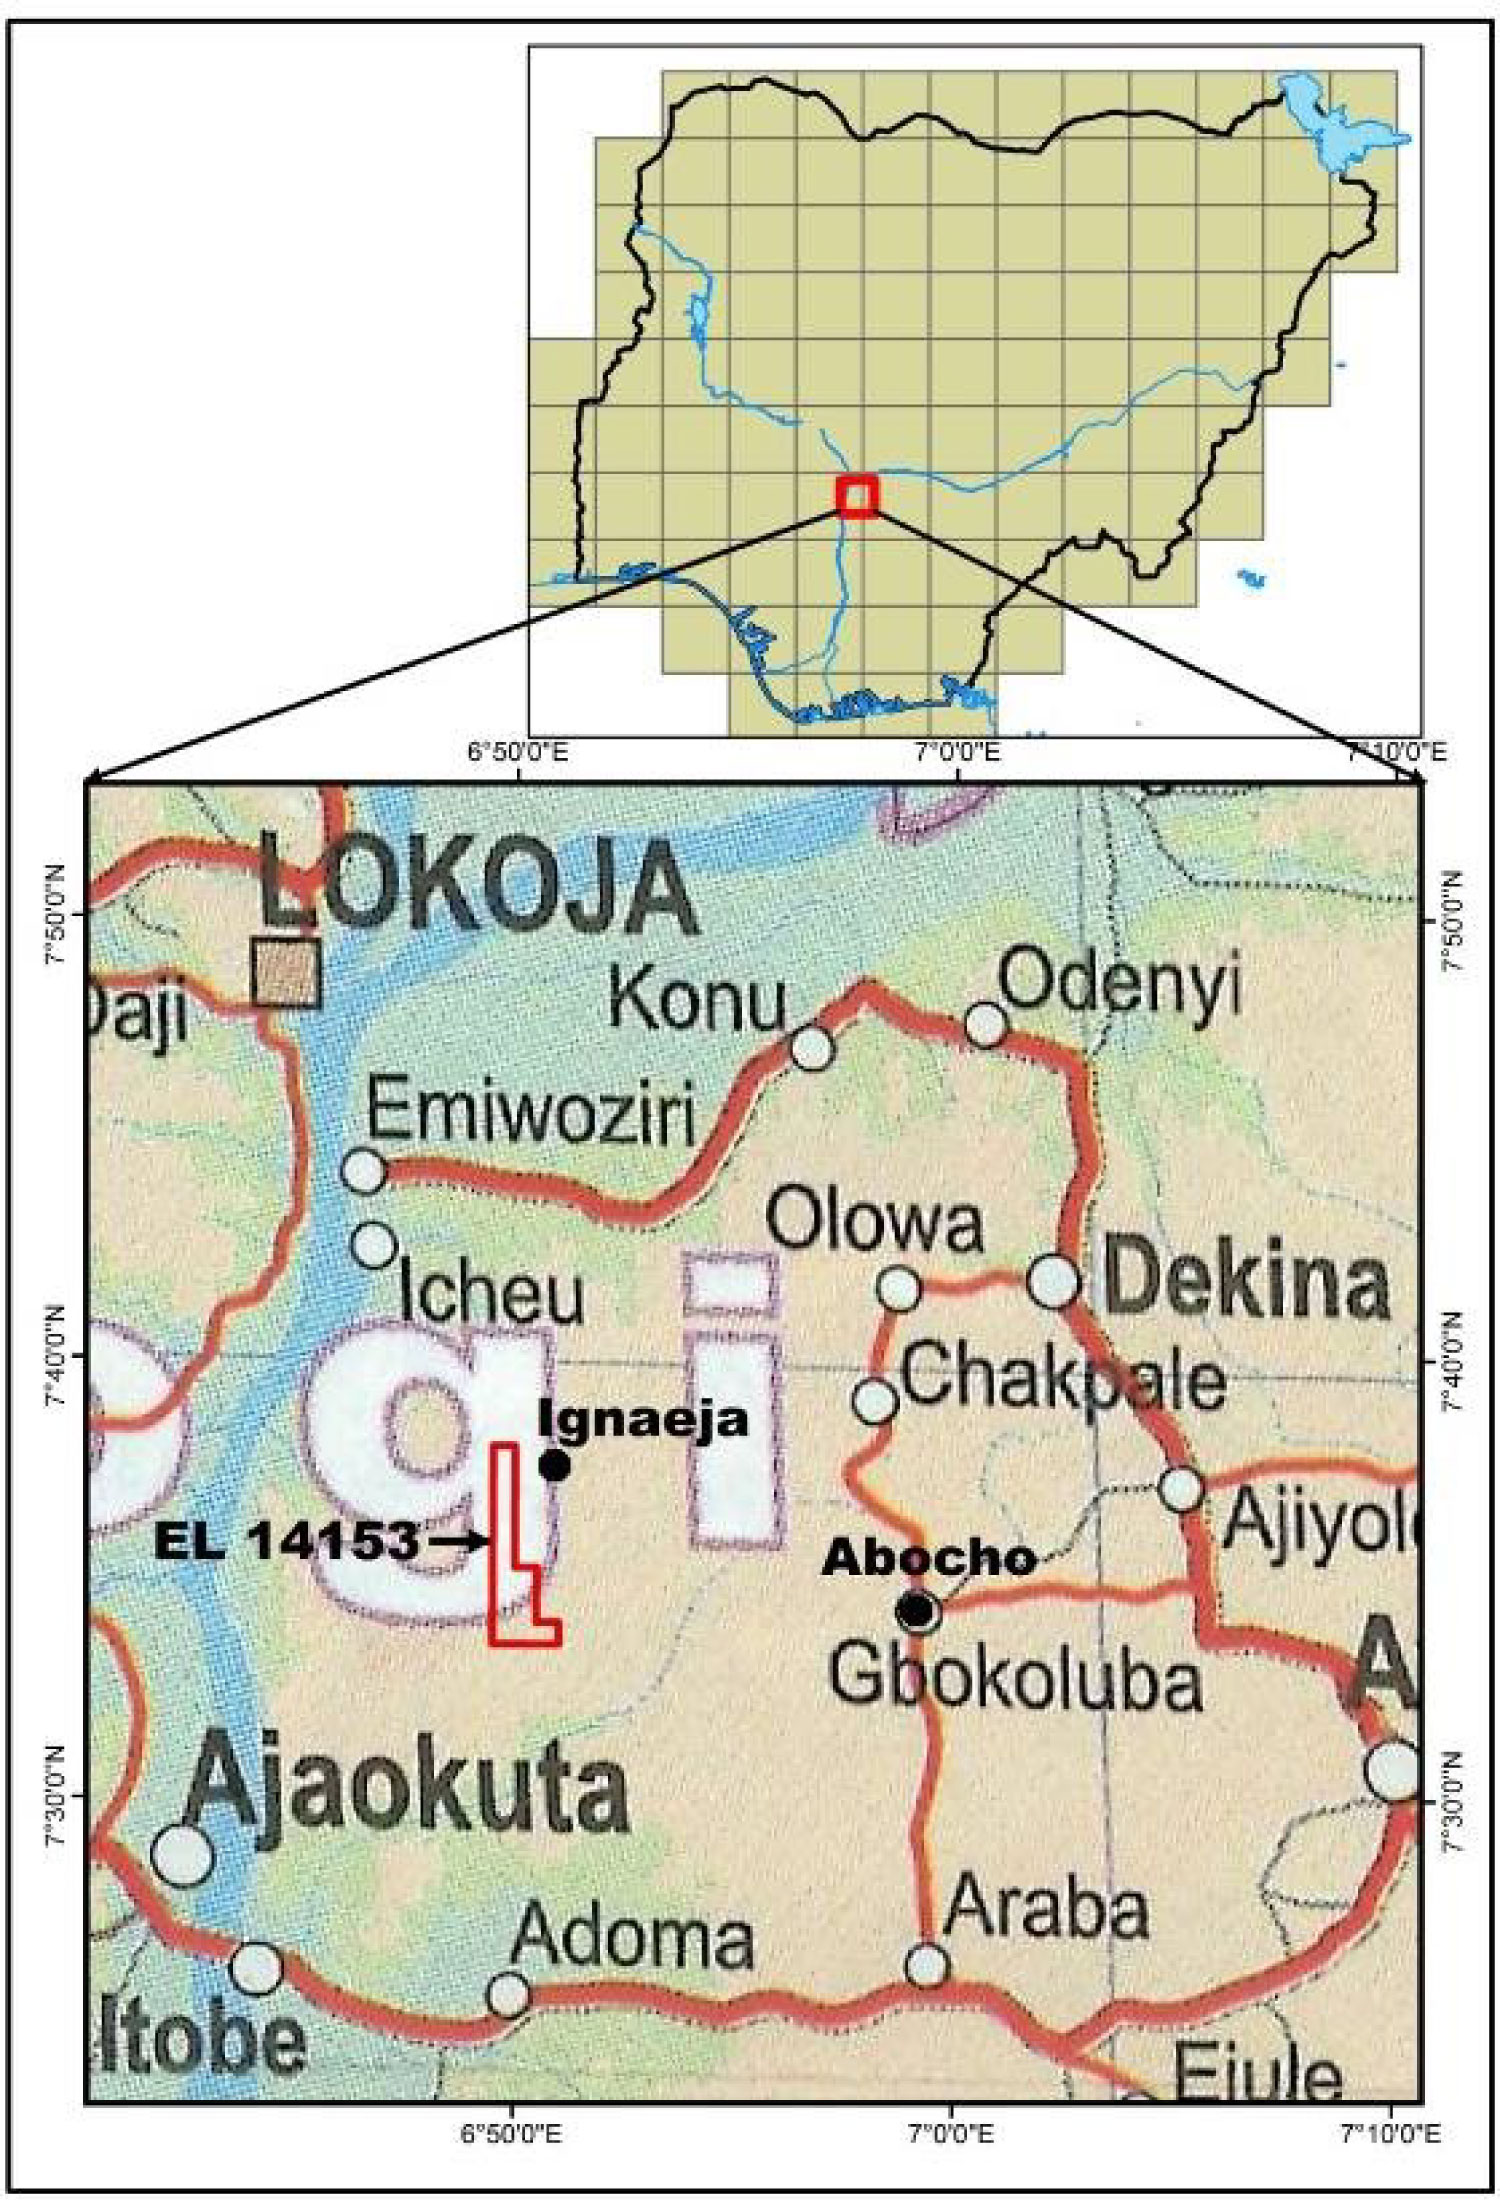
Figure 1: Location map of the study area showing....
Location map of the study area showing Egnaeja town, Kogi state.
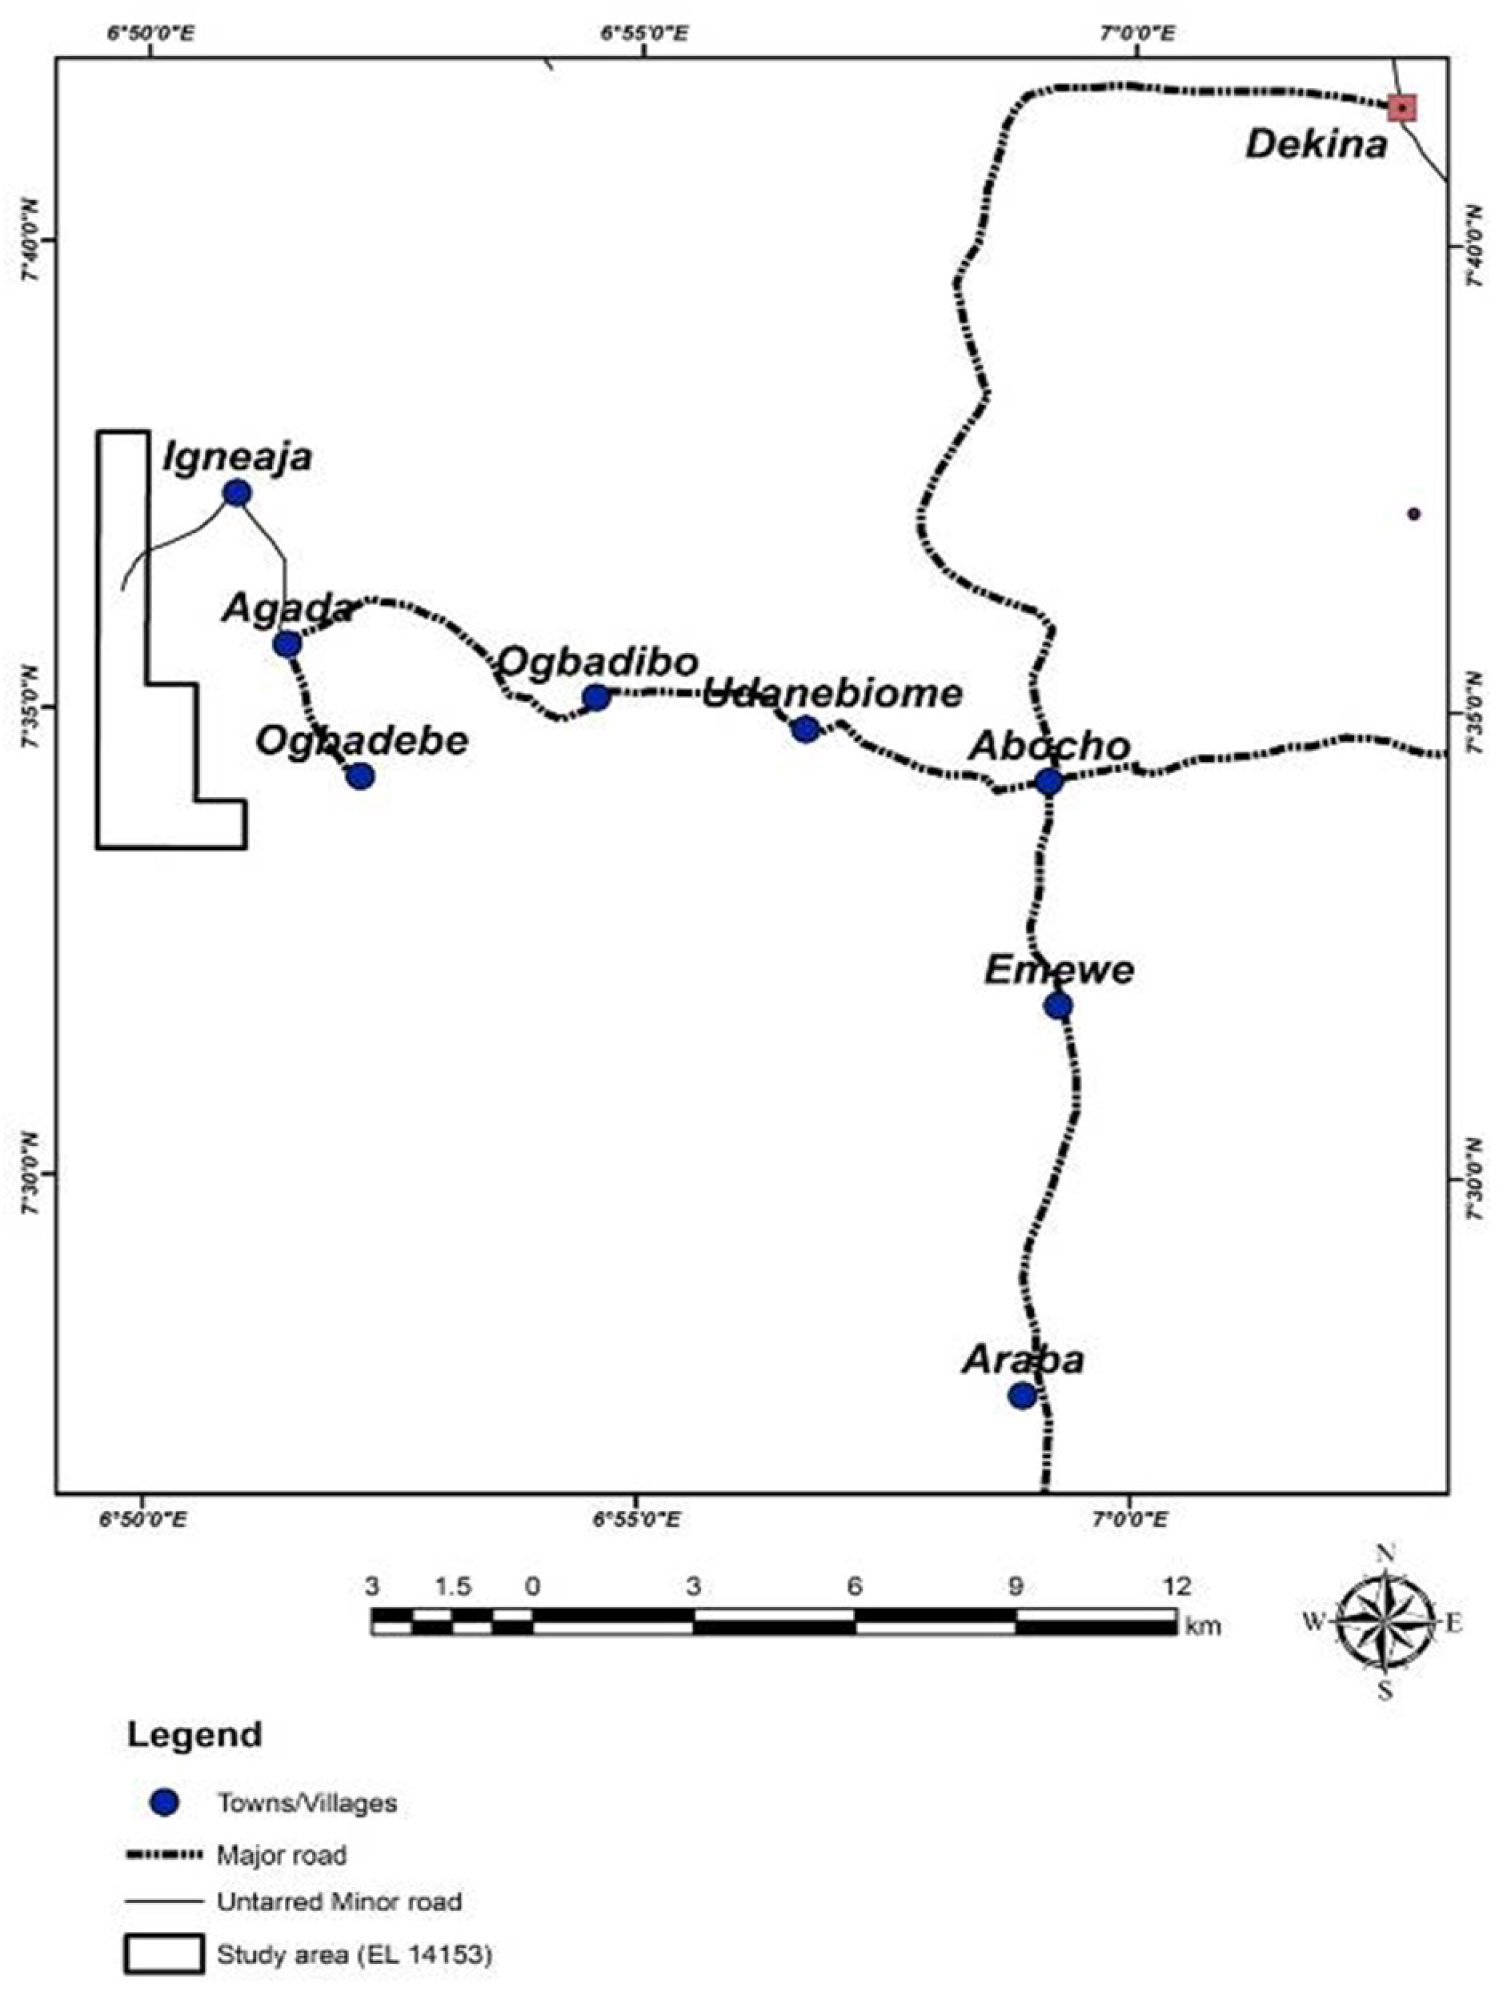
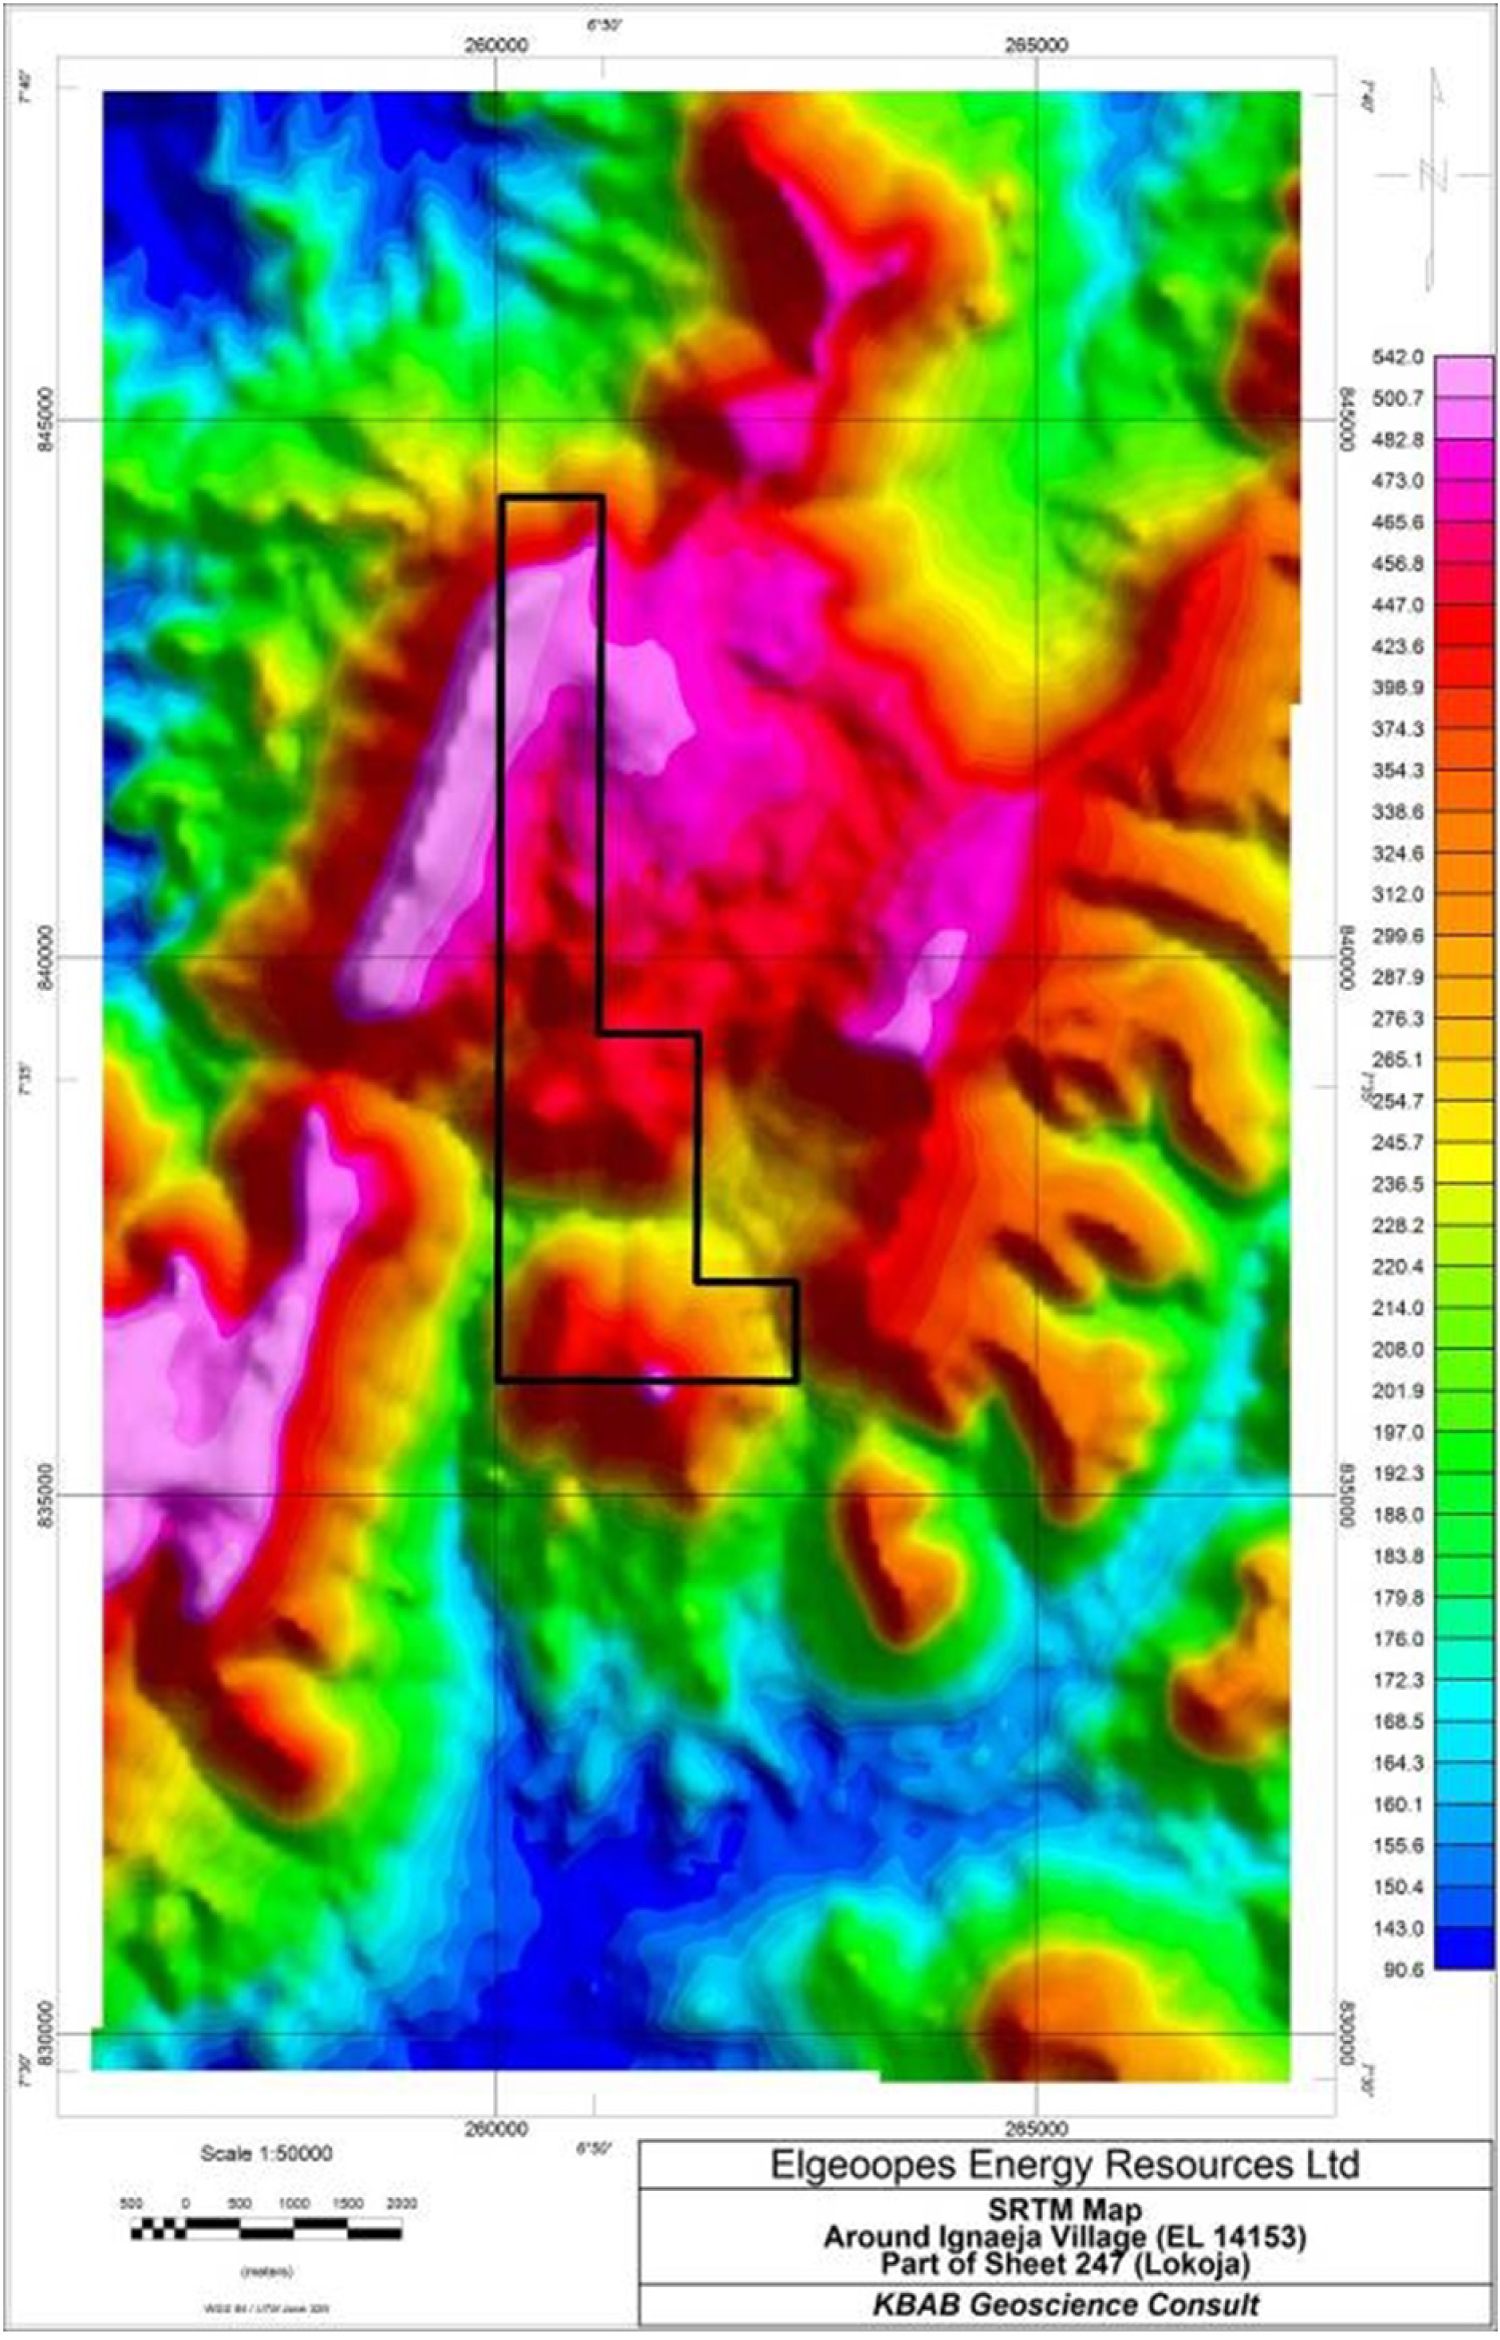
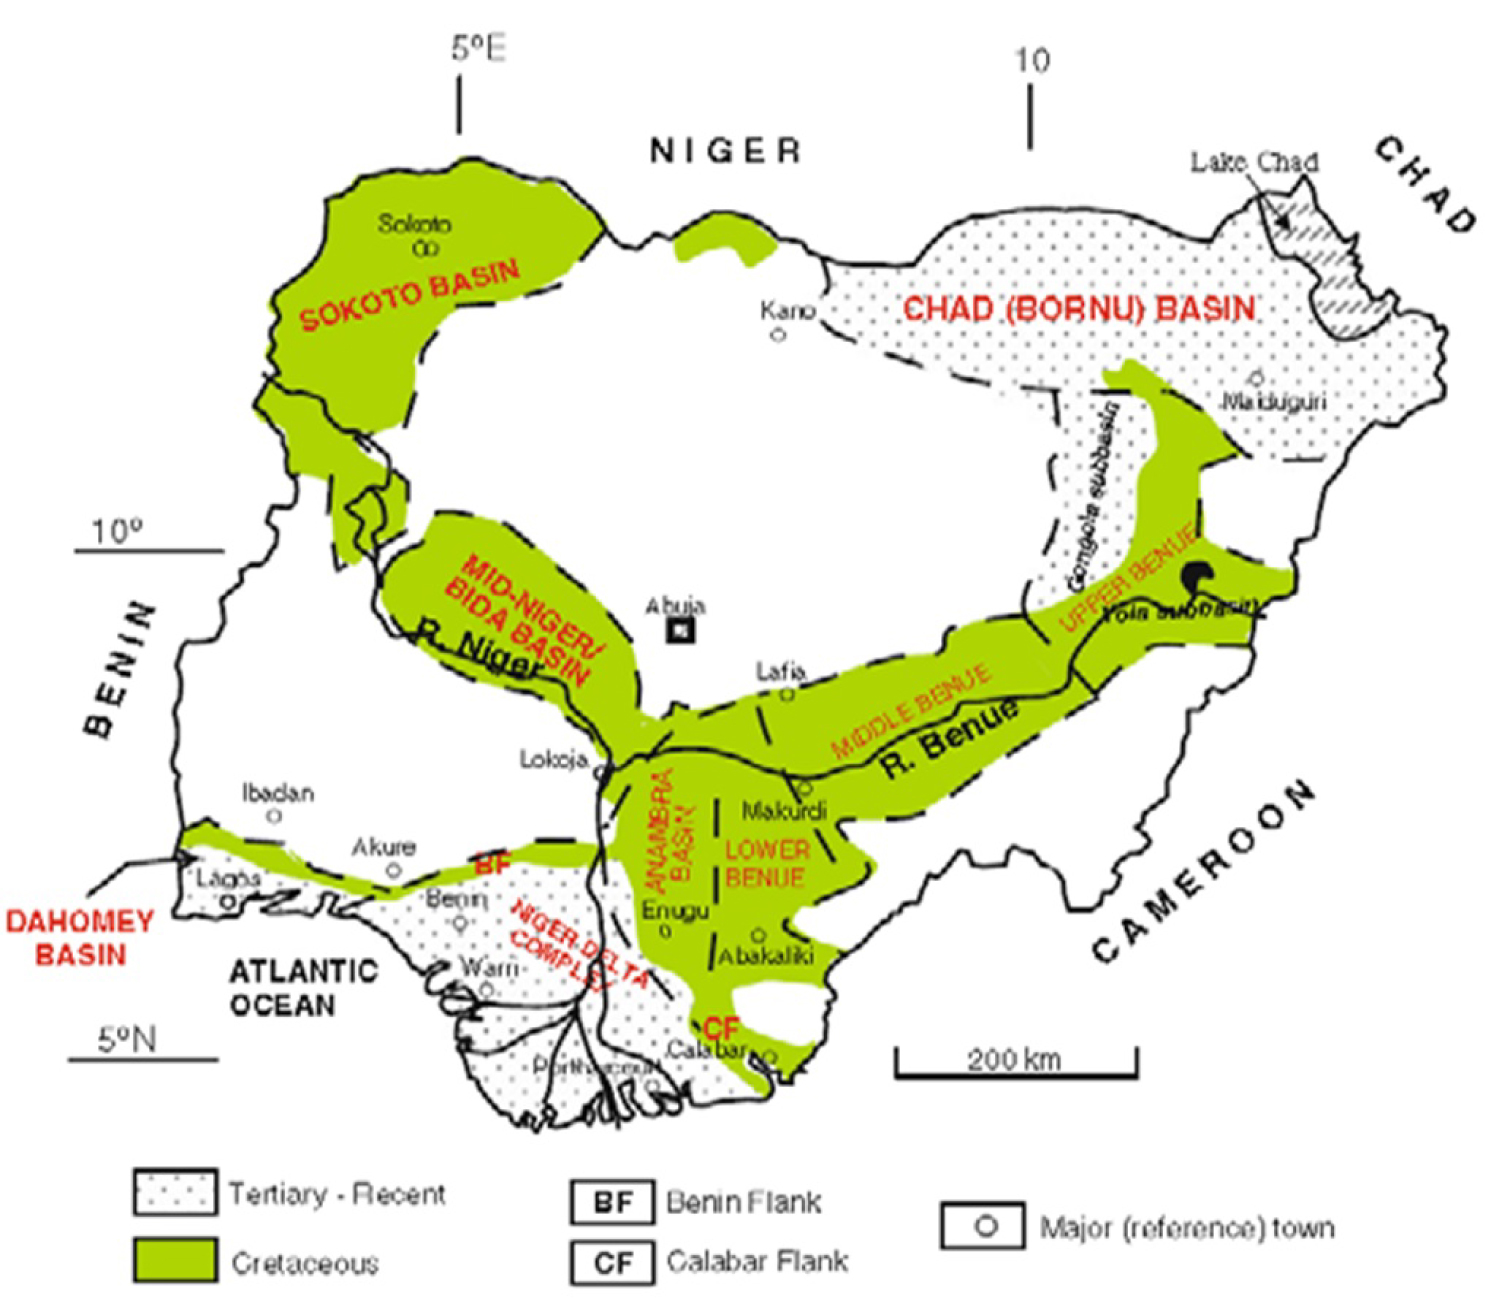
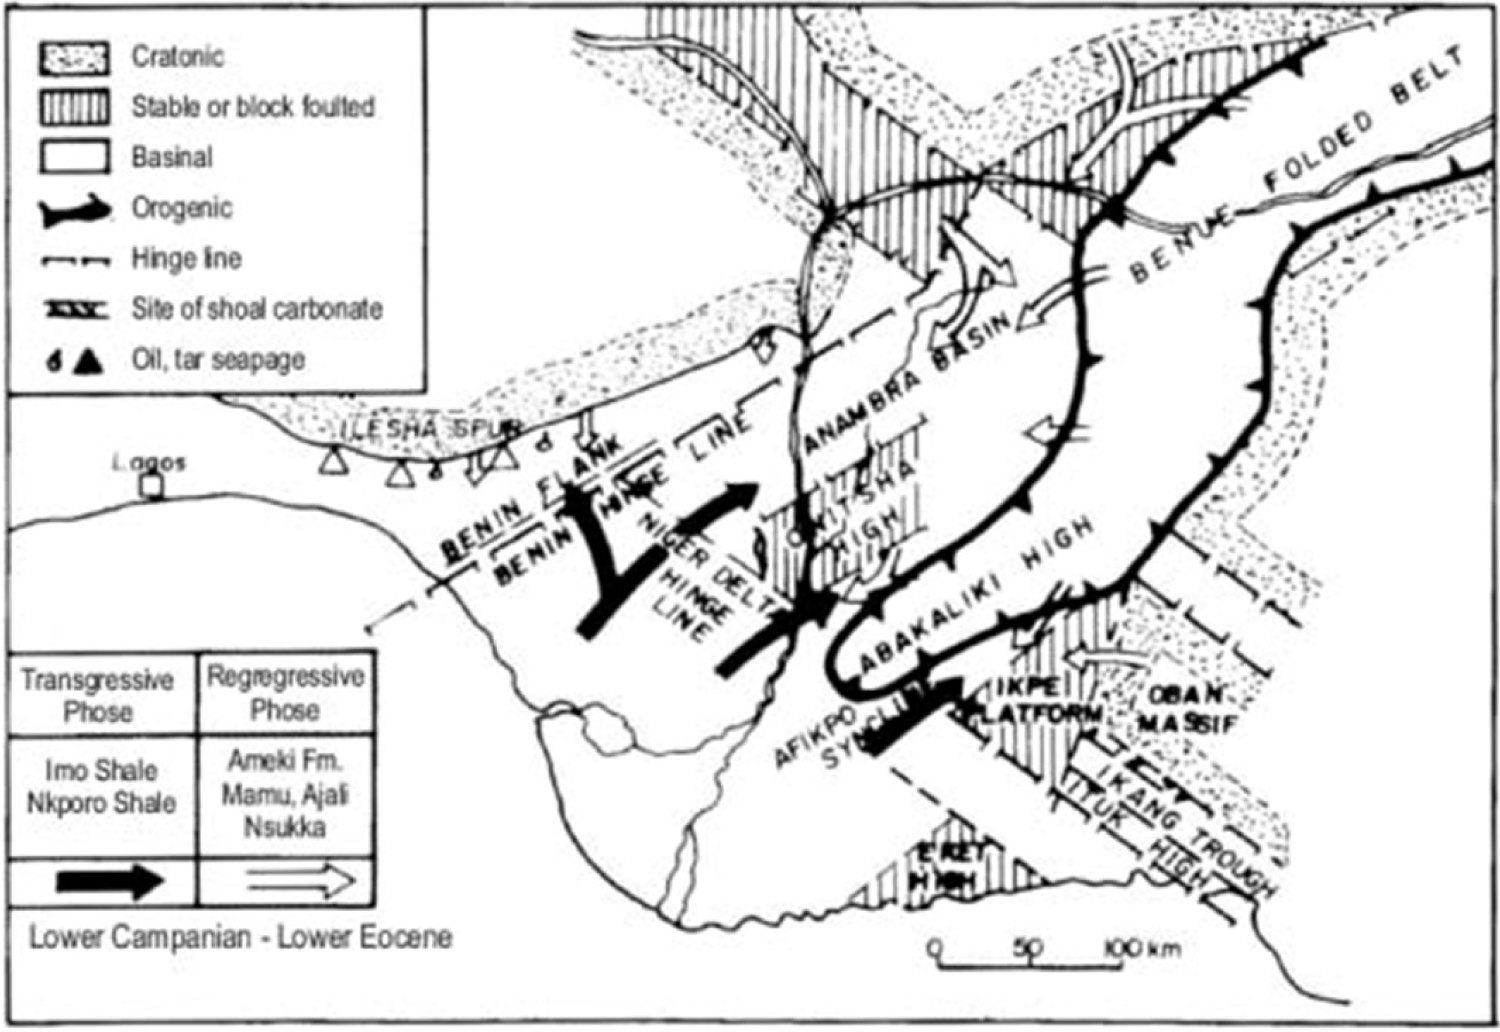
Figure 5: Generalised geological map of Eastern....
Generalised geological map of Eastern Nigeria showing Anambra Basin [17].
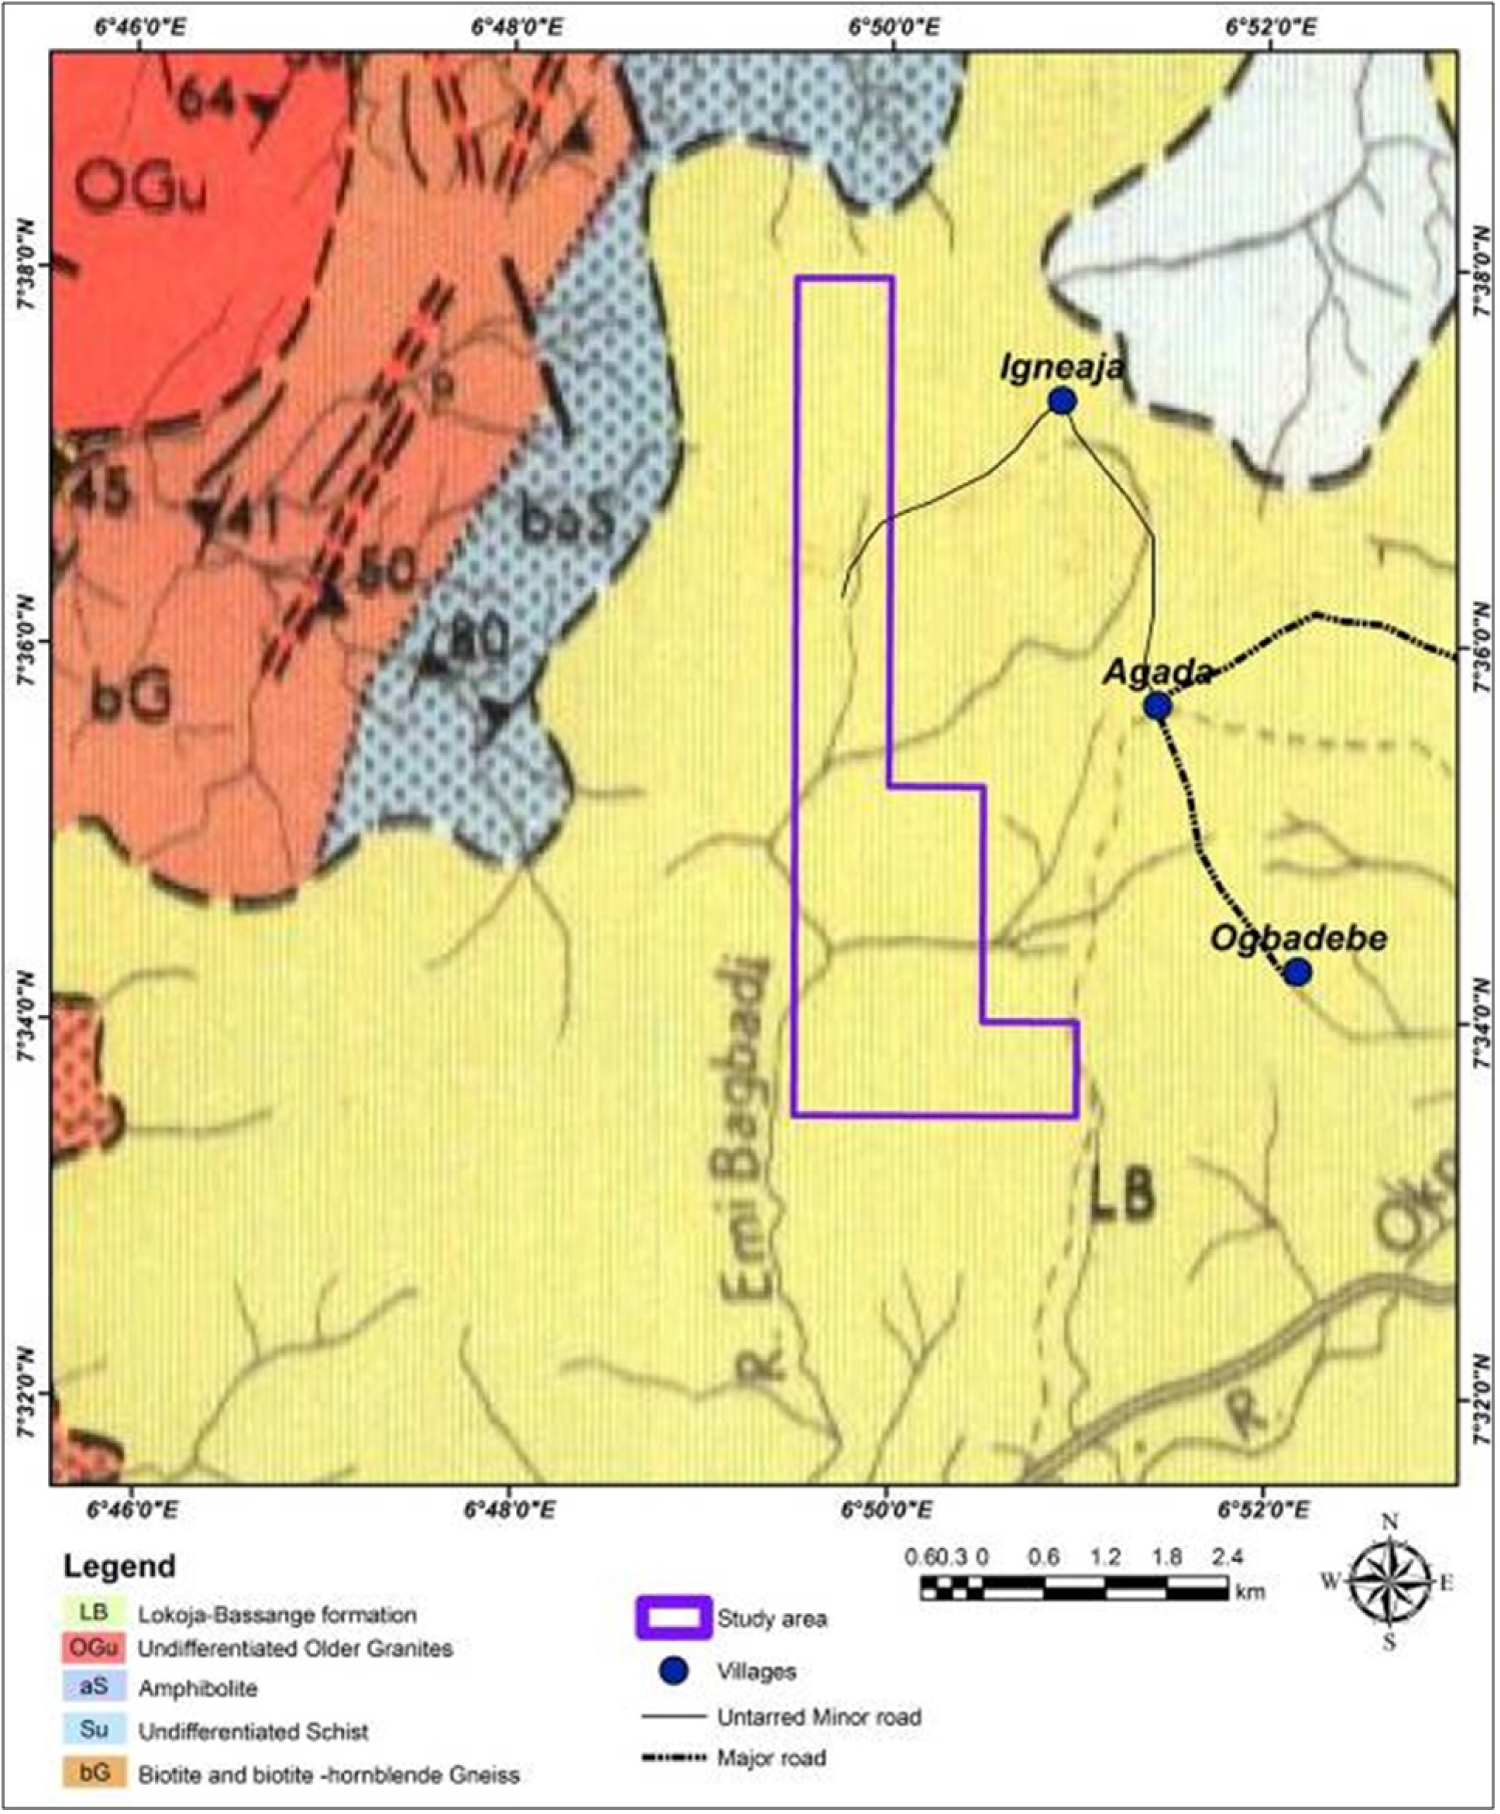
Figure 6: Localized geological map of the study area....
Localized geological map of the study area (Adapted from [12]).
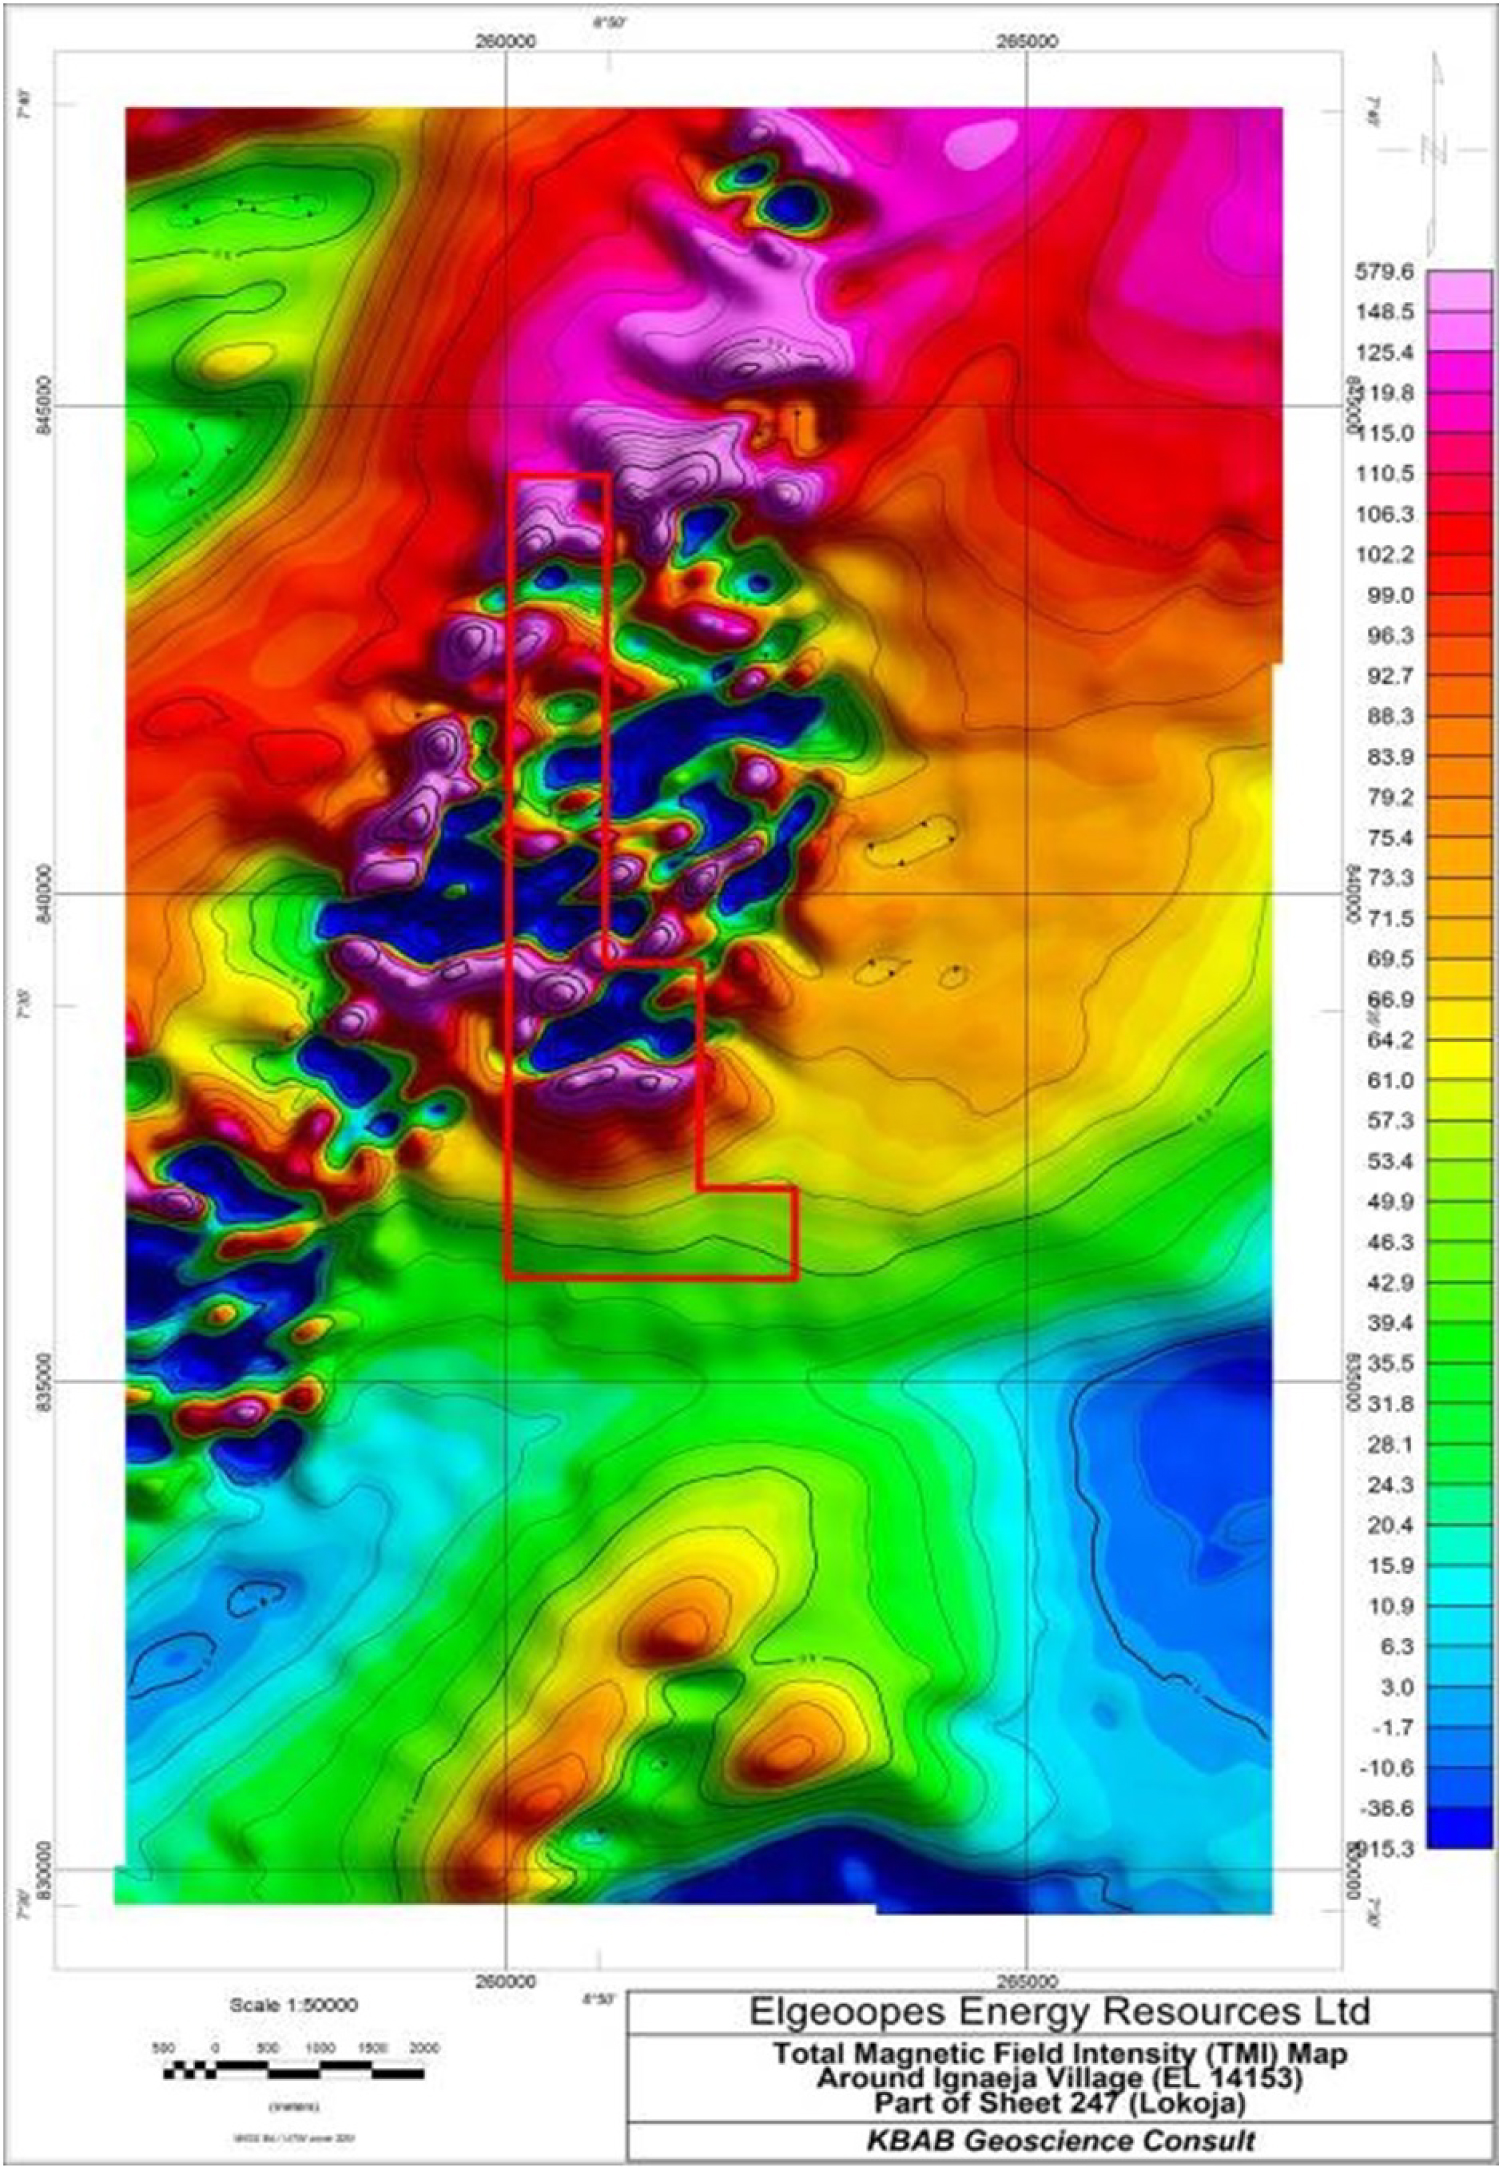
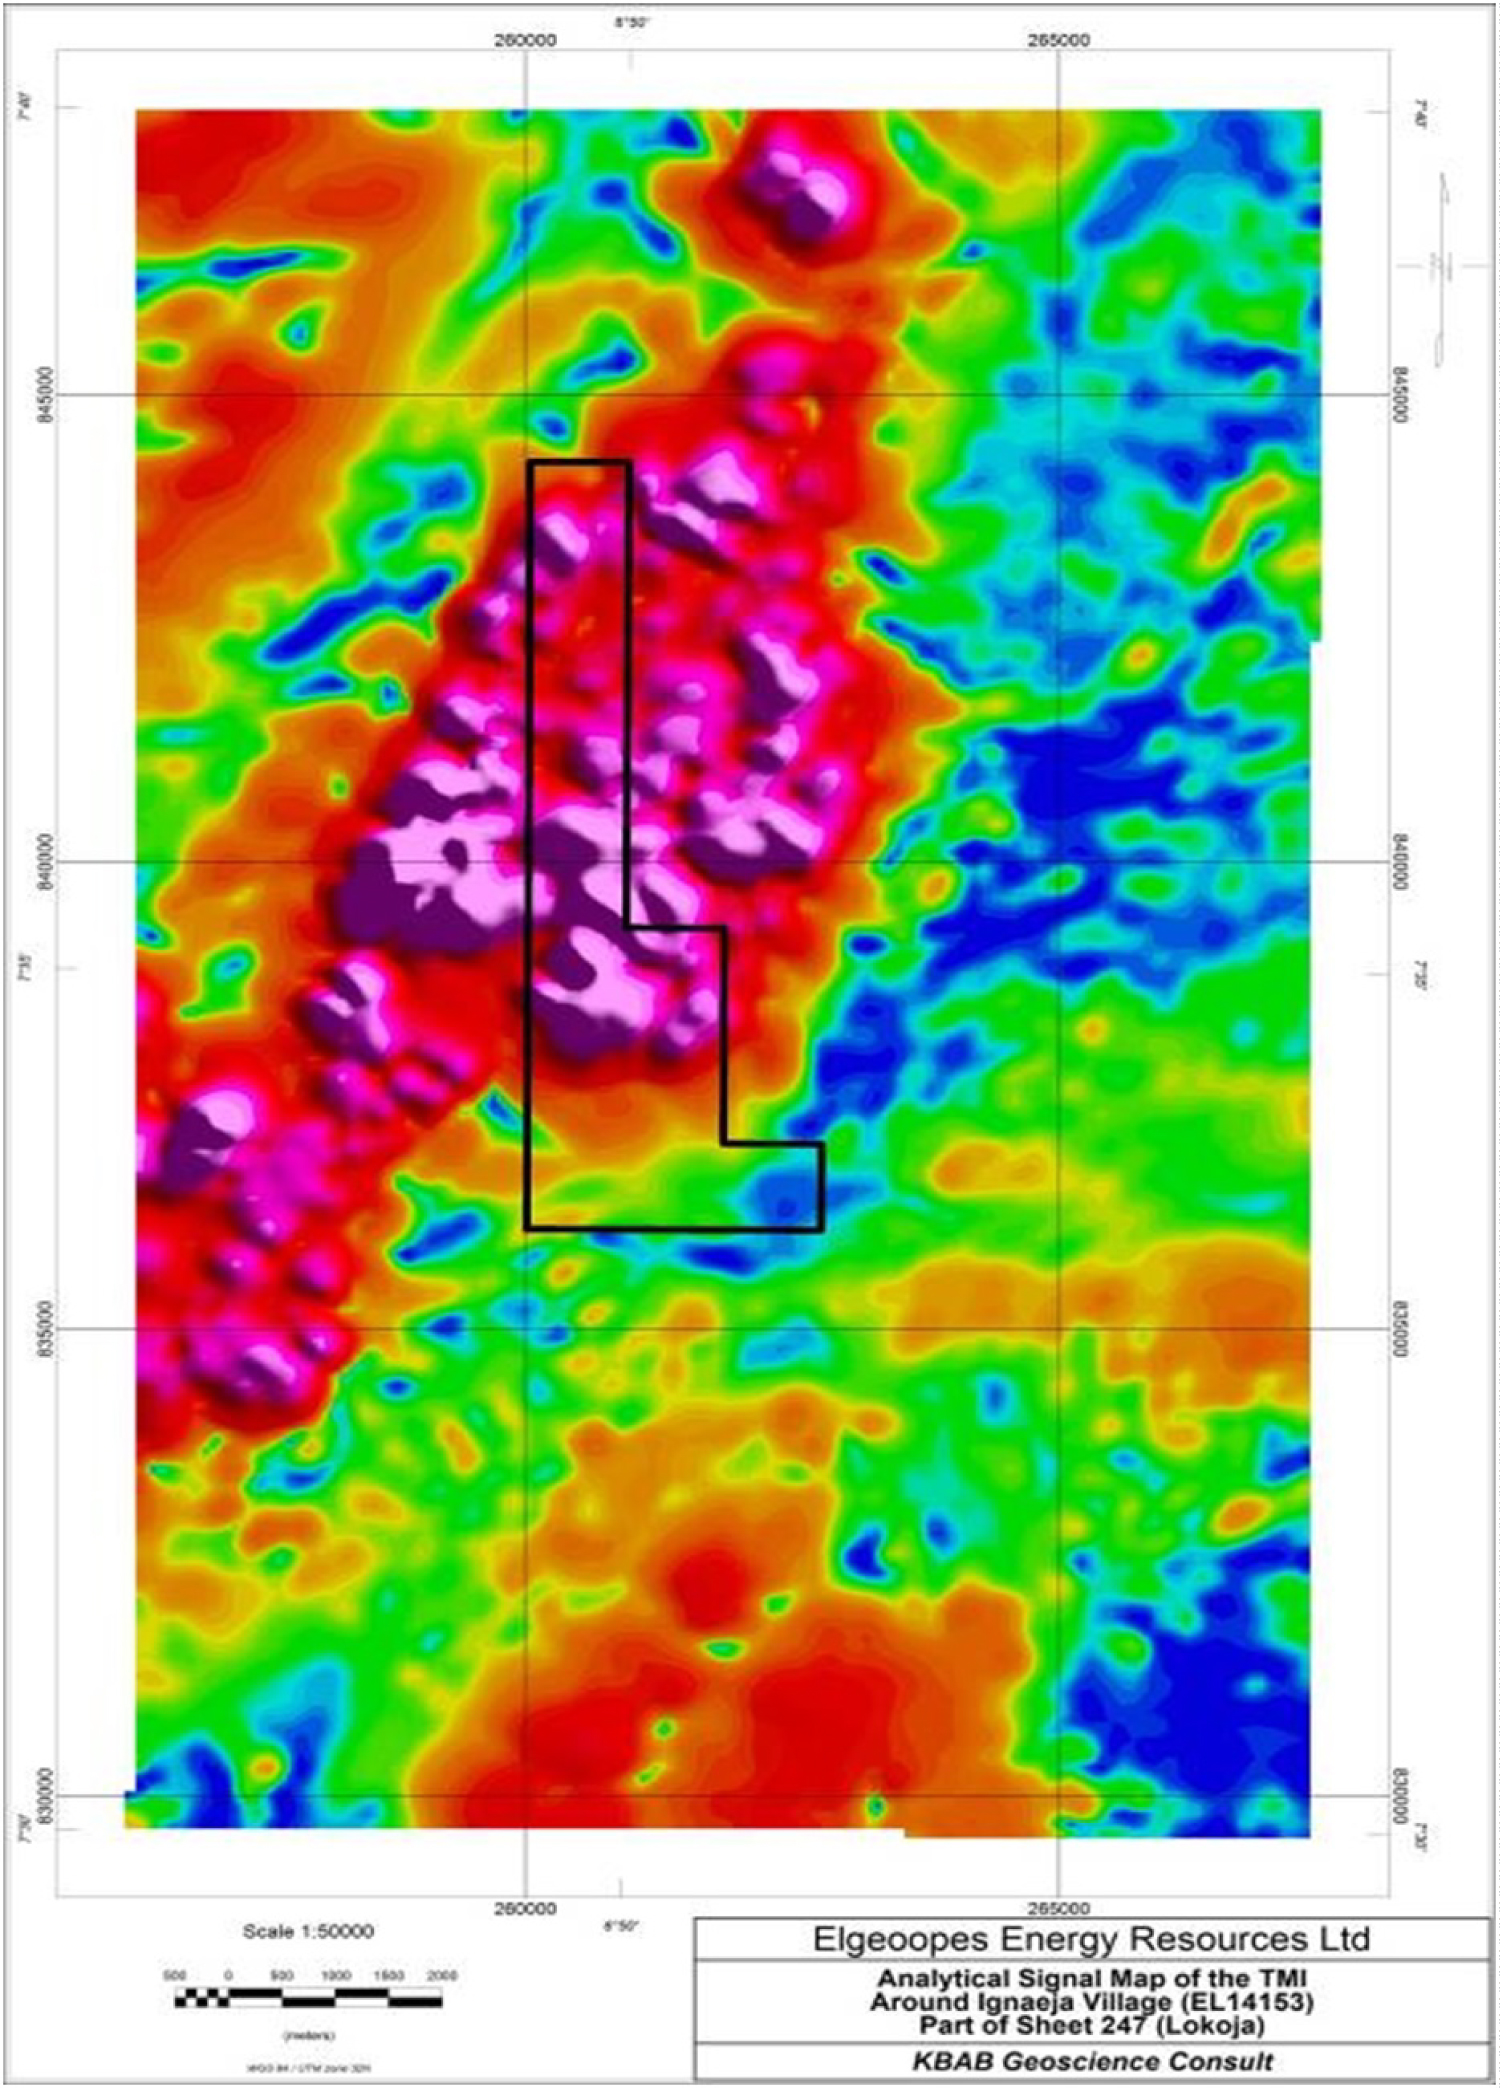
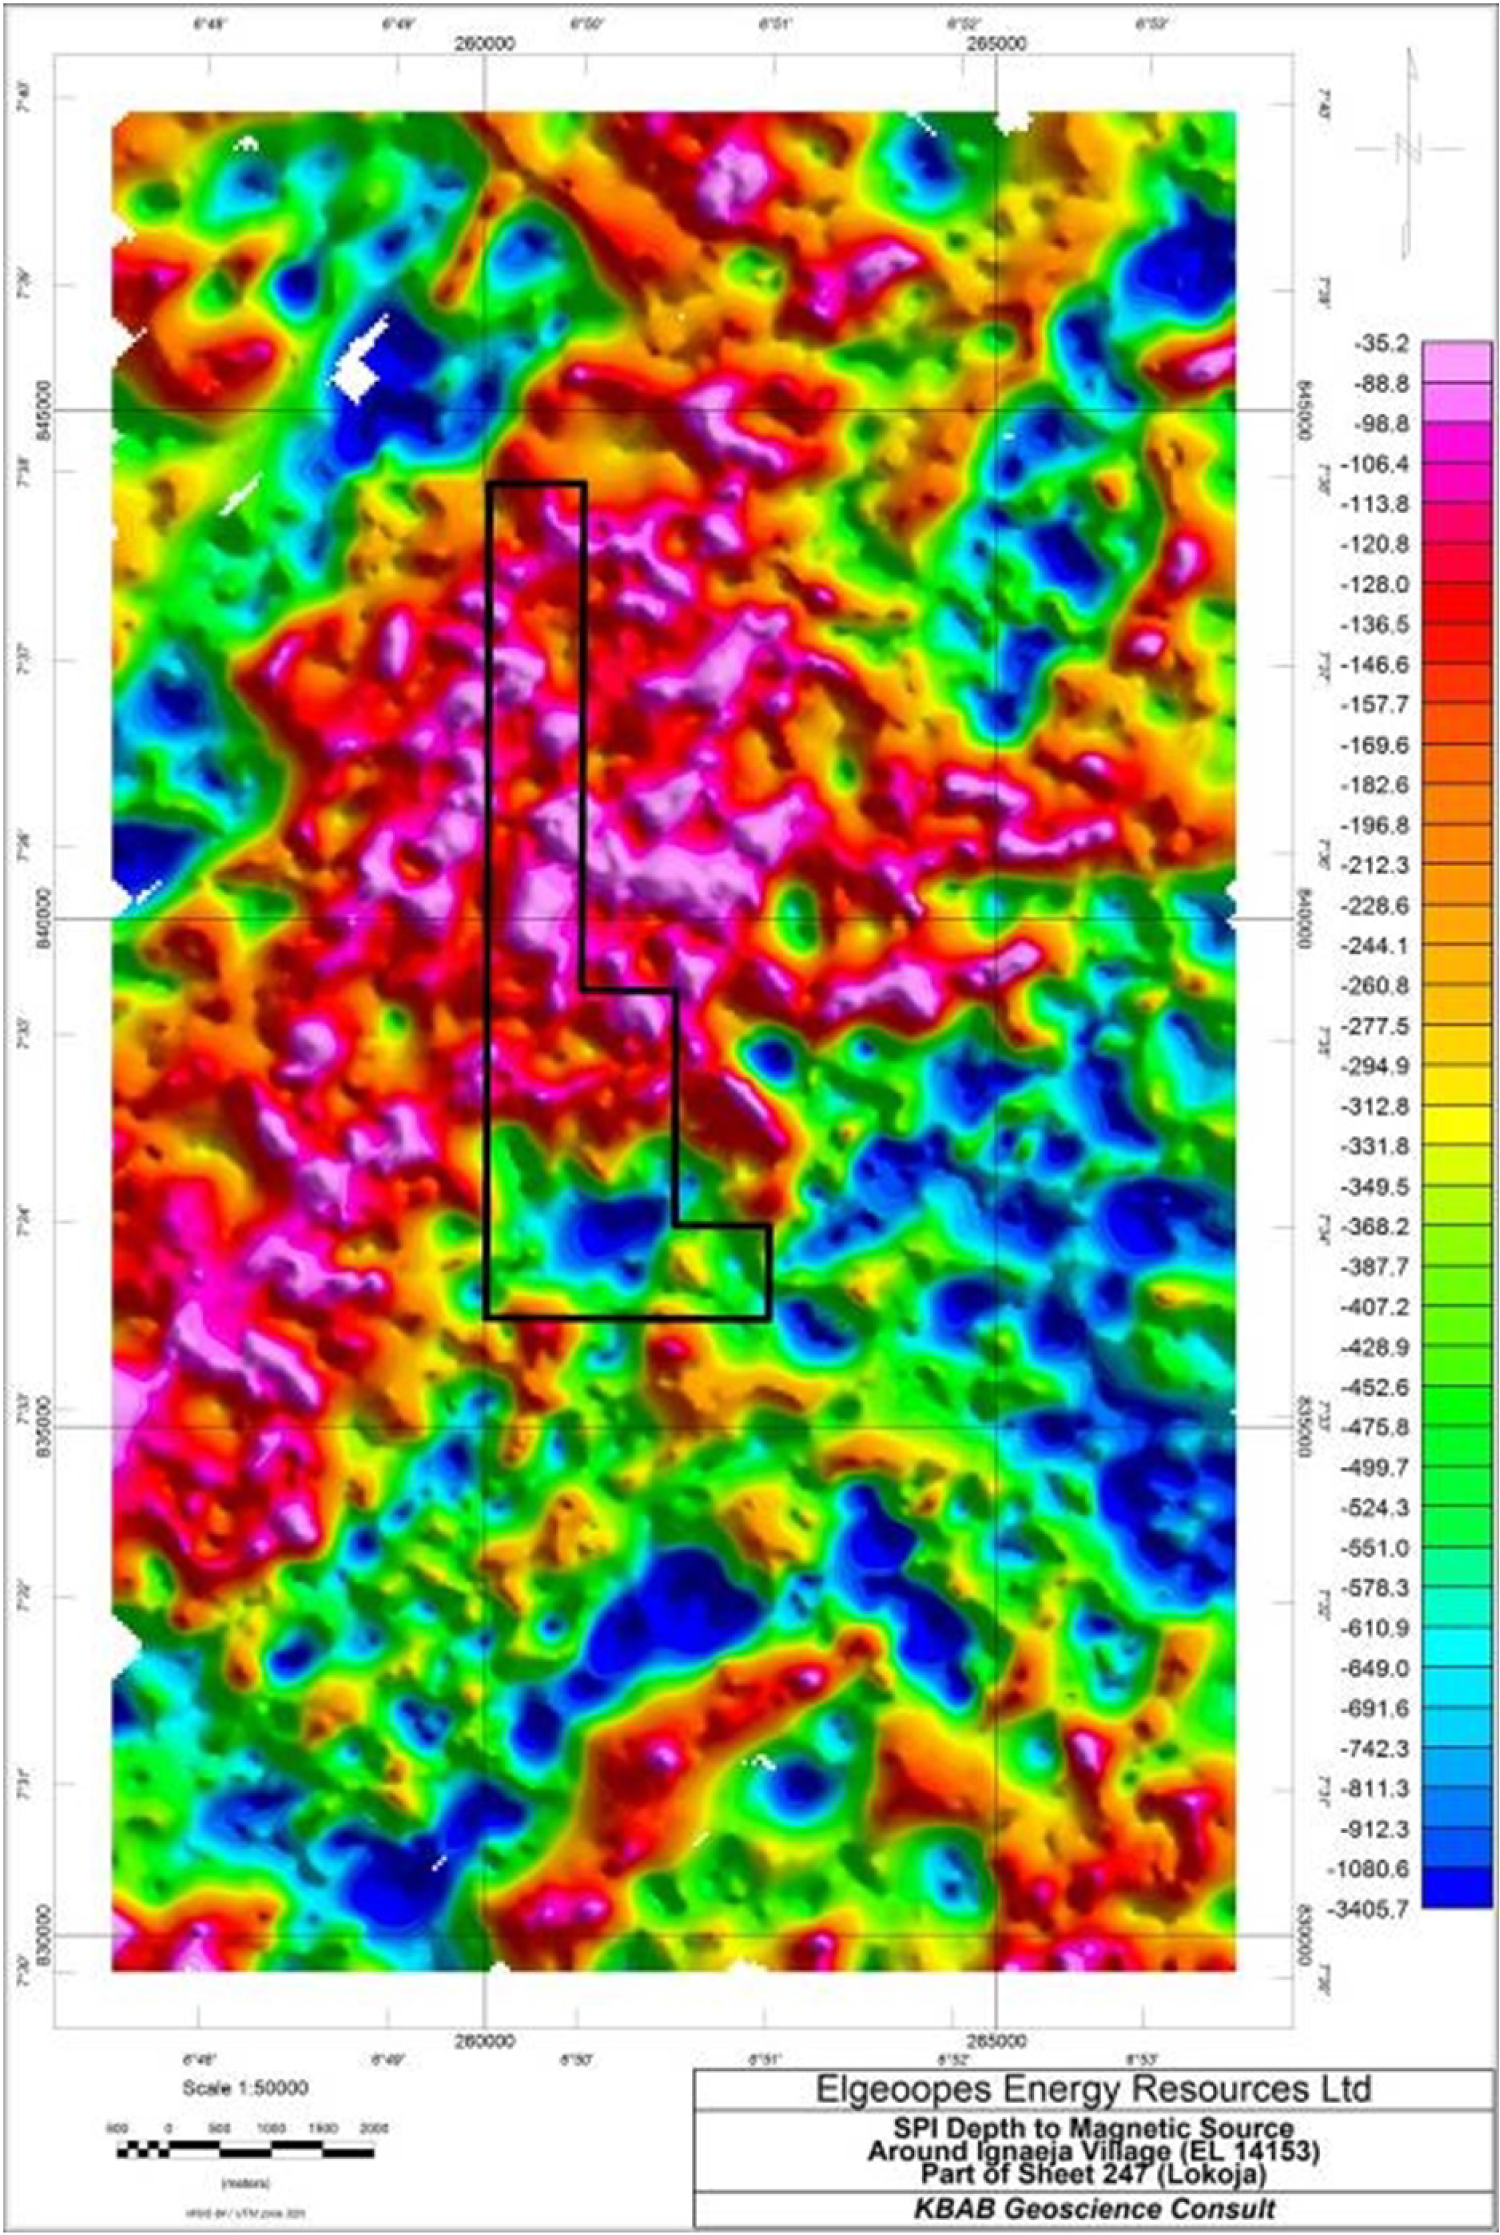
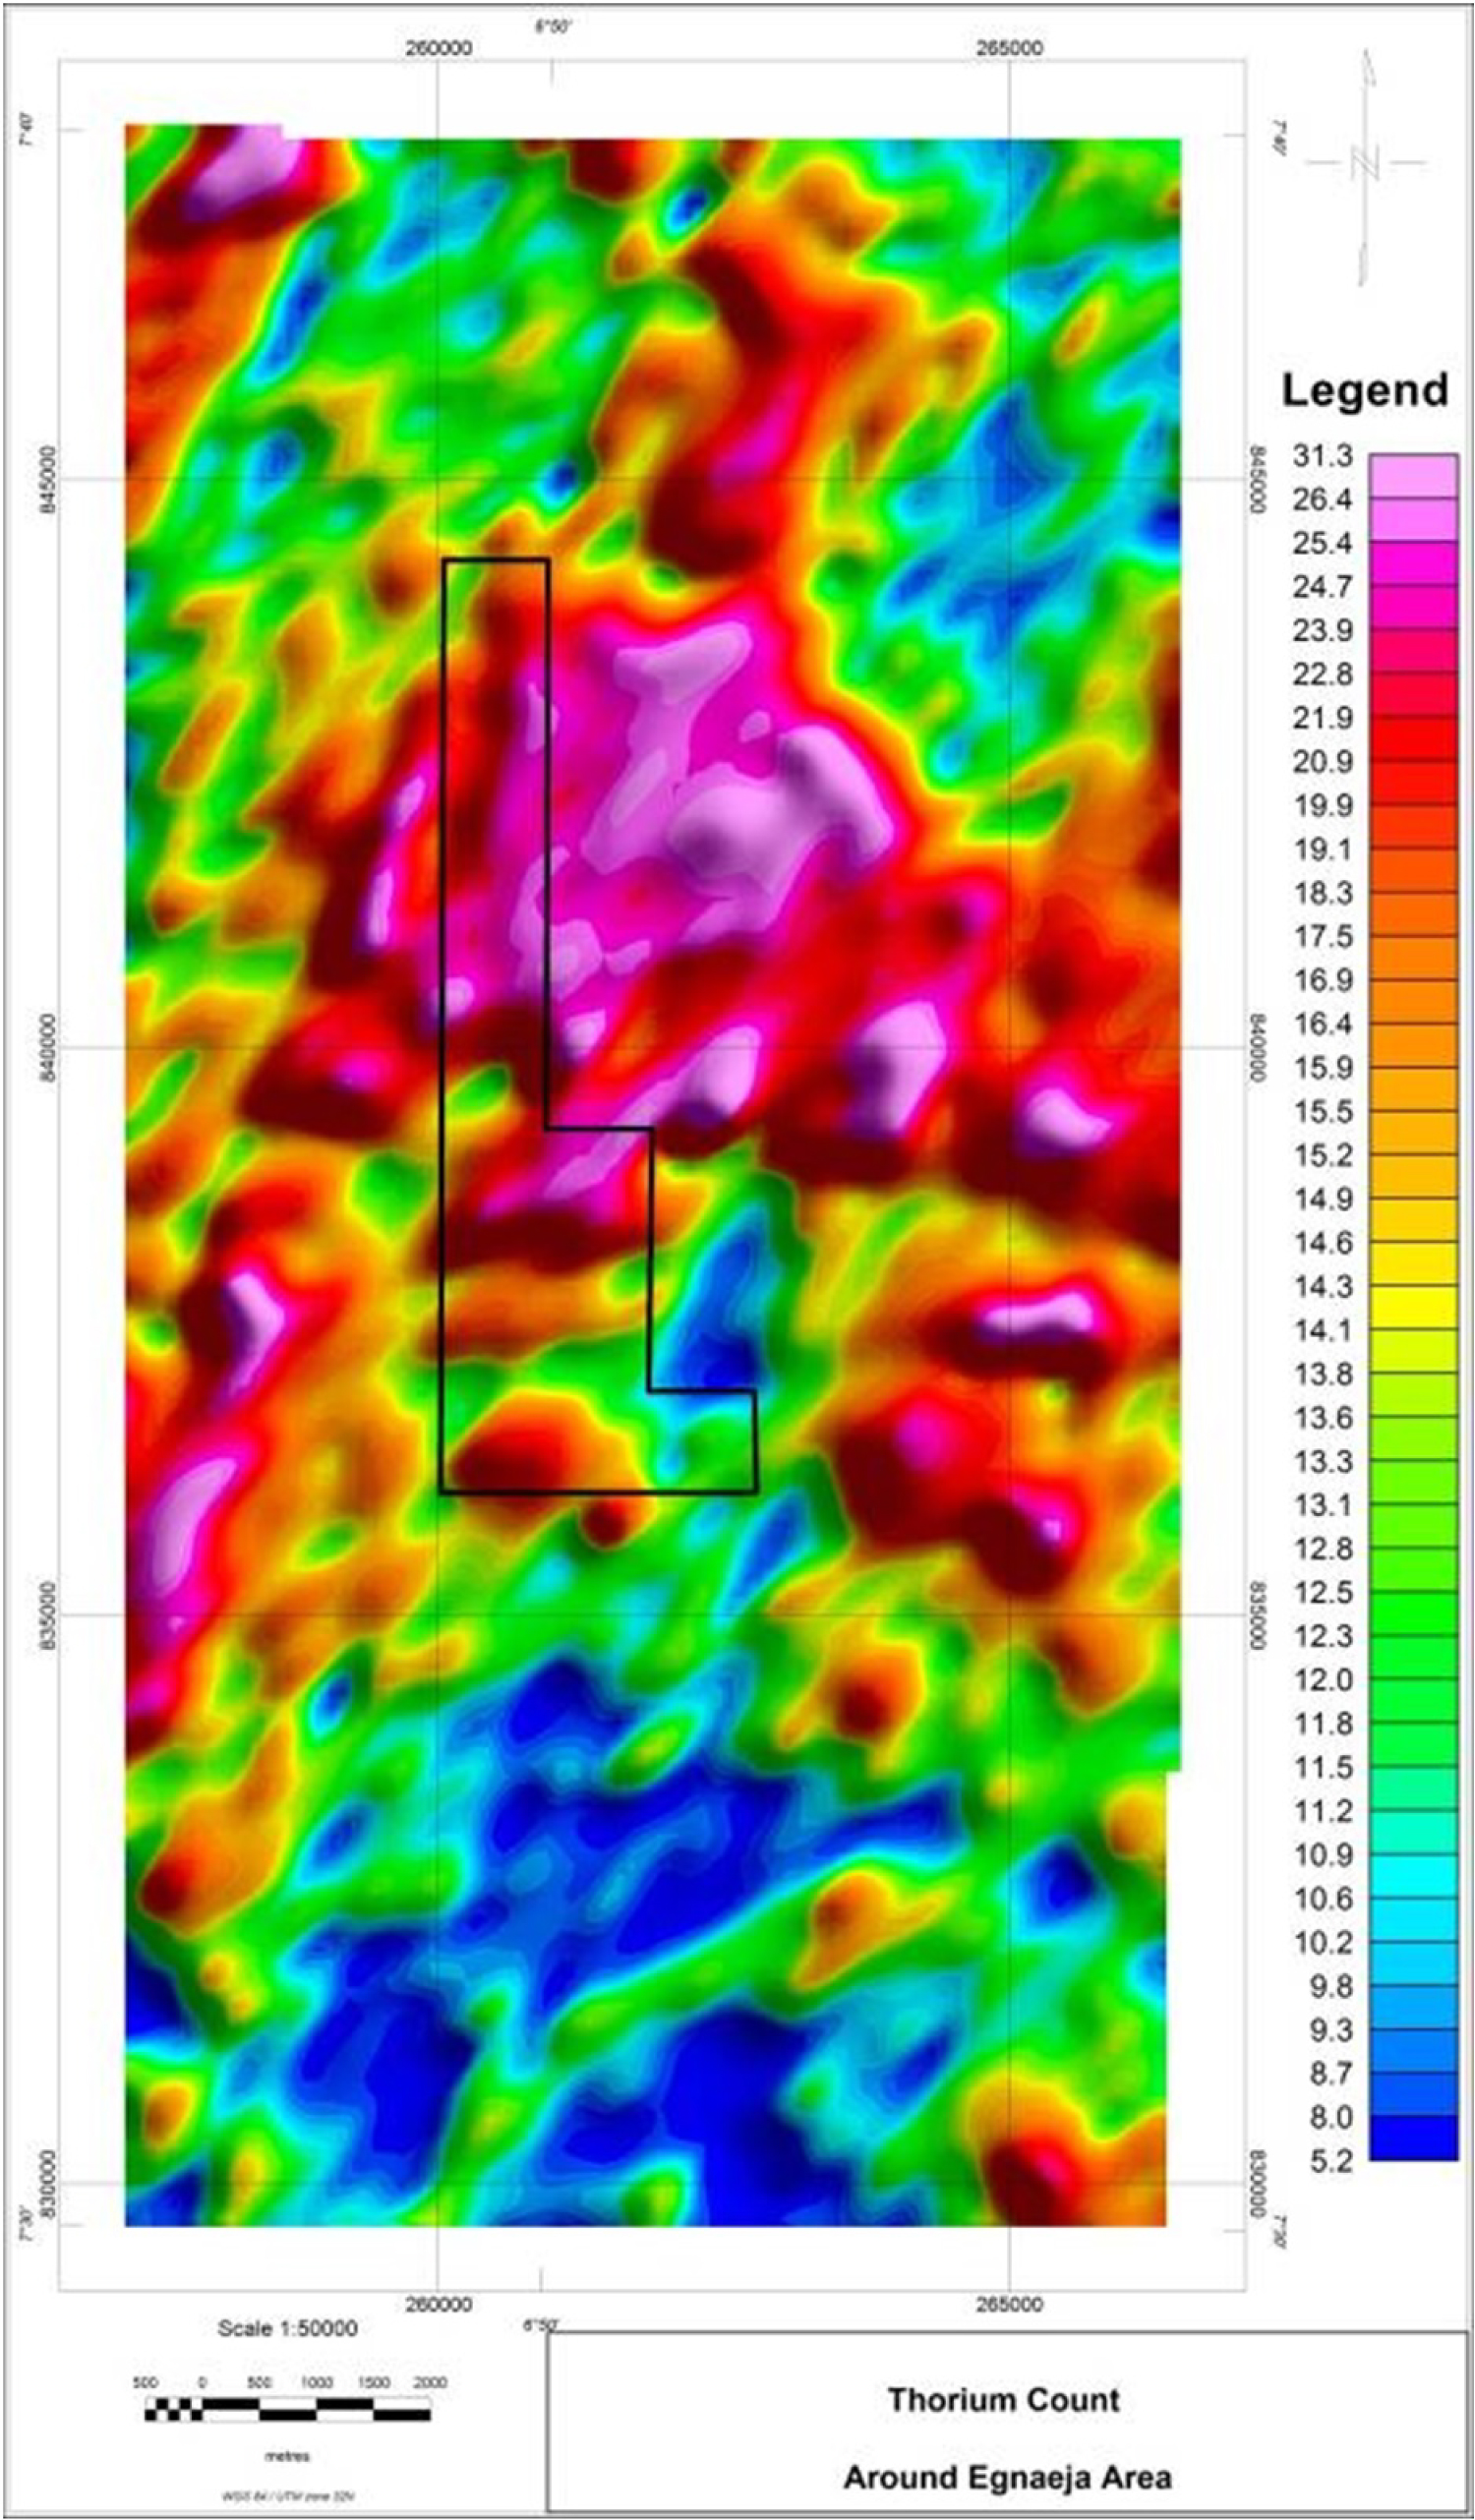
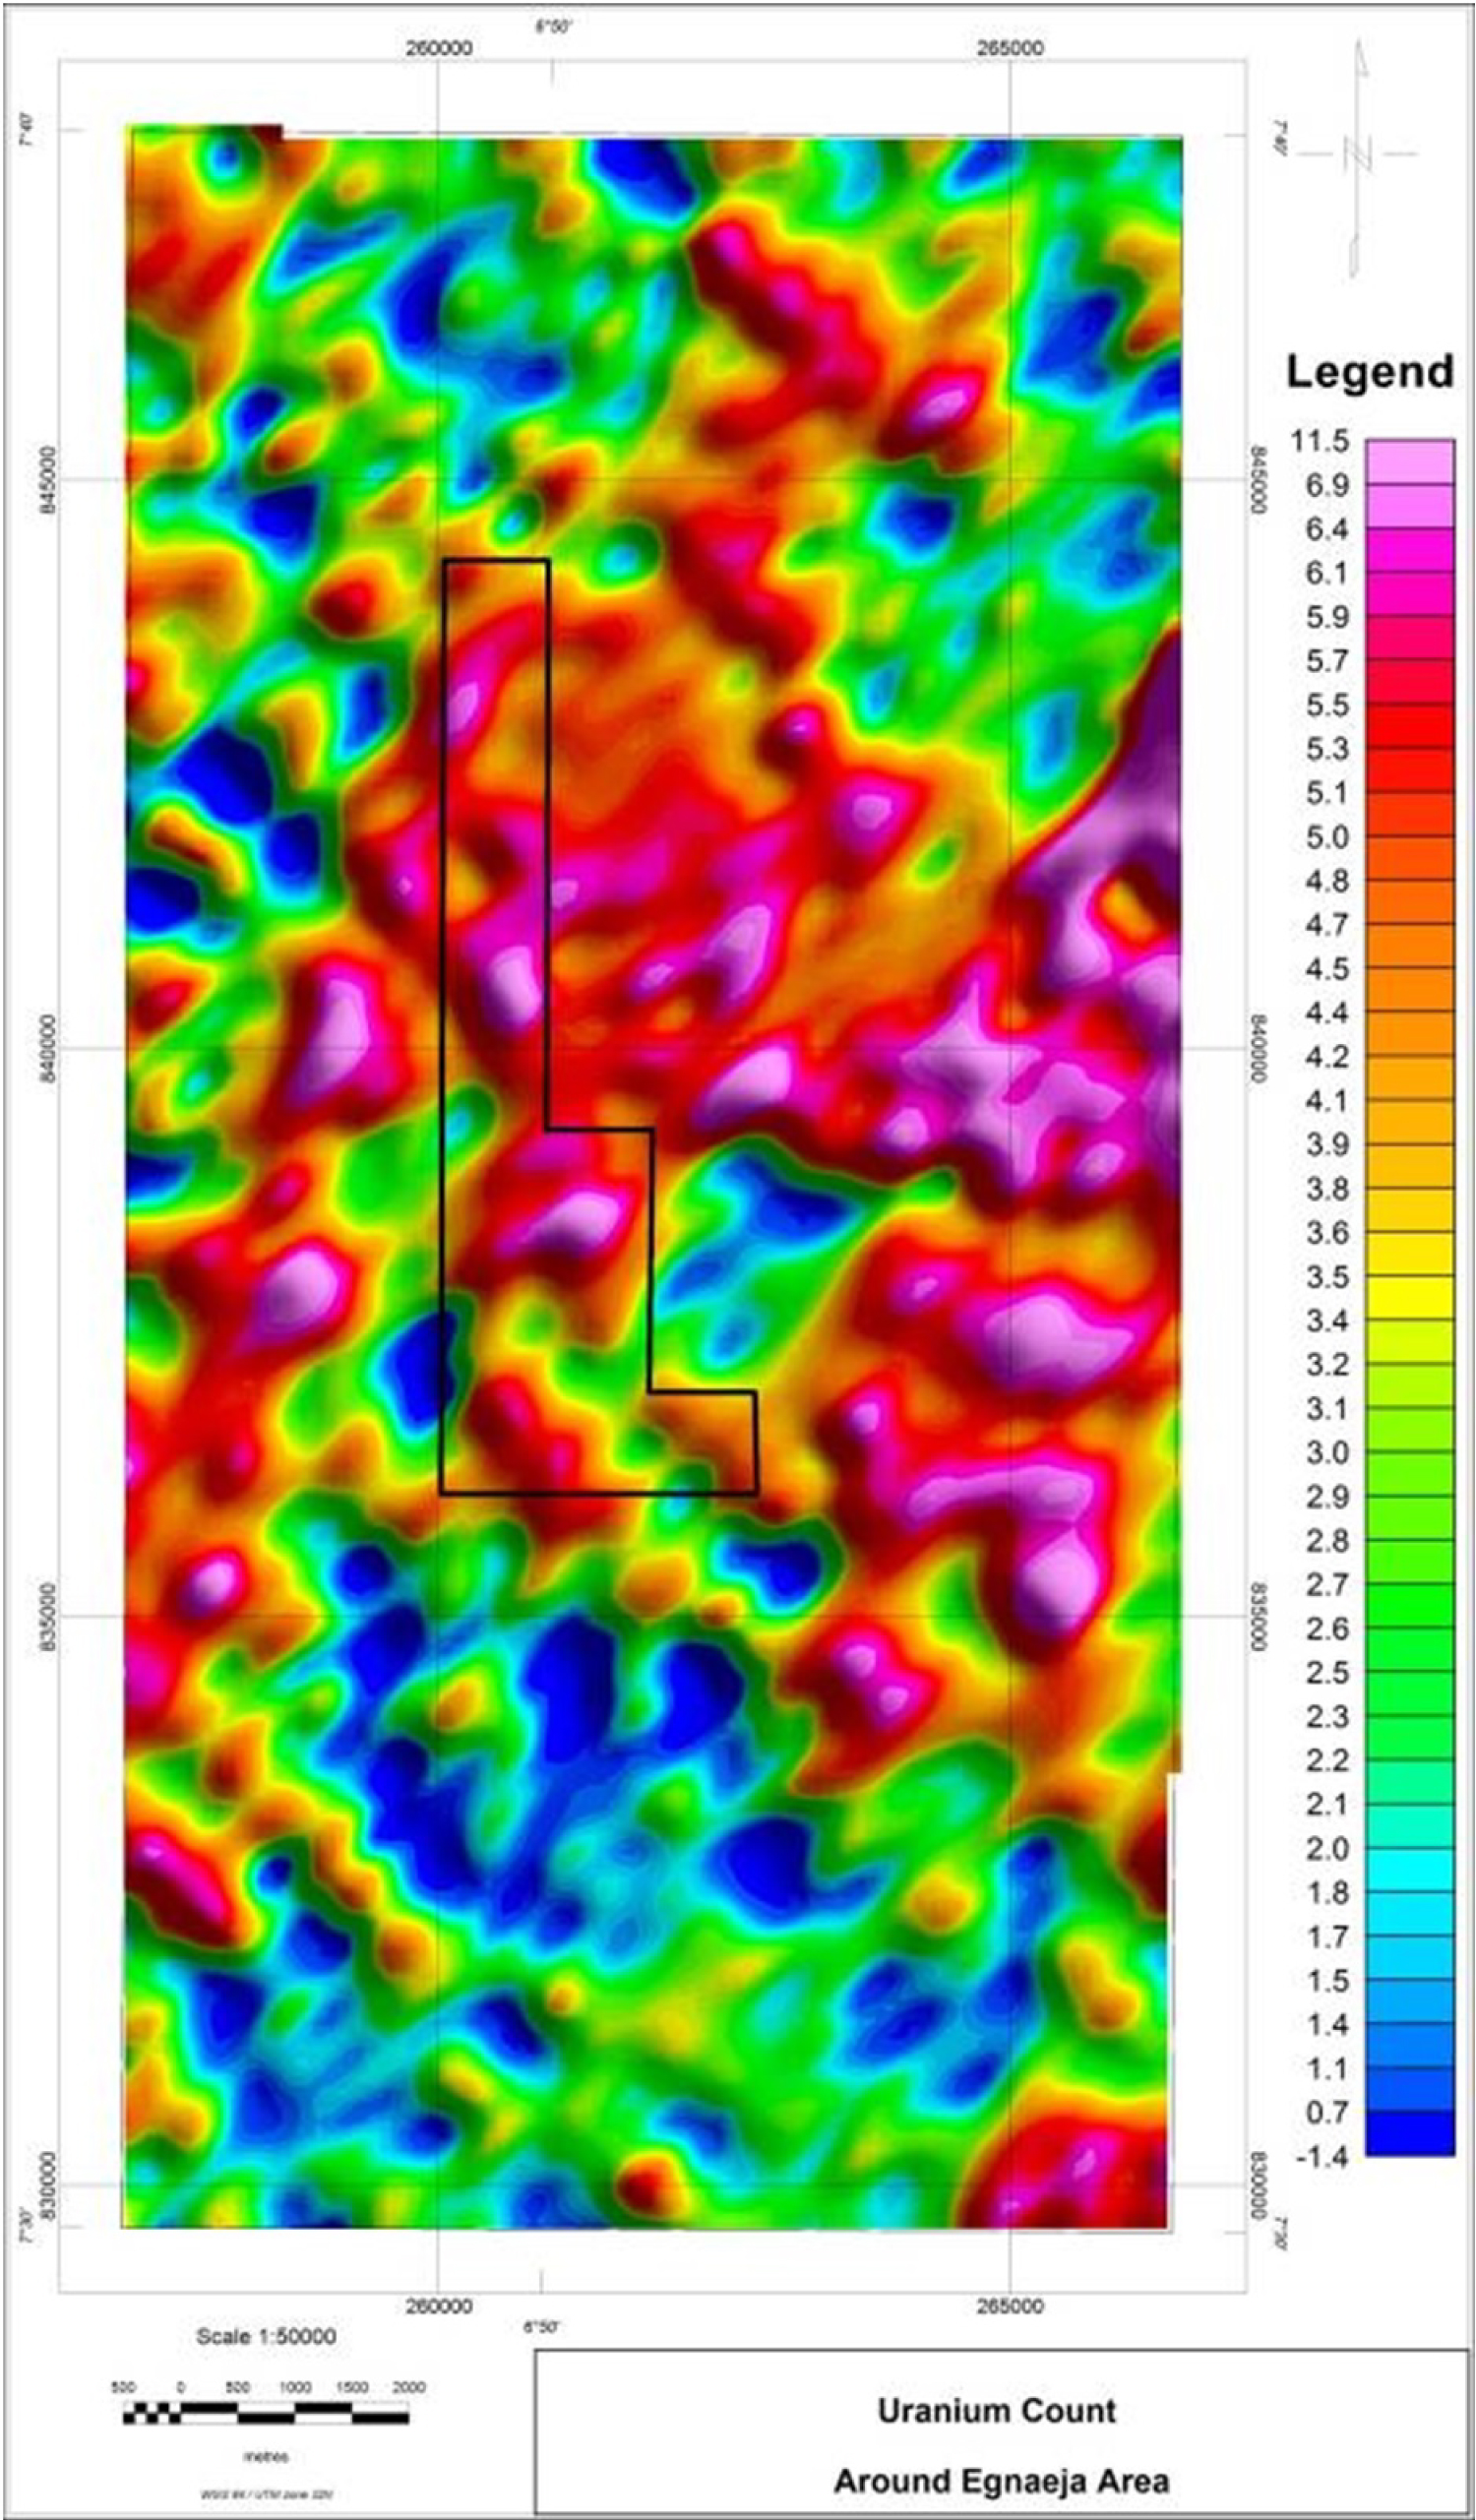
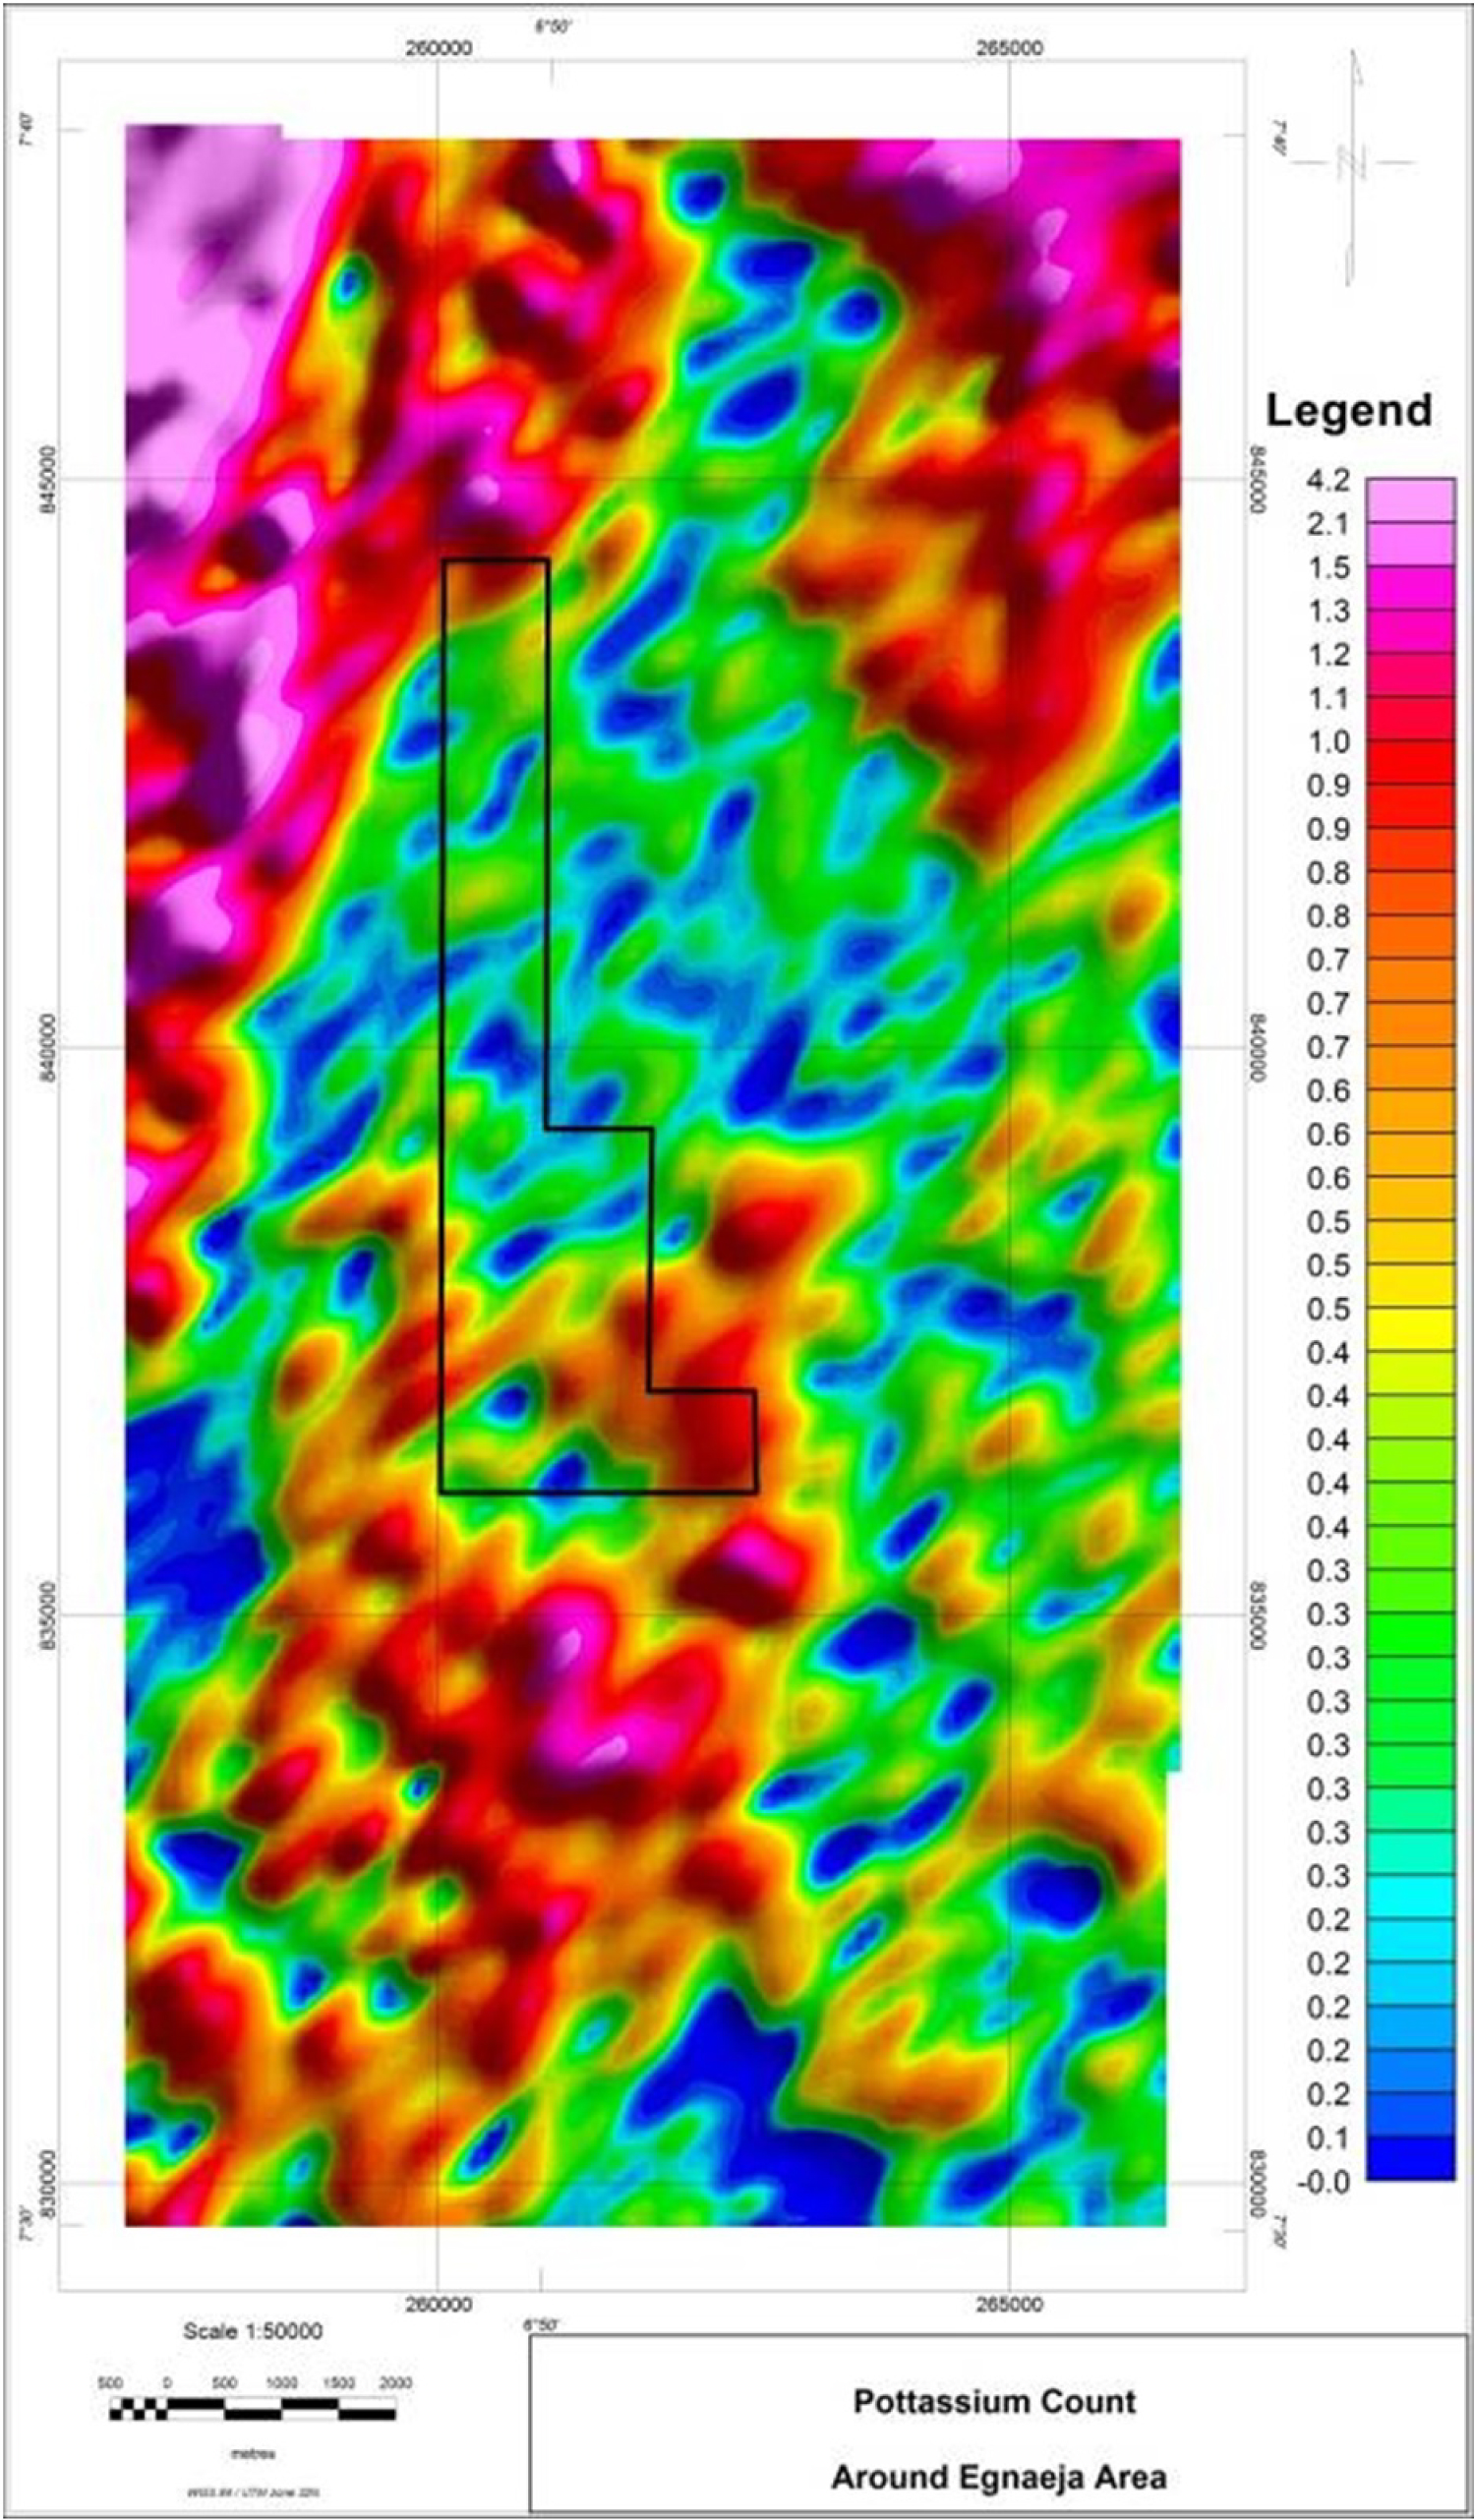
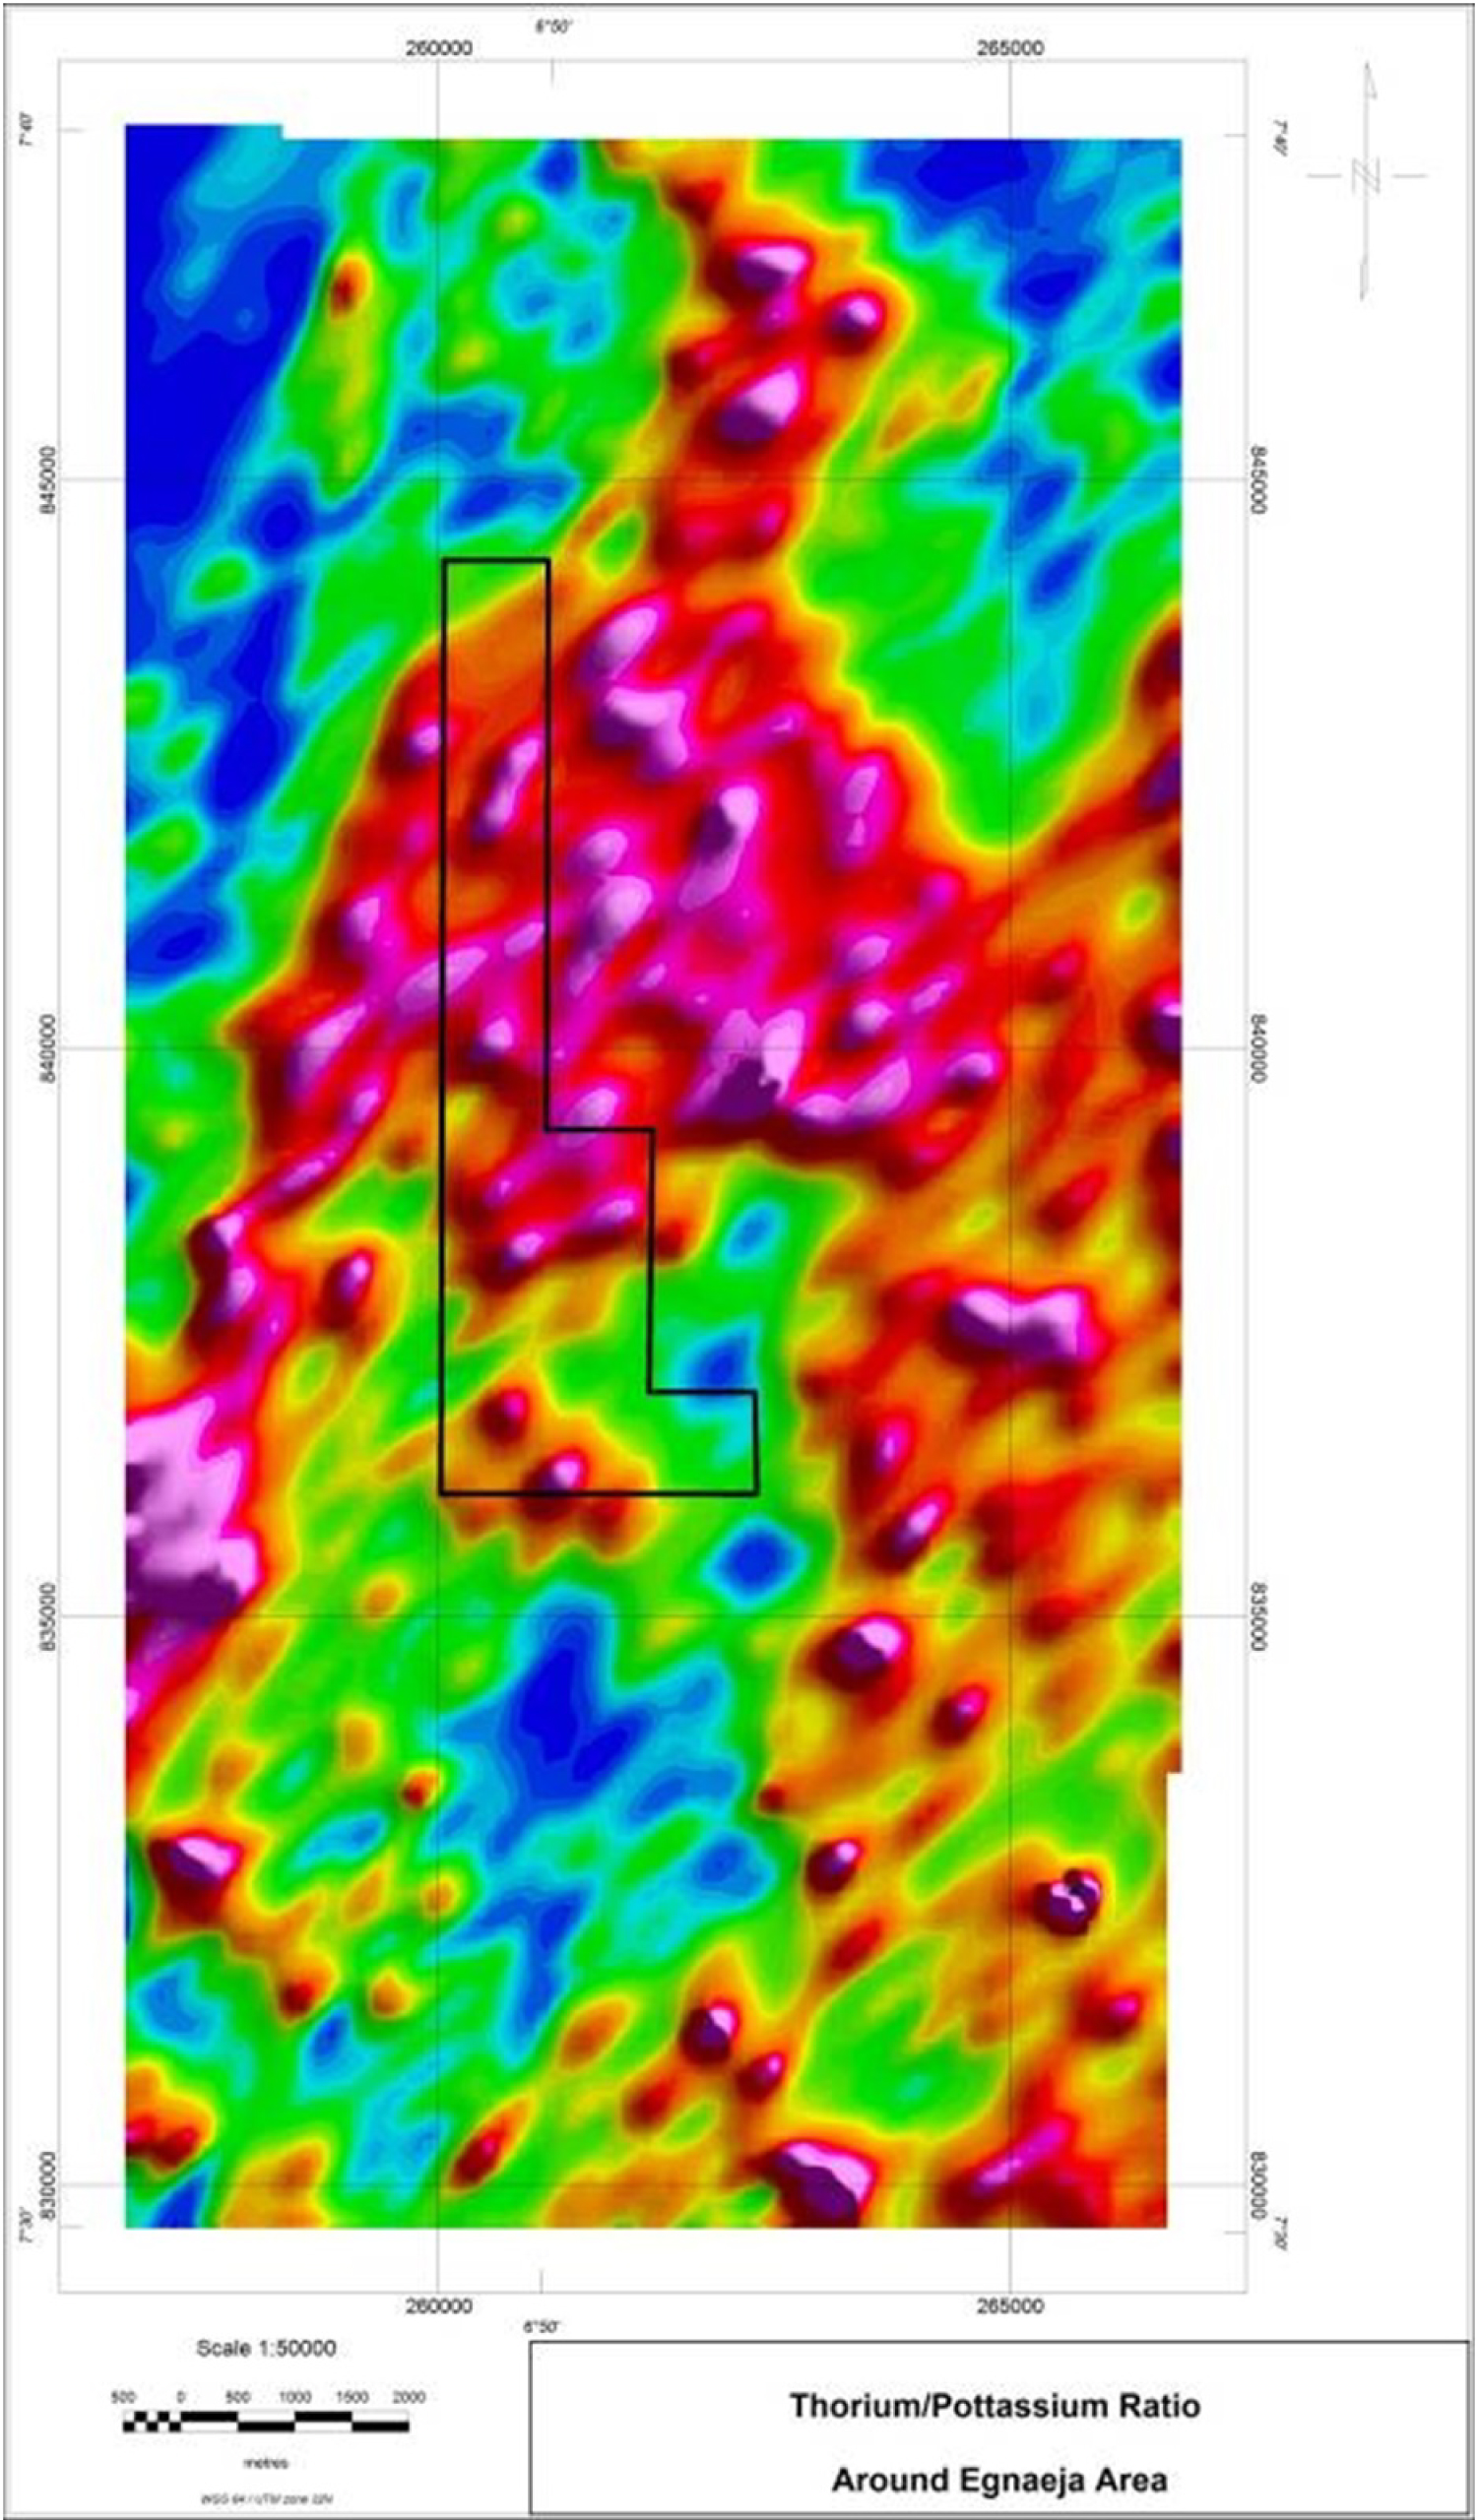
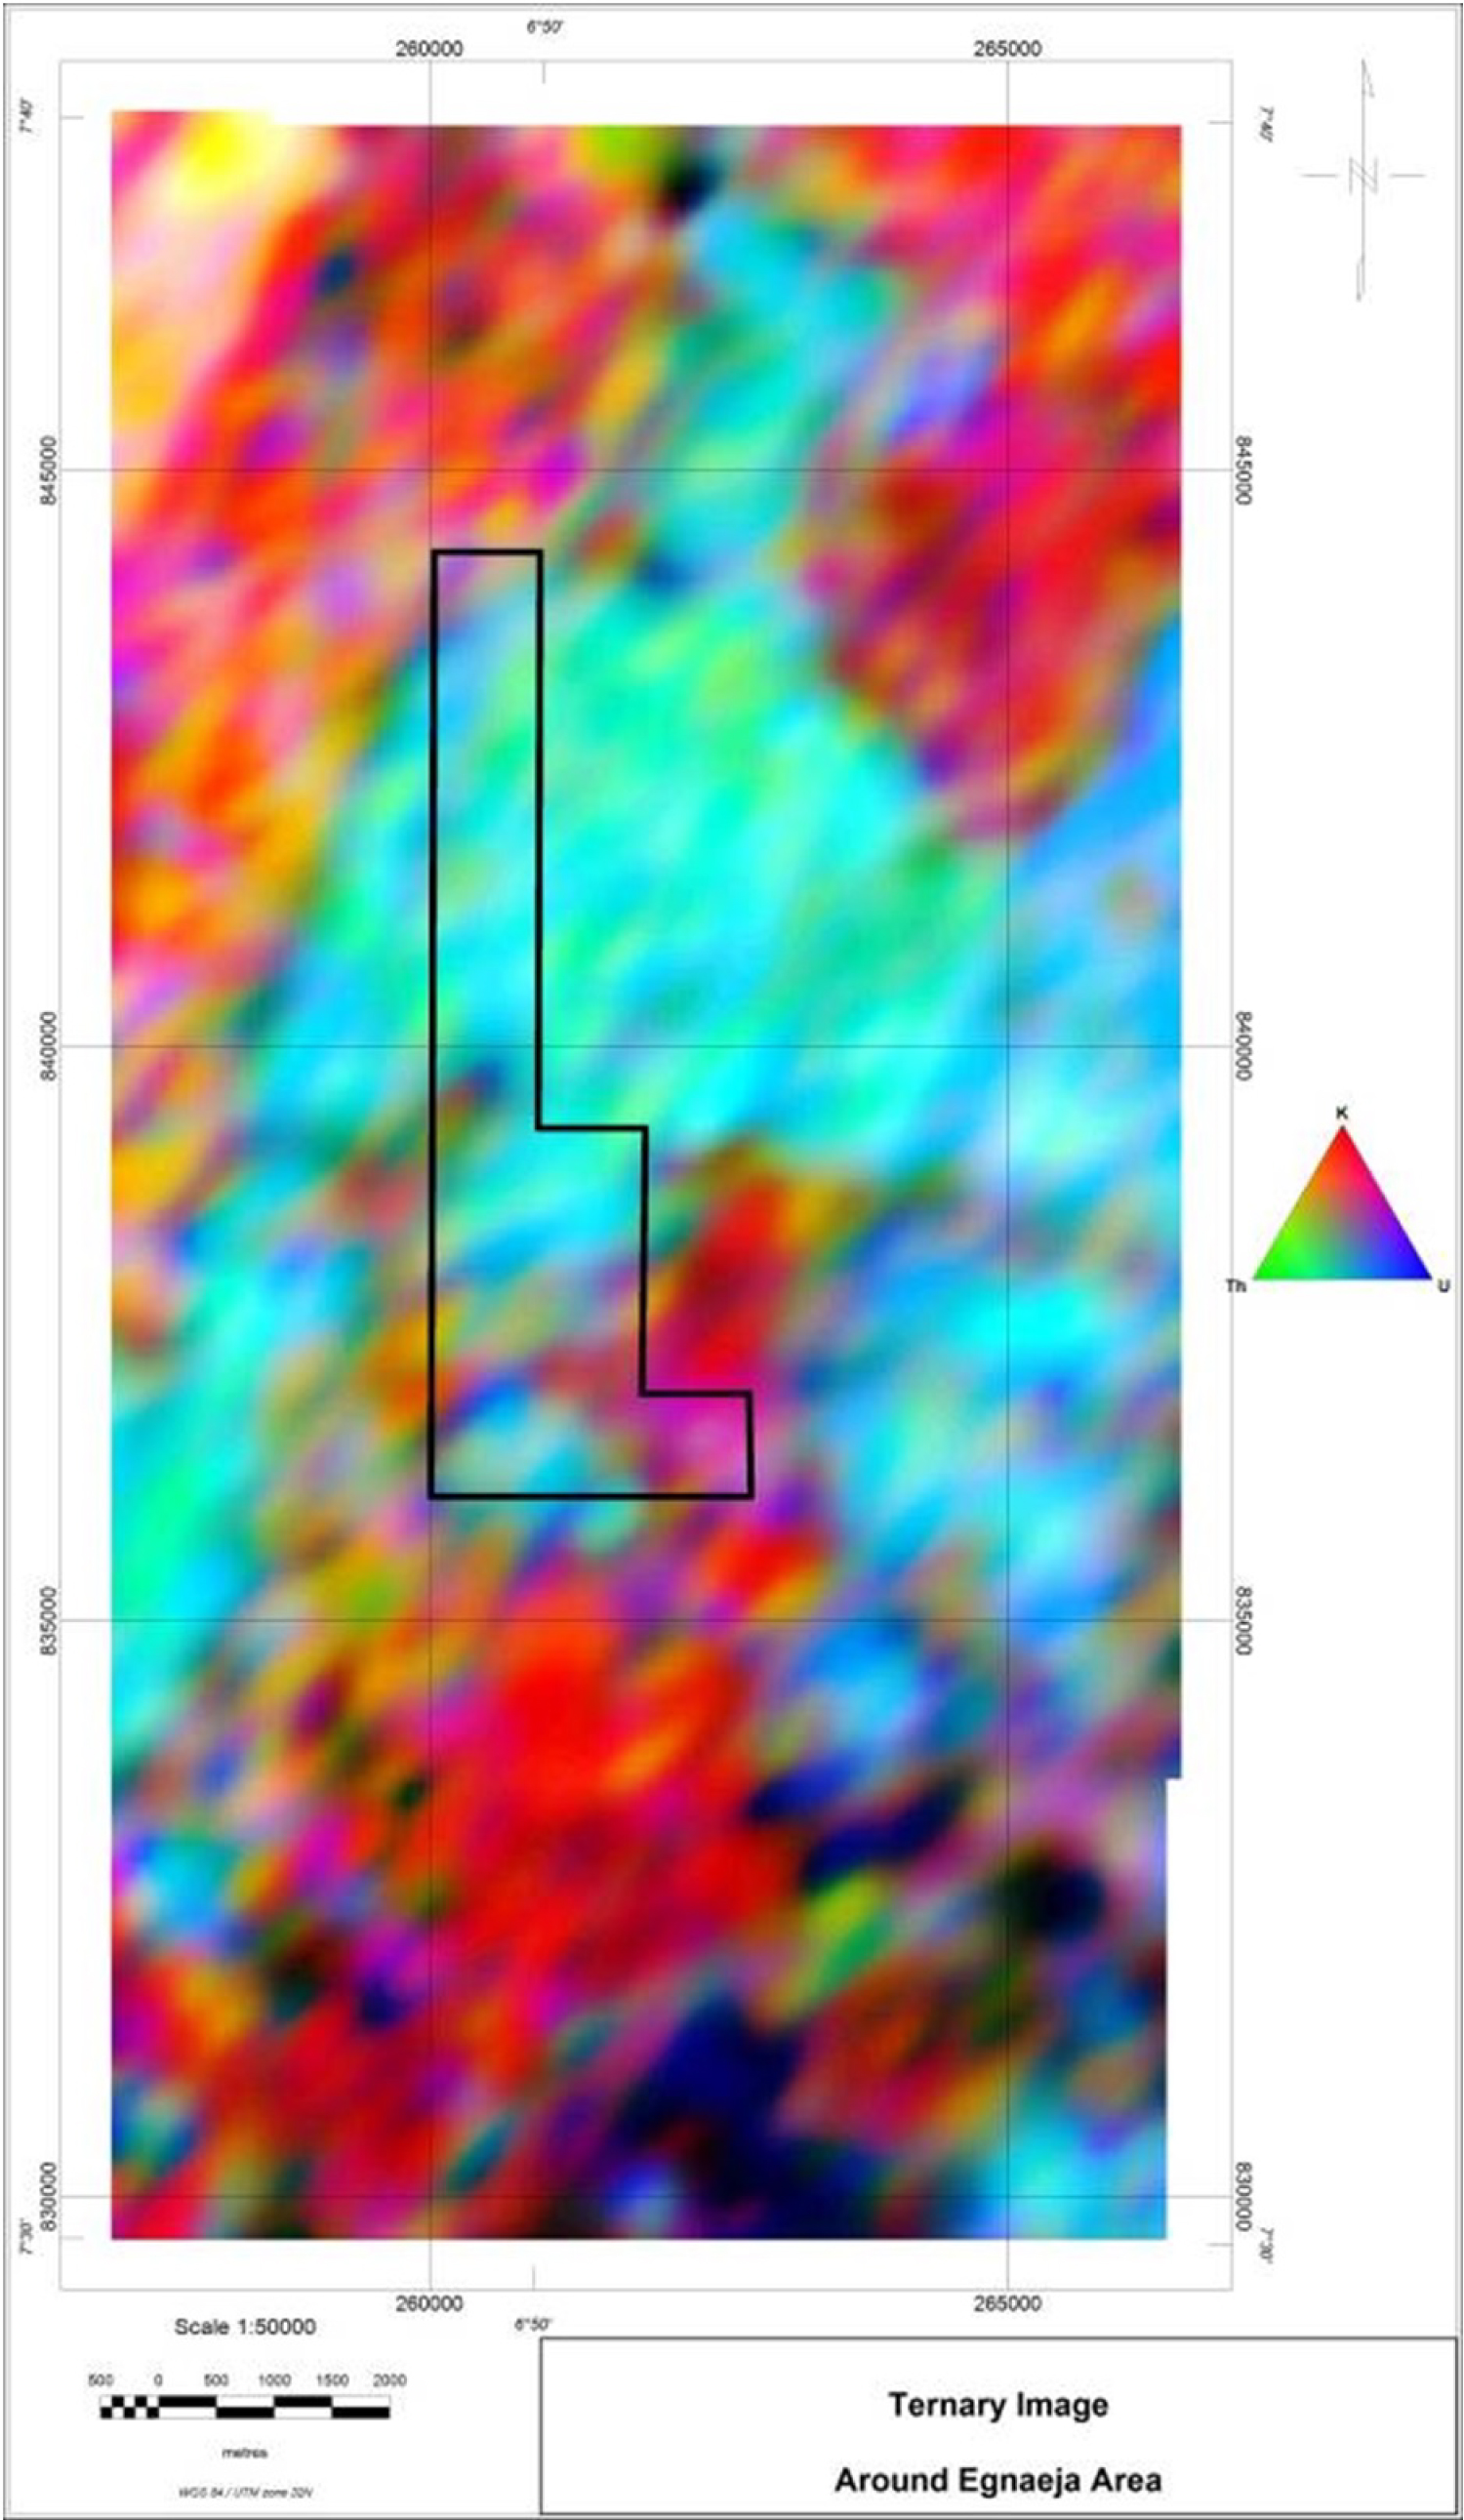
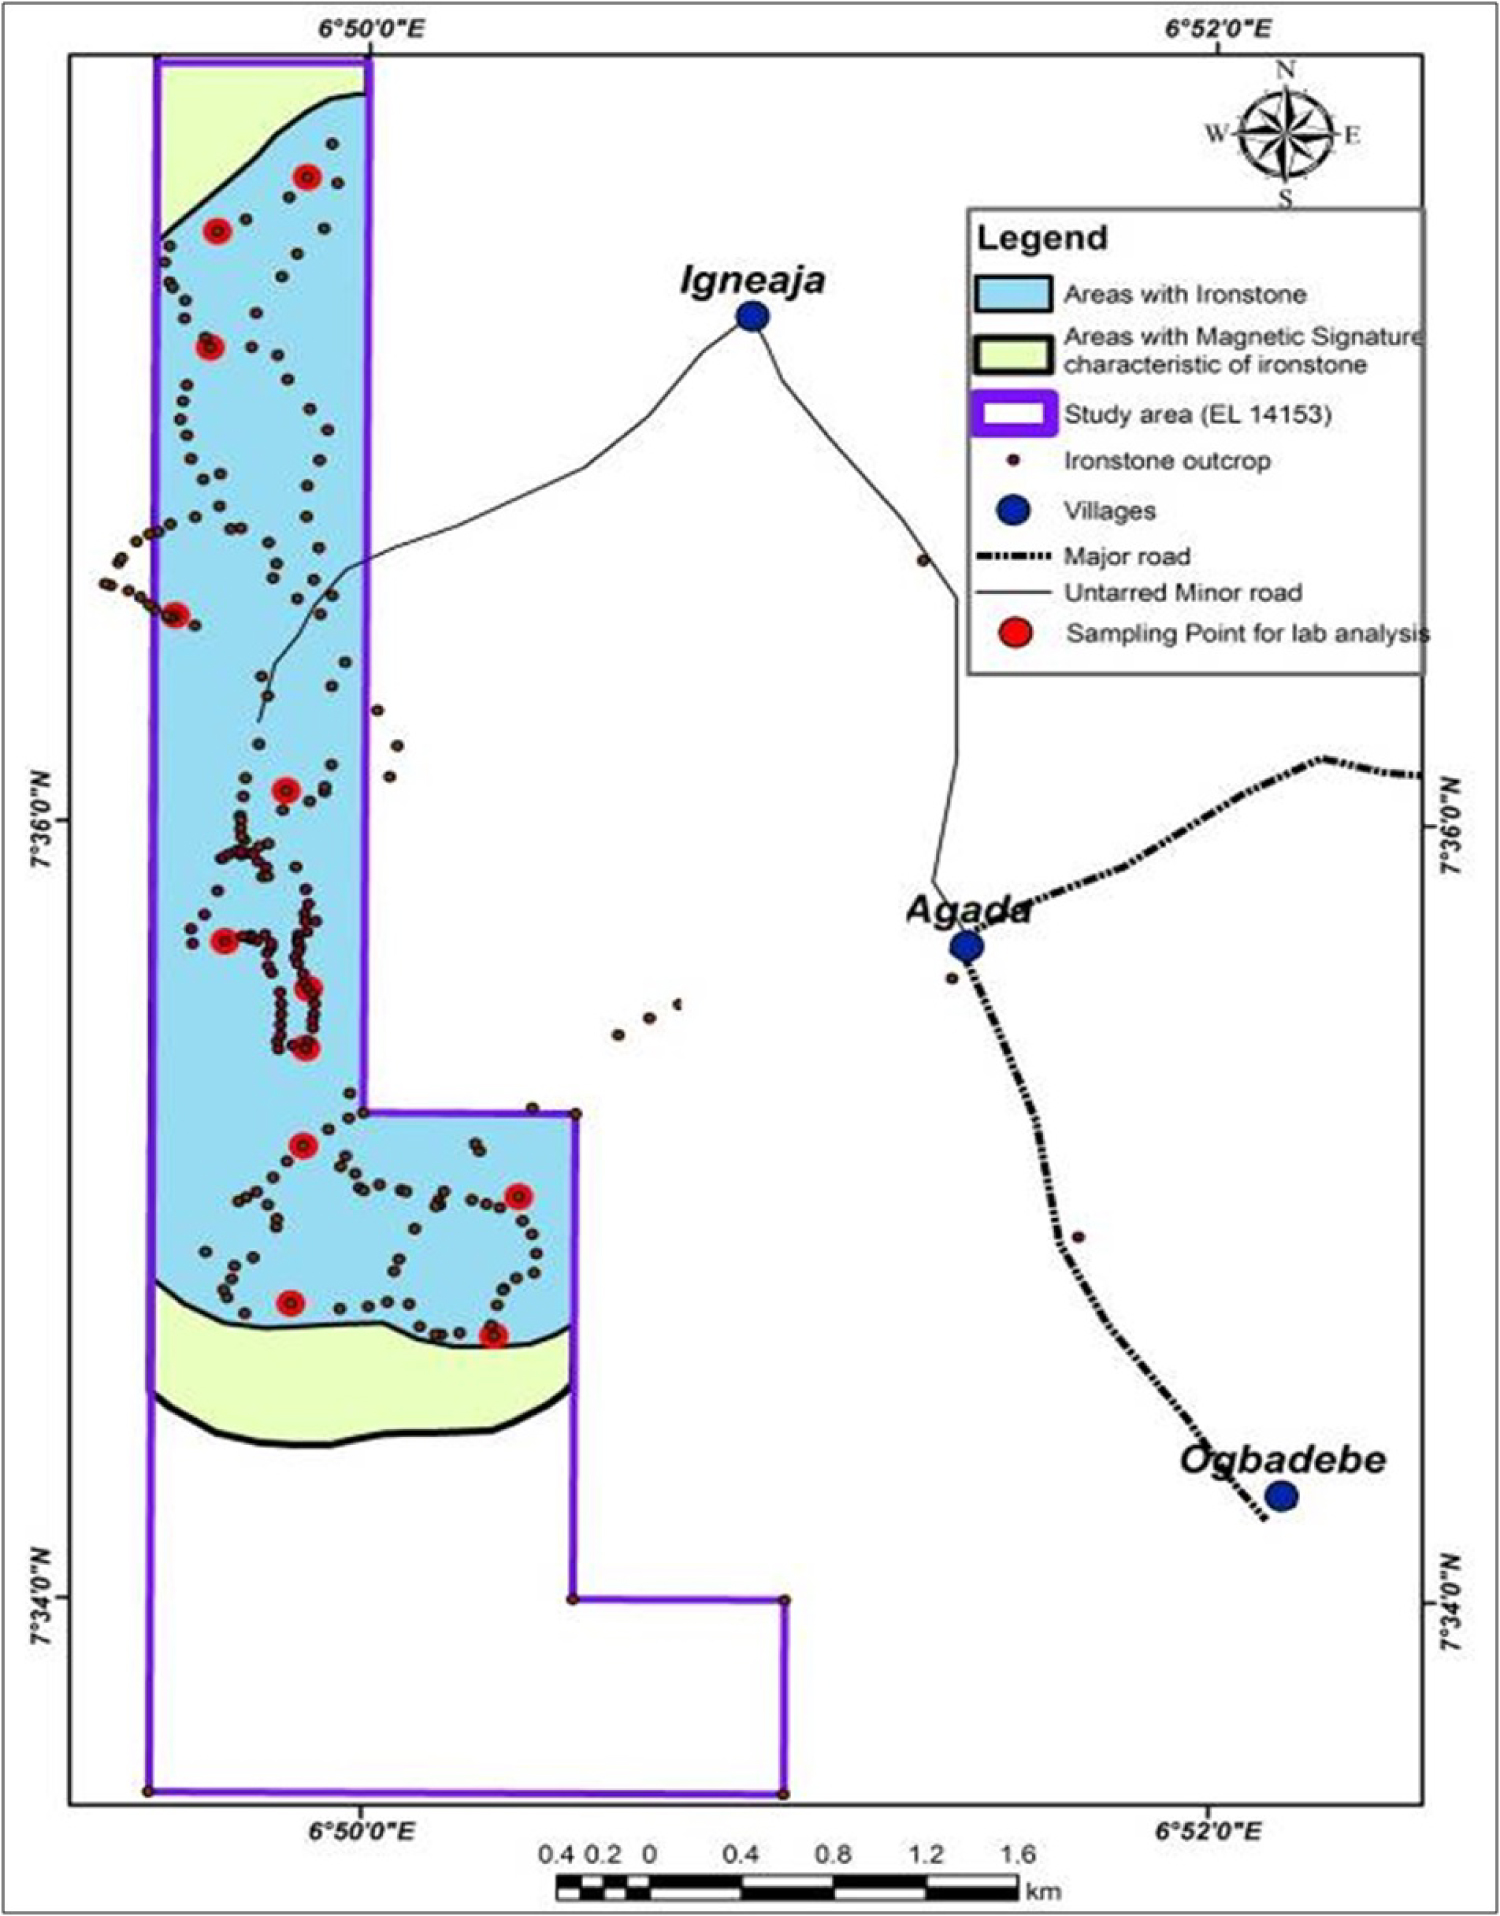
Figure 15: Ironstone occurrence map of the study area....
Ironstone occurrence map of the study area.
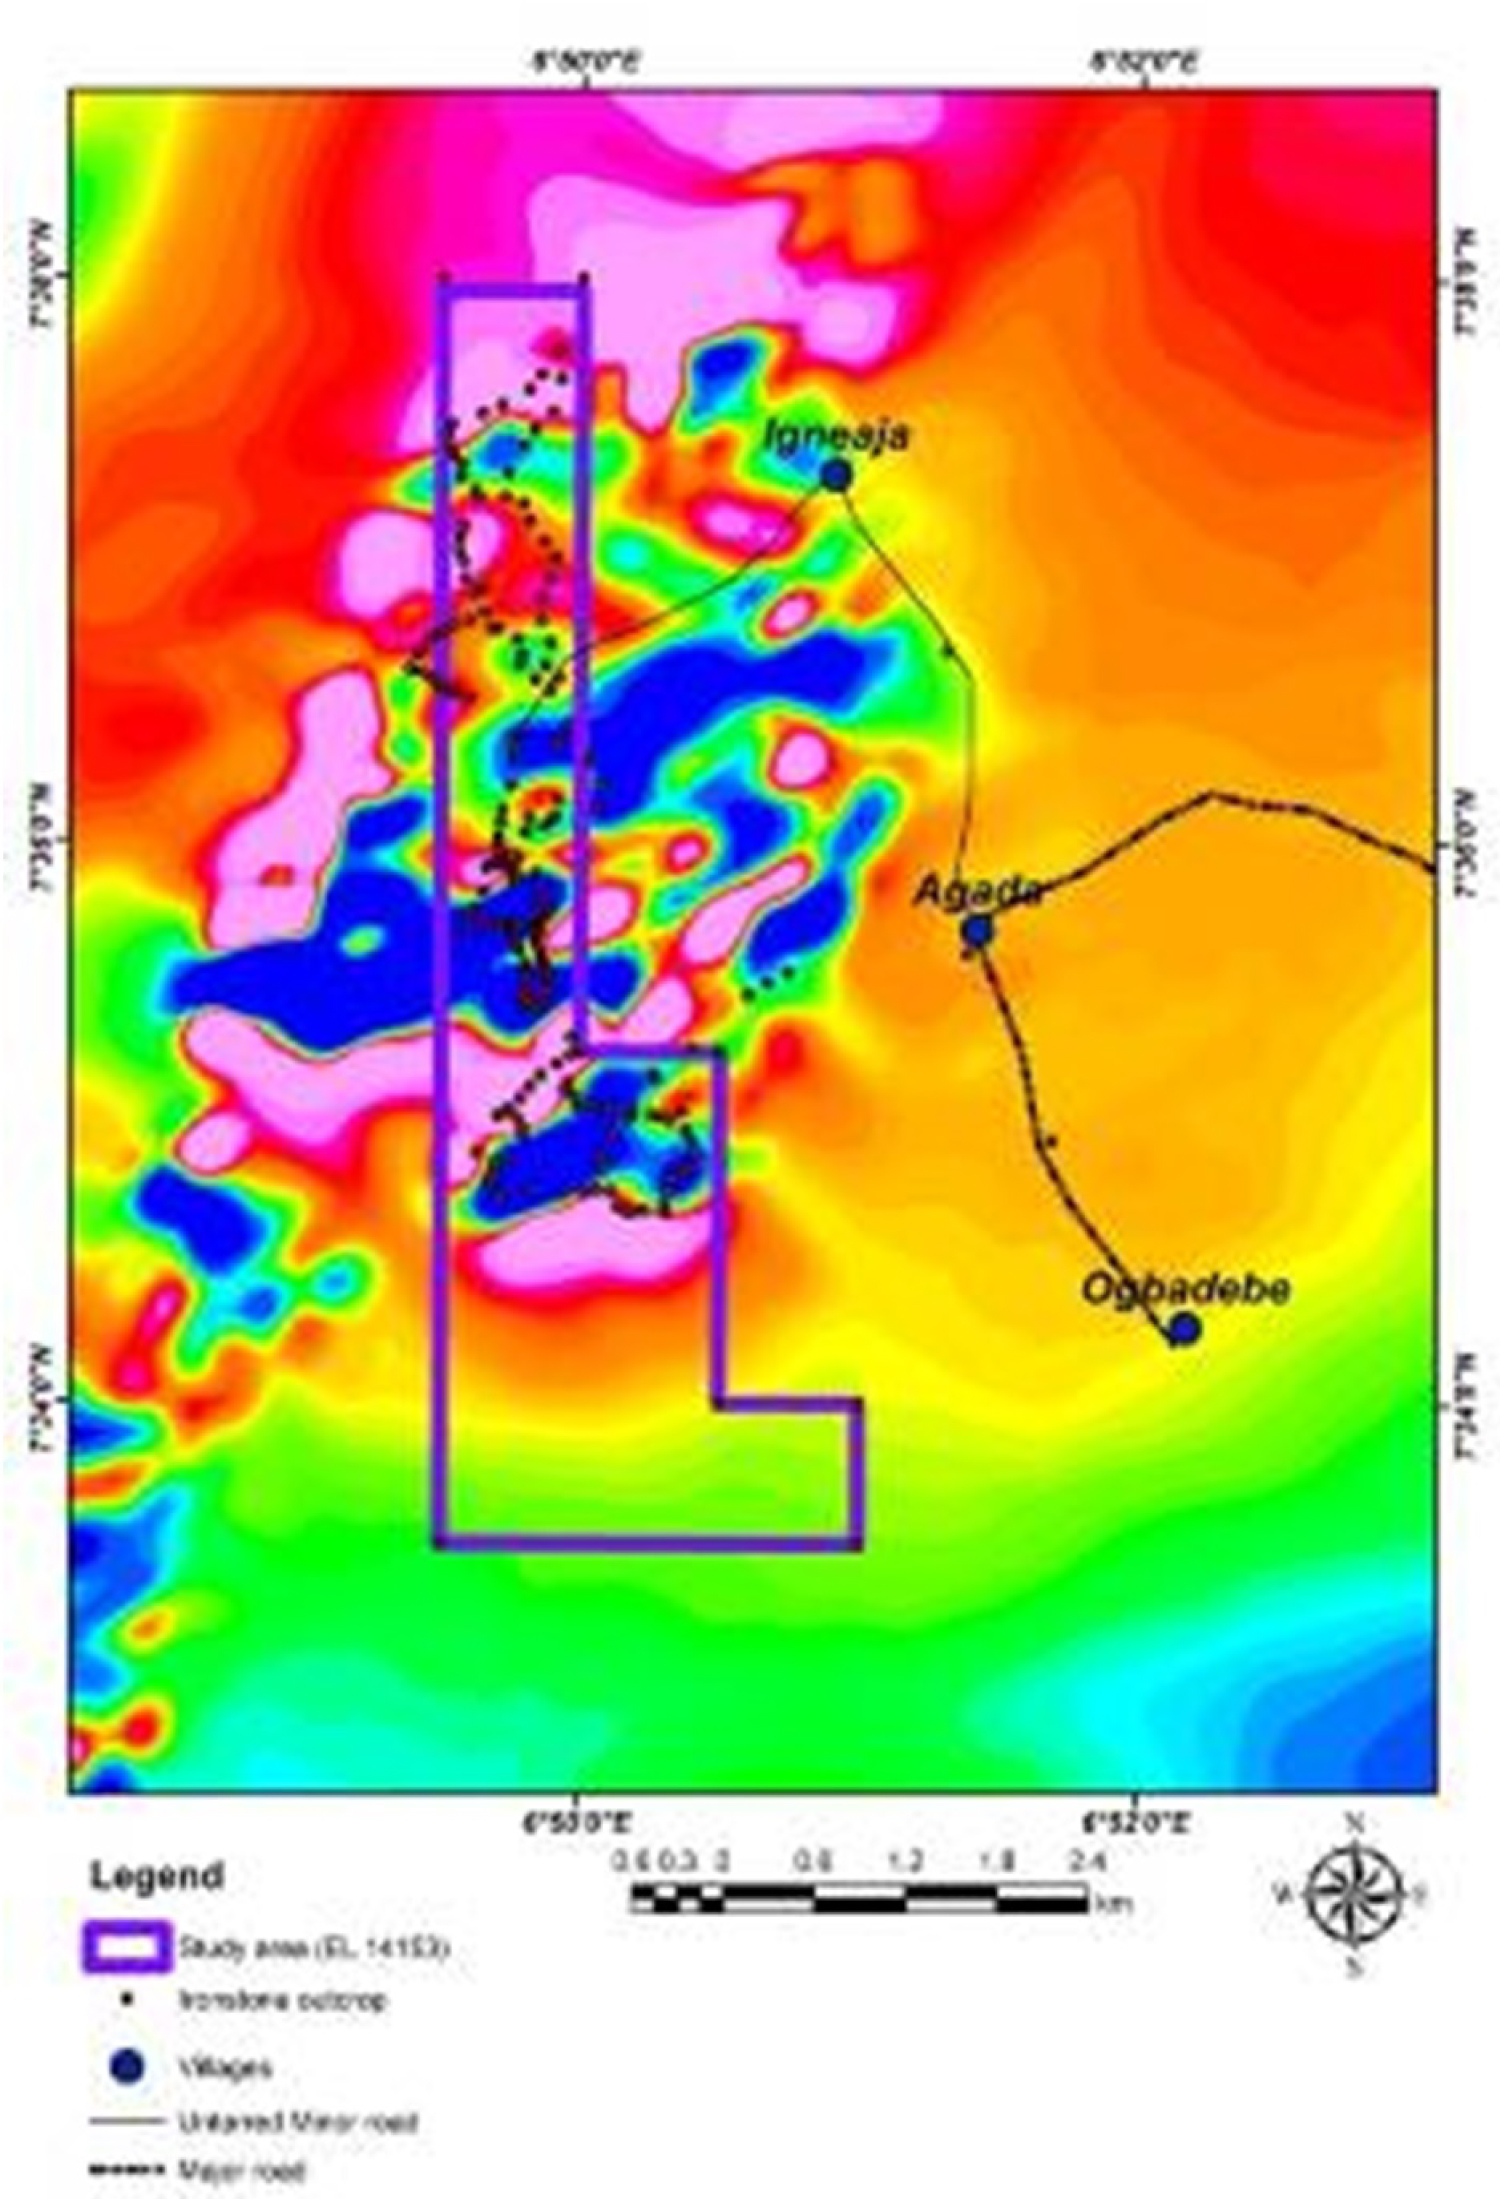
Figure 16: Ironstone outcrop map superimposed on the TMI....
Ironstone outcrop map superimposed on the TMI.
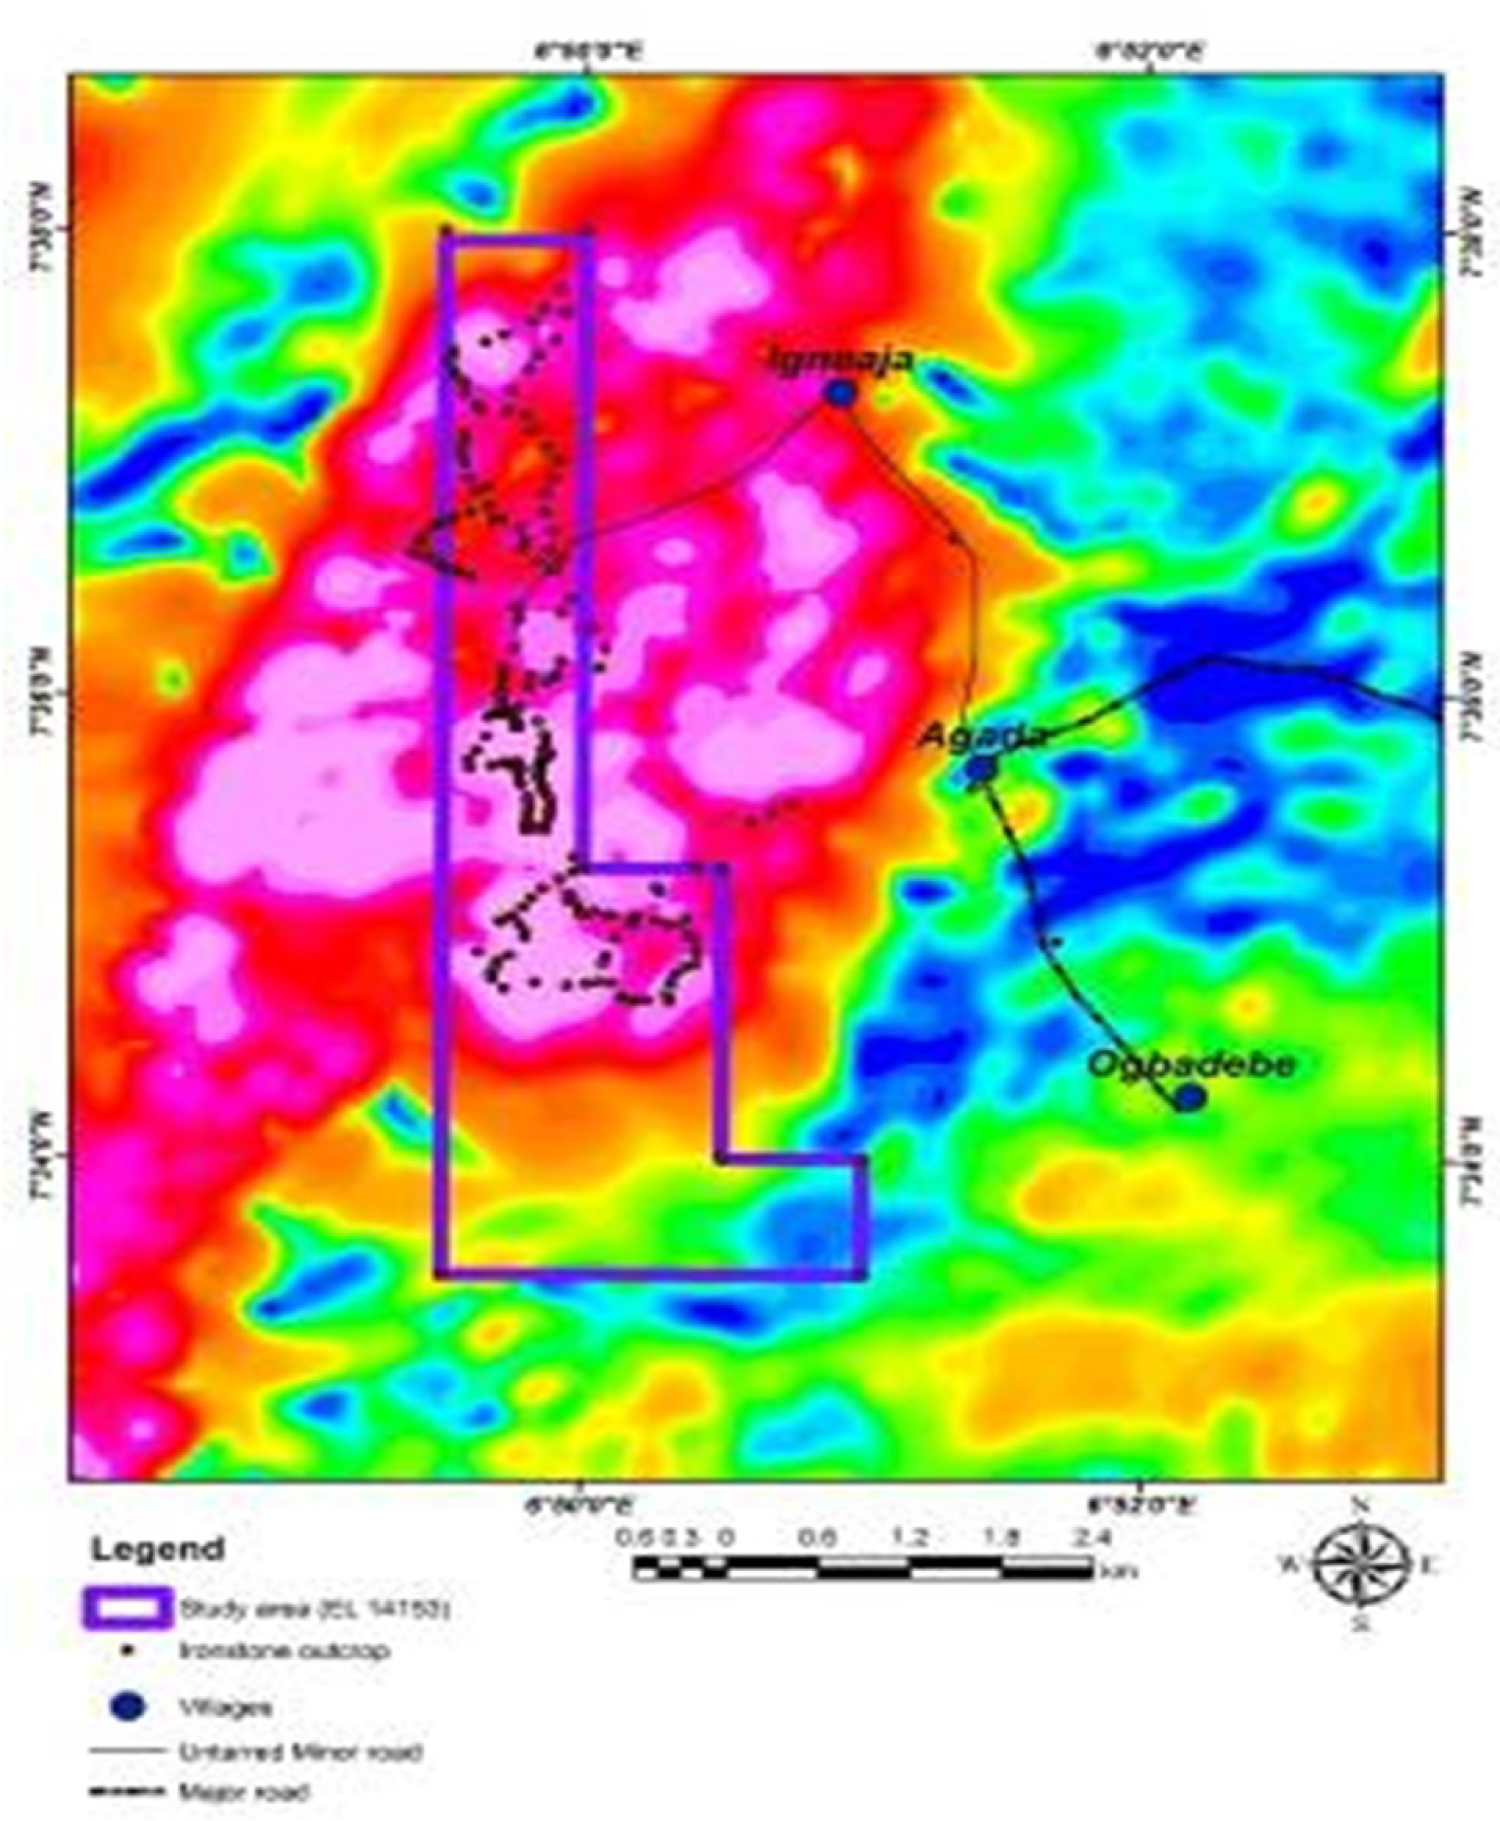
Figure 17: Ironstone outcrop map superimposed...
Ironstone outcrop map superimposed on the analytic signal map.
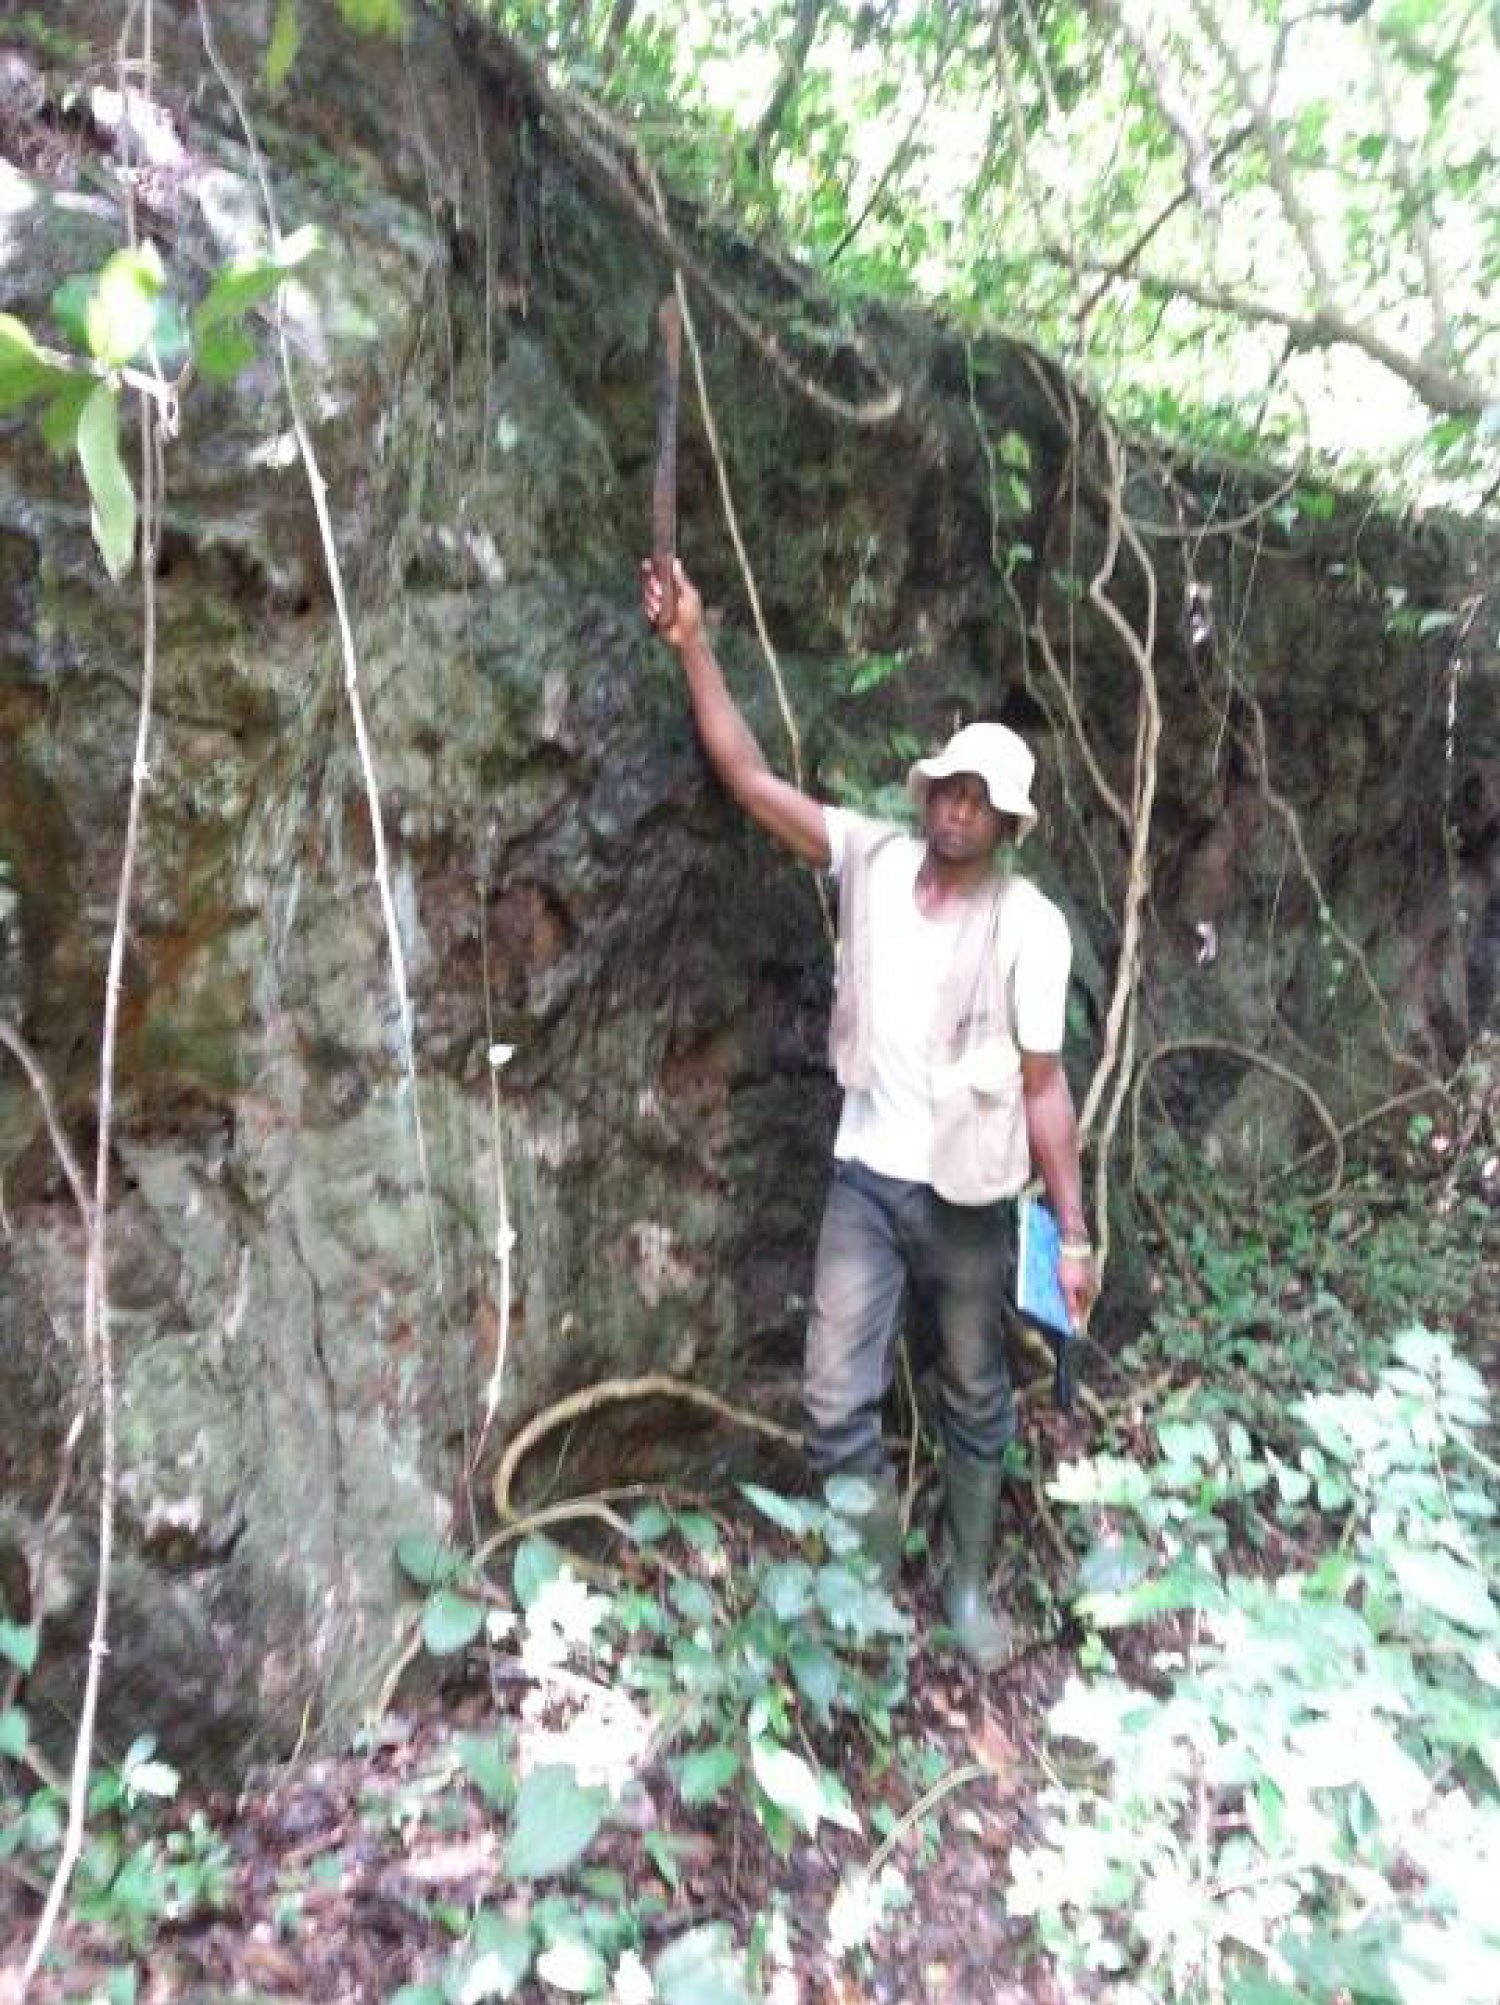
Plate 1: Ironstone outcrop encountered during...
Ironstone outcrop encountered during the field exercise.
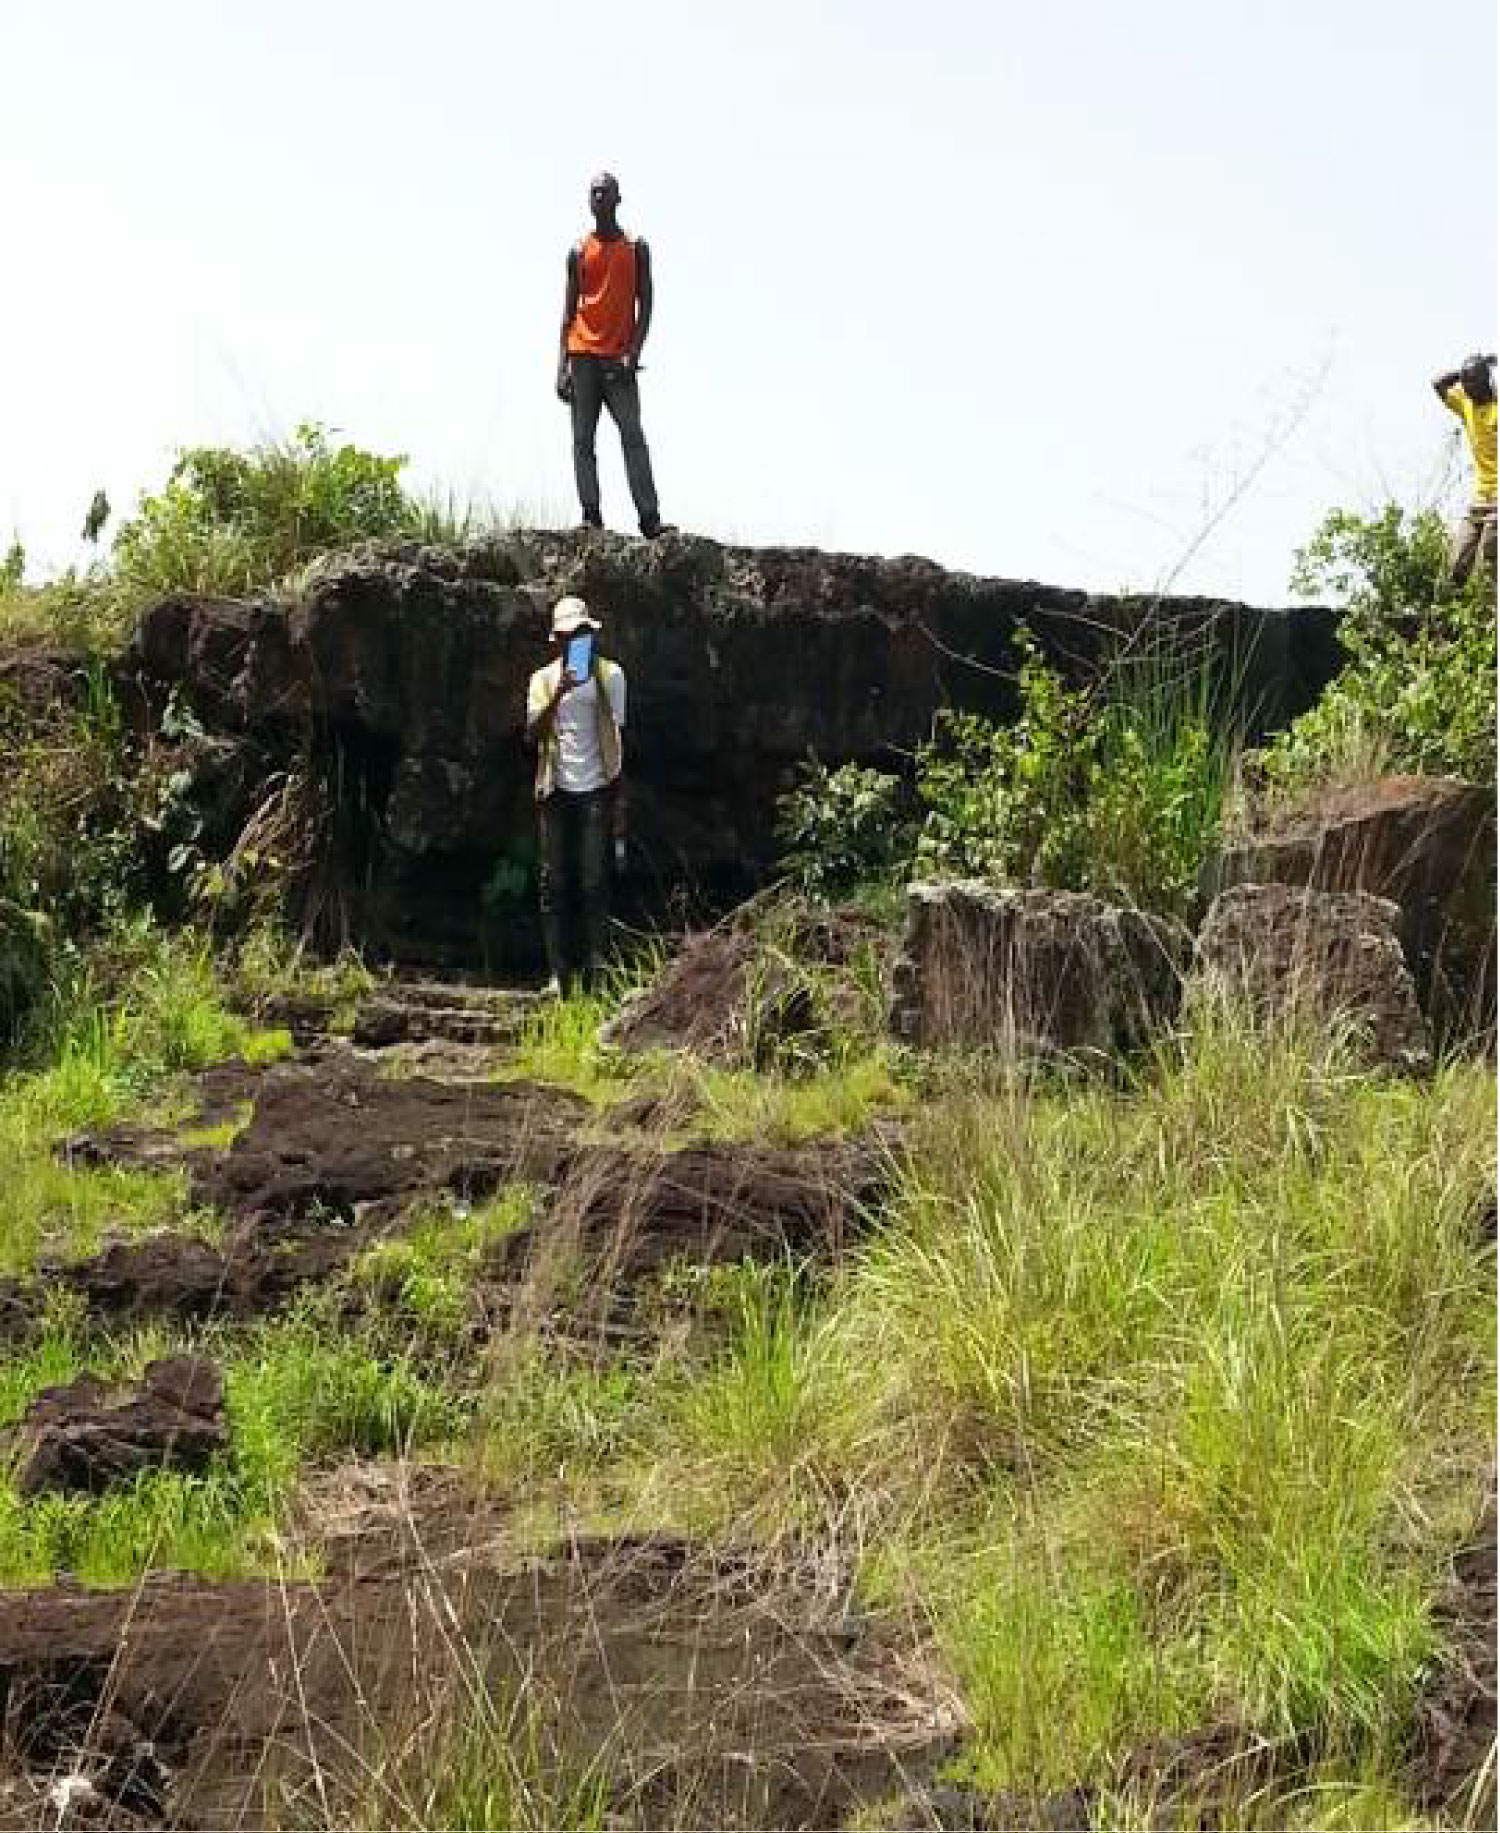
Plate 2: Ironstone outcrop encountered during...
Ironstone outcrop encountered during the field exercise.
Tables
References
- Gunn PJ, Maidment D, Milligan PR (1997) Interpreting aeromagnetic data in areas of limited outcrop. AGSO Journal of Australian Geology and Geophysics 17: 175-185.
- Gunn PJ (1993) The causes of magnetic responses in massive sulphide ore bodies and their horst rocks.
- Clark DA, Schmidt PW (1994) Magnetic properties and Magnetic signatures of BIFs of the Hamersley Basin and Yilgarn Block, Western Australia. In: MC Dentith, et al., Geophysical signatures of Western australian mineral deposits. Department of Geol. And Geophys., University of Western Australia, Australia, 343-354.
- Dickson BL, Scott KM (1997) Interpretation of aerial gamma-ray surveys-adding the geochemical factors. AGSO Journal of Australian Geology & Geophysics 17: 187-199.
- Uma KO, Onuoha KM (1997) Hydrodynamic flow and formation pressures in the Anambra Basin, Southern Nigeria. Hydrological Sciences-Journal-des Sciences Hydrologiques 42: 141-154.
- Ojo OJD, Kolawole AU, Samuel OA (2009) Depositional environments, organic richness, and petroleum generating potential of the campanian to maastrichtian enugu formation, Anambra Basin, Nigeria. The Pacific Journal of Science and Technology 10: 614-627.
- Ogala JE, Ola-Buraimo AO, Akaegbobi IM (2009) Palynological and paleoenvironmental study of the middle-upper Maestrichtian Mamu coal facies in Anambra Basin, Nigeria. World Applied Sciences Journal 7: 1566-1575.
- Ekine AS, Onuoha KM (2010) Seismic geo-history and differential inter-formational velocity analysis in the Anambra Basin, Nigeria. Earth Sci Res J 14: 88-99.
- Jauro A (2006) Organic geochemistry of coals from Benue Trough, Nigeria. A study visit report submitted to EAOG.
- Obaje NG, Attah DOS, Opeloye A, Moumouni A (2006) Geochemical evaluation of the hydrocarbon prospects of sedimentary basins in Northern Nigeria. Geochemical Journal 40: 227-243.
- Sonibare OO, Adedosu T, Ekundayo AO, Jarvie D (2008) Hydrocarbon potential and organic geochemistry of colas from Benue Trough, Nigeria. Journal of Applied Sciences Research 4: 1511-1518.
- Hockey RD, Sacchi R, Graaff WPF, Muotoh EOG (1986) The geology of Lokoja - Auchi Area, Explanation of 1:250,000 Sheet 62. Geological Survey of Nigeria.
- Jones HA, Hockey RD (1964) The geology of part of southwest Nigeria. Explanation of 1:250,000 Sheet 59 and 68. Geological Survey of Nigeria.
- Grant NK, Hickman MH, Burkholder FR, Powell JL (1972) Kibarian Metamorphic belt in the Pan-African domain of West Africa. Nature (London) Phys Sc 238: 90-91.
- Clark DA (1997) Magnetic petrology aid to geological interpretation of magnetic data. Journal of Australian Geology & Geophysics 17: 83-103.
- Luyendyk APJ (1997) Processing of airborne magnetic data. Journal of Australian Geology & Geophysics 17: 31-38.
- Kogbe CA (1975) Geology of Nigeria. University of Ile-Ife, Elizabethan Publishing Co., Lagos, Nigeria, 273.
Author Details
Adejuwon B Bukola1, Ibeneme Sabinus I2*, Osizemete AG3, Obioha Young E2 and Abba AU1
1Nigerian Geological Survey Agency, Nigeria
2Department of Geology, Federal University of Technology Owerri, Nigeria
3Elgeoopes Energy Resources Limited, Nigeria
Corresponding author
Ibeneme Sabinus I, Department of Geology, Federal University of Technology Owerri, Nigeria, Tel: +234(0)8026182505
Accepted: August 26, 2020 | Published Online: August 28, 2020
Citation: Bukola AB, Ibeneme SI, Osizemete AG, Obioha YE, Abba AU (2020) Quality Assessment and Reserve Estimation of the Egnaeja Iron Ore Deposit, North-Central Nigeria using Integrated Approach. Int J Earth Sci Geophys 6:037
Copyright: © 2020 Bukola AB, et al. This is an open-access article distributed under the terms of the Creative Commons Attribution License, which permits unrestricted use, distribution, and reproduction in any medium, provided the original author and source are credited.
Abstract
Field, Geochemical and Airborne Geophysical data were integrated in mapping the iron ore deposit around Egnaeja and environs. This research aimed at providing detail geological information that would help in the exploitation of the iron ore deposit in the area through the identification of its precise location, determination of its quality and estimation of its probable reserve. From the aeromagnetic data, strong magnetic signatures that are associated with Iron ore mineralization are well-spread within the study area. The SPI depth estimate to the magnetic sources in the area varies between 20 and 100 m. Areas with high magnetic intensity were observed to have high Thorium (Th) and Uranium (U) counts but low Potassium (K) count. Detailed geological mapping carried out indicates that pisolitic and oolithic ironstones outcrop in more than two-thirds of the study area. From field observation, the thickness of the deposits varied between 2 and 16 m with an average of 9 m while the specific gravity varies from 3.13 to 3.97 with an average of 3.54. The overburden thickness varies from 0 to 10m indicating a high possibility of near-surface exploitation of this resource at a profit. Geochemical analyses of twelve representative samples from the study area reported that the percentage of Iron oxide (Fe2O3) in the samples ranges from 89.83 to 96.91% with an average of 93.04% while the phosphorus content varies from 0.53% to 1.75% with an average of 1.208% indicating high-grade iron ore deposit. An inferred reserve estimate of about 250 million tons of mineable ironstone deposit was calculated for the area. Although this inferred reserve of mineable iron ore deposit is quite encouraging, core drilling is recommended to inform adequate modelling of the reserve to make assurance a double sure prior to exploitation.
Keywords
Aeromagnetic aata, Egnaeja, Geochemistry, Ironstone, Mineralization, Reserve estimation
Introduction
Iron ores, which are normally found in the form of hematite, magnetite, limonite, goethite or siderite, are rocks and minerals from which metallic iron can be extracted at a profit. The ores are usually rich in iron oxides and vary in colour from dark grey, bright yellow, deep purple, to rusty red.
Exploration for iron ore based on its magnetic effects represents the earliest use of geophysics in mineral exploration [1]. Magnetic surveys to locate iron ore were carried out in Sweden as early as the middle of the seventeenth century. Magnetic surveying has played a major role in the delineation of iron ore deposits [2].
Field Geological mapping brings geologists and geophysicists very close to rocks. Just as the saying goes that the best geologist/geophysicist is one that has seen the highest number of rocks, fieldwork becomes an indispensable aspect of geological study.
Geochemical study has been as old as geology itself. This method reveals the chemical composition of rocks brought from the field and gives information on the various geochemical facies of a given rock unit which helps in its accurate classification.
The magnetic signature observed within the vicinity of iron ore deposit depends, in no small measure, on the form of mineralization (whether magnetite or hematite) therein. The majority of the world's iron production comes from ores in Banded Iron Formation (BIF). Such a geological environment gives rise to extremely large and complex magnetic anomalies. The BIF is strongly magnetic whereas the hematite ore has a minor magnetic response.
The interpretation of data collected from such areas is complicated by the magnitude of the anomalies, which may be significant relative to the geomagnetic field where significant magnetite is present, the presence of strong remanent magnetization, demagnetization, and the markedly anisotropic nature of the magnetic properties of the BIFs [3].
The ores themselves form by supergene enrichment of BIF with magnetite being altered to hematite. The ore appears as zones of reduced magnetic intensity within the magnetic BIF horizons. However, this signature is not diagnostic and many similar but unmineralized 'lows' may occur. Since mineralization processes can also affect the radioelement contents of rocks, radiometric data become another useful tool in the identification of potential iron ore mineralization [4].
This study aims at providing detail geological information of the study area that would help in preparing a realistic plan for the exploitation of any available mineral resources in the study area with special reference to iron ore as well as determining the quality and estimating the probable reserve of the ore body.
Location, accessibility, and topography of the study area
The study area is located near Egnaeja village, Kogi state, North-central Nigeria (Figure 1). The actual area of interest with an approximate area extent of 11 km2 (54 cadastral units) is accessible through an un-tarred road via Agada-Egnaeja road (Figure 2). Also, accessibility within the study area is though available footpaths. The study area is an upland area with an elevation ranging between 300 m and 540 m (Figure 3).
Geology of the Study Area
Review of the geology of Anambra Basin
The study area is located in the horseshoe-shaped Anambra Basin which covers an area of about 40,000 km2 and opens up to the south-westward into the tertiary Niger Delta Basin (Figure 4 and Figure 5). It mainly consists of cyclic clastic sequences of sandstones, siltstones, mudstones, and sandy shales with interbedded coal seams.
The Anambra Basin has always attracted interest from both the scientific and commercial communities due to its coal and gas-bearing potential. Several studies have been conducted in the basin concentrating on basin fluid dynamics [5], depositional environments [6], palynological sequences [7], seismic geo-history [8], hydrocarbon potentials and geochemistry of coals [9-11].
Iron ore occurrence in Nigeria
According to Hockey, et al. [12], two broad types of iron ore occur prominently in Nigeria. They are: i. Banded Iron Formation (BIF) which occurs in folded bands and lenses associated with the Precambrian meta-sedimentary schist belts prominently outcropping in the western half of the country. The Banded Iron Formation of Nigeria generally occurs in metamorphosed folded bands, associated with Precambrian Basement Complex rocks which include low-grade meta-sediments, high-grade schist, gneisses, and migmatites [13]. Three main facies have been identified: They are the oxide, silicate, and sulphide facies.
ii. The Cretaceous sedimentary (oolitic) iron deposits occur prominently around Agbaja, Kotonkarfi, Nsude areas in the North Central and South-eastern zones of the country respectively. Although they are described as sedimentary, they are partly lateritic in character. The oolitic ironstone deposits are composed mainly of iron oxides and hydroxides especially limonite and maghemite, which follow a concentric structure in the ooliths. There are also hematite and goethite as siderite and gibbsite occurrences are quite rare.
Localized geology of the study area
The study area falls within the Lokoja-Bassange Formation which is thought to be the equivalent of the Nkporo shales as defined along the eastern border of the Anambra Basin, as both are overlain by the lower coal measures [12]. Rocks in the area had regionally been described in the past by previous workers such as Jones and Hockey [13], Grant, et al. [14], and Hockey, et al. [12].
The Lokoja-Bassange Formation overlies the basement unconformably with a coarse to gritty, locally conglomeratic angular sandstone. The series is a shallow water accumulation of sandstones, grits, conglomerates, and ironstones [12] (Figure 6).
Materials and Methods
Geophysical data acquisition
A high resolution airborne magnetic data of part of 1:50,000 Sheet 247(SE) Lokoja (Figure 7) from Nigeria Geological Survey Agency (NGSA) was used for this interpretation with other data sets such as SRTM, radiometric, and field geological data. New aeromagnetic data were acquired with flight line spacing of 500 m, Tie line spacing of 20 m, and Terrain clearance of 80 m, Flight direction is NW-SE while the Tie line direction is NE-SW.
Geophysical data processing and analysis methodology: The original Total Magnetic Intensity (TMI) grid (Figure 7) was processed, filtered and transformed to other grids which include Analytic Signal (Figure 8), Source Parameter Imaging (SPI) depth to magnetic sources (Figure 9), etc. using Oasis Montaj software with associated extensions of the package such as MAGMAP, SPI, etc. The ArcGIS software was used to extract structural features for interpretation and overlay various layers of information, such as geology, magnetic data. The interpretation was performed on screen in the Arc Map. Quality hardcopy results were produced directly there from.
Interpretation methodology consists of an inspection of the computer screen and hard-copy images, maps of the aeromagnetic data (TMI), Analytic Signal, SPI depth map, geological map, satellite images, ternary maps, SRTM map and other relevant data.
Since Analytic Signal is useful in locating the edges of magnetic source bodies such as iron ore, particularly where remanence and/or low magnetic latitude complicates interpretation; the Analytic Signal map (Figure 8) was used to delineate the boundary of potential iron ore area.
The observed magnetic field at every point is a vector sum of various components, such as the regional field and the local field components. In addition to induced magnetism, rocks may also have a remanent magnetic component [15]. Remanent magnetism is the effect of the primary magnetic field at the time of rock formation. The total magnetic response is proportional to both the induced magnetism as well as remanent magnetism [16]. The regional field was assumed to be a first-order polynomial plane and it was derived by the least-square fitting of a plane:
Where x and y are unit spacing along the two axes of the blocks and ao, a1 and a2 are the coefficients of the plane. From this relation, the regional gradients along any line were calculated. This was achieved with the aid of Geosoft MAGMAP software which is based on the least square (best-fit polynomial). The computed regional anomaly was subtracted from the total magnetic field intensity to obtain the field due to local geological events referred to as the residual magnetic map.
Field mapping/sample collection
During the field exercise, oolitic and pisolitic ironstone outcrops were encountered except for few areas where overburden prevents their exposure. The overburden which consists of mainly hard lateritic material and humus soil in most places have thicknesses varying from 0 m to 10 m as observed from a vertical section on a cliff within the survey area (Plate 1 and Plate 2) while the thickness of the deposits varied between 2 m to 16 m with an average of 9m as observed from the field. Since the ironstone deposits occur as flat-lying bedded deposits with approximate uniform thickness, the Planimetric method of Volumetric estimation was utilized in estimating the probable reserve.
Ten (10) blocks were delineated and mapped out during the field study and ten representative samples were collected (one sample per block) strictly for Specific Gravity determination. The reserve was estimated using the following relations:
Where Ai = Area of the ith block.
hi = Thickness of the ith block.
Laboratory analysis
Over fifty (50) fresh samples were collected in the study area while twelve (12) representative samples from the major outcrops were analyzed for major oxides determination at the National Geosciences Research Laboratories, Kaduna to determine its chemical and mineralogical composition. X-Ray Fluorescence (XRF) was carried out on all the twelve samples to determine their percentage mineral composition in terms of their oxides using standard technique.
Results and Discussion
Result of aeromagnetic and radiometric data
A qualitative interpretation of the Total Magnetic Intensity (TMI) map of the area (Figure 7) shows some prominent linear and broad magnetic anomalies with high and low gradients and closures with varying amplitudes. Also, there are widespread short-wavelength signatures which are characteristics of near-surface basement exposure or magnetic material emplaced close to the surface.
Sedimentary terrains are usually characterized by long-wavelength signatures on the TMI which is an indication of very deep magnetic sources. Conversely, the study area is characterized by short-wavelength signatures which are indications of either intrusion or shallow magnetic sources. Analytic Signal map (Figure 8) also reveals a prominent magnetic source close to the surface around the study area. This was complemented by the computed SPI depth magnetic sources (Figure 9) which also shows that the magnetic sources around the study area are close to the surface.
From the aeromagnetic interpretation, strong magnetic signatures that may be related to Iron ore mineralization are well-spread within the study area. The SPI depth estimate to the magnetic sources from the area varied between 20 m to about 100 m, therefore the possibility of finding iron ore occurrence at the surface and near-surface is high. This assertion was confirmed during the geological mapping in the area. Iron ore in the sedimentary area of Nigeria usually occurs as pisolitic and oolithic ironstones and is widespread within the study area.
Since mineralization processes can also affect radioelement contents of rocks, radiometric data of the area was processed and interpreted. The identified high magnetic intensity zone from the aeromagnetic data was marked by high Thorium (Th) and Uranium (U) count but low Potassium (K) count on the radiometric data (Figure 10, Figure 11, and Figure 12). The zone was also distinctly delineated from the Th/K ratio map (Figure 13) and a ternary image of the radio-elements (Figure 14). These deductions from the aeromagnetic data interpretation form the basis for the ground-truthing of the area while the TMI map and other maps generated were used as the base map for the detailed geological mapping.
Result of the field study
Detailed geological mapping carried out indicates that ironstone outcrops in more than two-thirds of the study area. The iron ore deposit which is of economic interest is mainly oolithic and pisolitic ironstone. The oolith varies from 0.5 mm to 2 mm in diameter. The ironstone deposit has a good outcrop exposure in the study area with an approximate area extent of 87,000 m2 from both field observation and aeromagnetic data interpretation. The thickness of the deposit varied between 2 m to 16 m with an average of 9 m as observed from the field. The overburden thickness varied from 0 m to 10 m from field observation but from the airborne geophysical survey, it varied from 2 m to 30 m. The ironstone outcrops encountered during the field investigation (Plate 1 and Plate 2) were used to produce an ironstone occurrence map of the study area (Figure 15). Also, the outcrops were superimposed on the Total Magnetic Intensity (TMI) map (Figure 16) and the Analytic Signal map (Figure 17) to map out the area extent of the ironstone deposit.
Result of the geochemical analysis
Geochemical analyses of ten (10) representative samples (one from each block) suggest that the Specific Gravity varies from 3.13 to 3.97 with an average of 3.54 (Table 1). From the analyses of twelve (12) representative samples from the study area for percentage oxide determination, it was observed that all the samples contain an appreciable amount of Iron Oxides with varying percentages of Fe2O3 as shown in the analyses results (Table 2). The percentage of Iron oxide (Fe2O3) in the samples ranges from 89.83% to 96.91% with an average of 93.04%. The phosphorus content varies from 0.53% to 1.75% with an average of 1.208% (Table 2).
Reserve estimation
Area of each marked out block of the outcrop was used to multiply the average thickness of the ore body in that particular block to obtain its volume. The volumes of all the blocks were summed up to give the approximate total volume of the ironstone deposit using equation 2 above. The approximate surface area of the ironstone outcrop is 86863.1062 m2 with an average thickness of 9 m. Applying equation 2, the average volume of ironstone is 781767.9558 m3 which is equivalent to 27624309.39 ft3. Using equation 3, and taking the mean value of Specific Gravity for the ten blocks to be 3.54 yields a conversion term (cubic feet per ton) as 9.05. This value when multiplied with 27624309.39 gives rise to 250,000,000 tons of ironstone.
Thus the area has an inferred reserve estimate of about 250 million tons of mineable ironstone deposit.
Conclusion and Recommendation
This research has shown that Egnaeja area has good quality ironstone deposit of economic value. An inferred reserve estimate of about 250 million tons of mineable ironstone deposit is quite promising and can yield much return on investment for any company that wishes to engage in the exploitation of this precious resource. Although this inferred reserve of mineable iron ore deposit is quite encouraging, core drilling is recommended to inform adequate modelling of the reserve to make assurance a double sure prior to exploitation.
Acknowledgements
We are grateful to the management of the Nigerian Geological Survey Agency (NGSA), KBAB Geosciences' Consult, and Elgeoopes Energy Resources Limited for the technical and financial support to carry out this study. The efforts of Salami Anthony, Adigun Akeem, Nwaezi Festus, and Isong Michael in the course of the data acquisition are highly appreciated.