
International Journal of Earth Science and Geophysics
(ISSN: 2631-5033)
Volume 6, Issue 2
Research Article
DOI: 10.35840/2631-5033/1838

Article Formats
Euler Deconvolution and Two-Dimensional Modeling of Subsurface Structures over Part of Northern Bida Basin and its Surrounding Basement Rocks, Northwest, Nigeria Using Magnetic Method
Table of Content
Figures
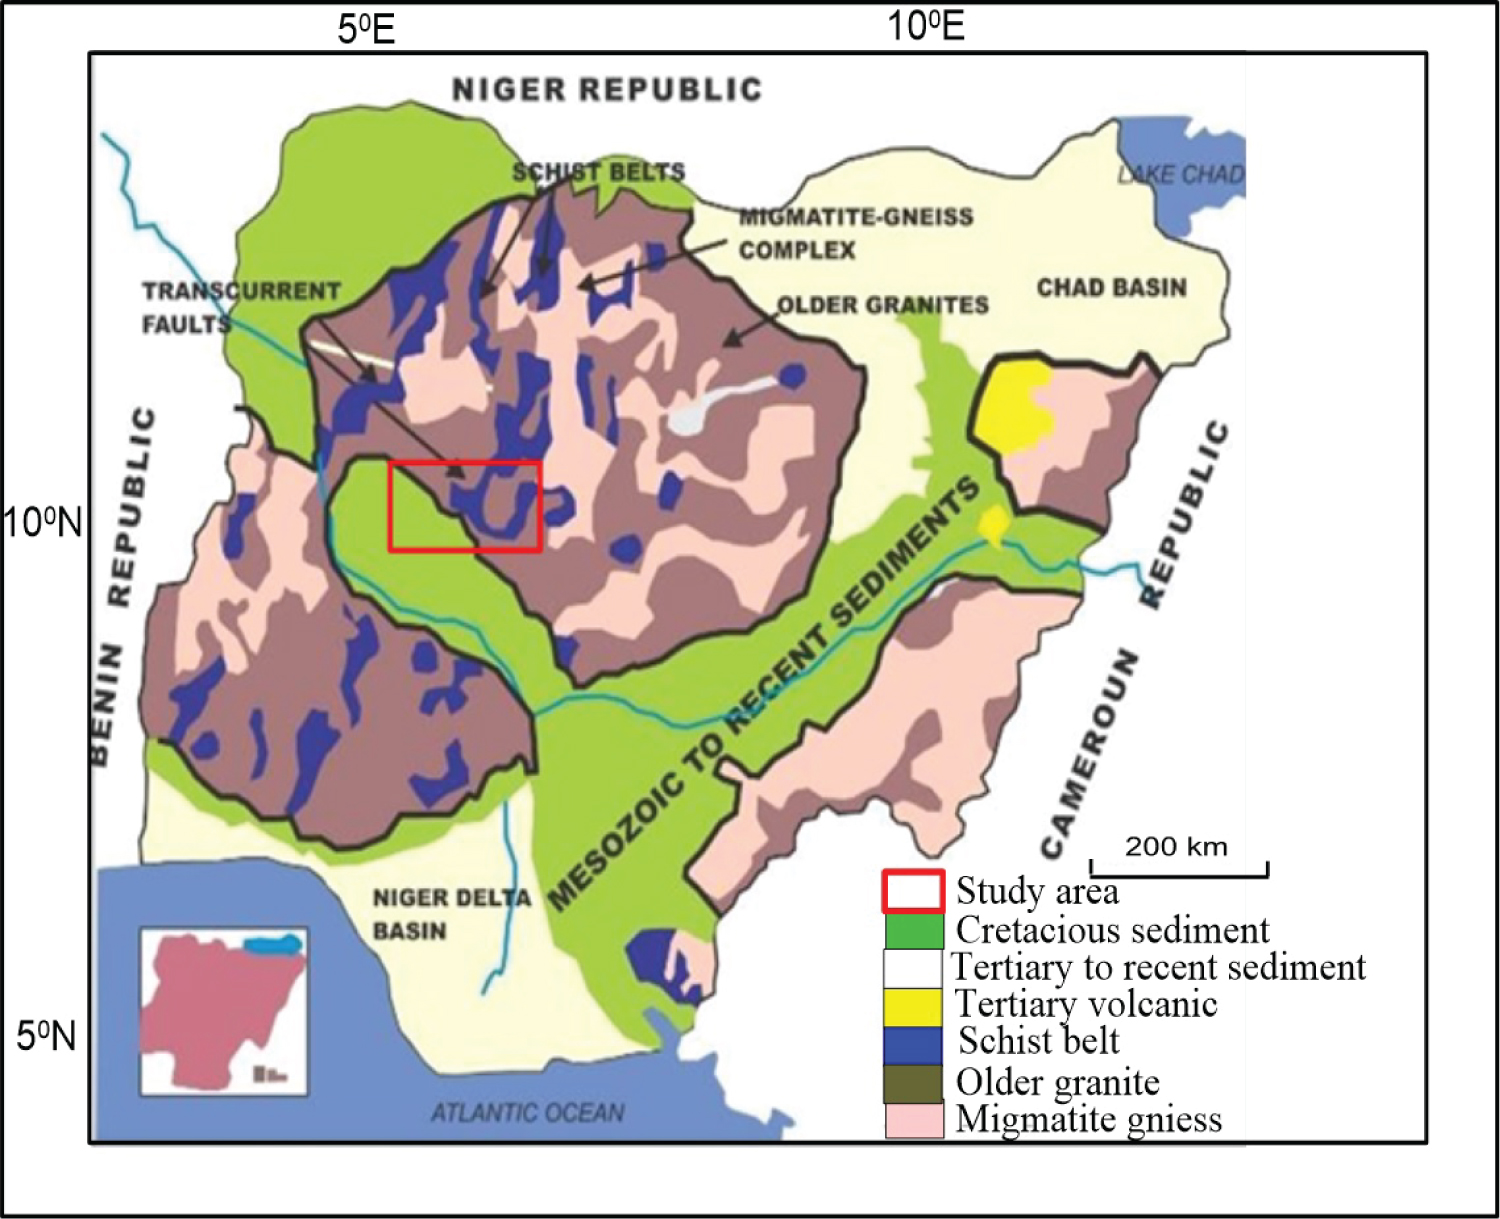
Figure 1: Geologic map of Nigeria Showing the Schist....
Geologic map of Nigeria Showing the Schist belt and location of the study area [15].

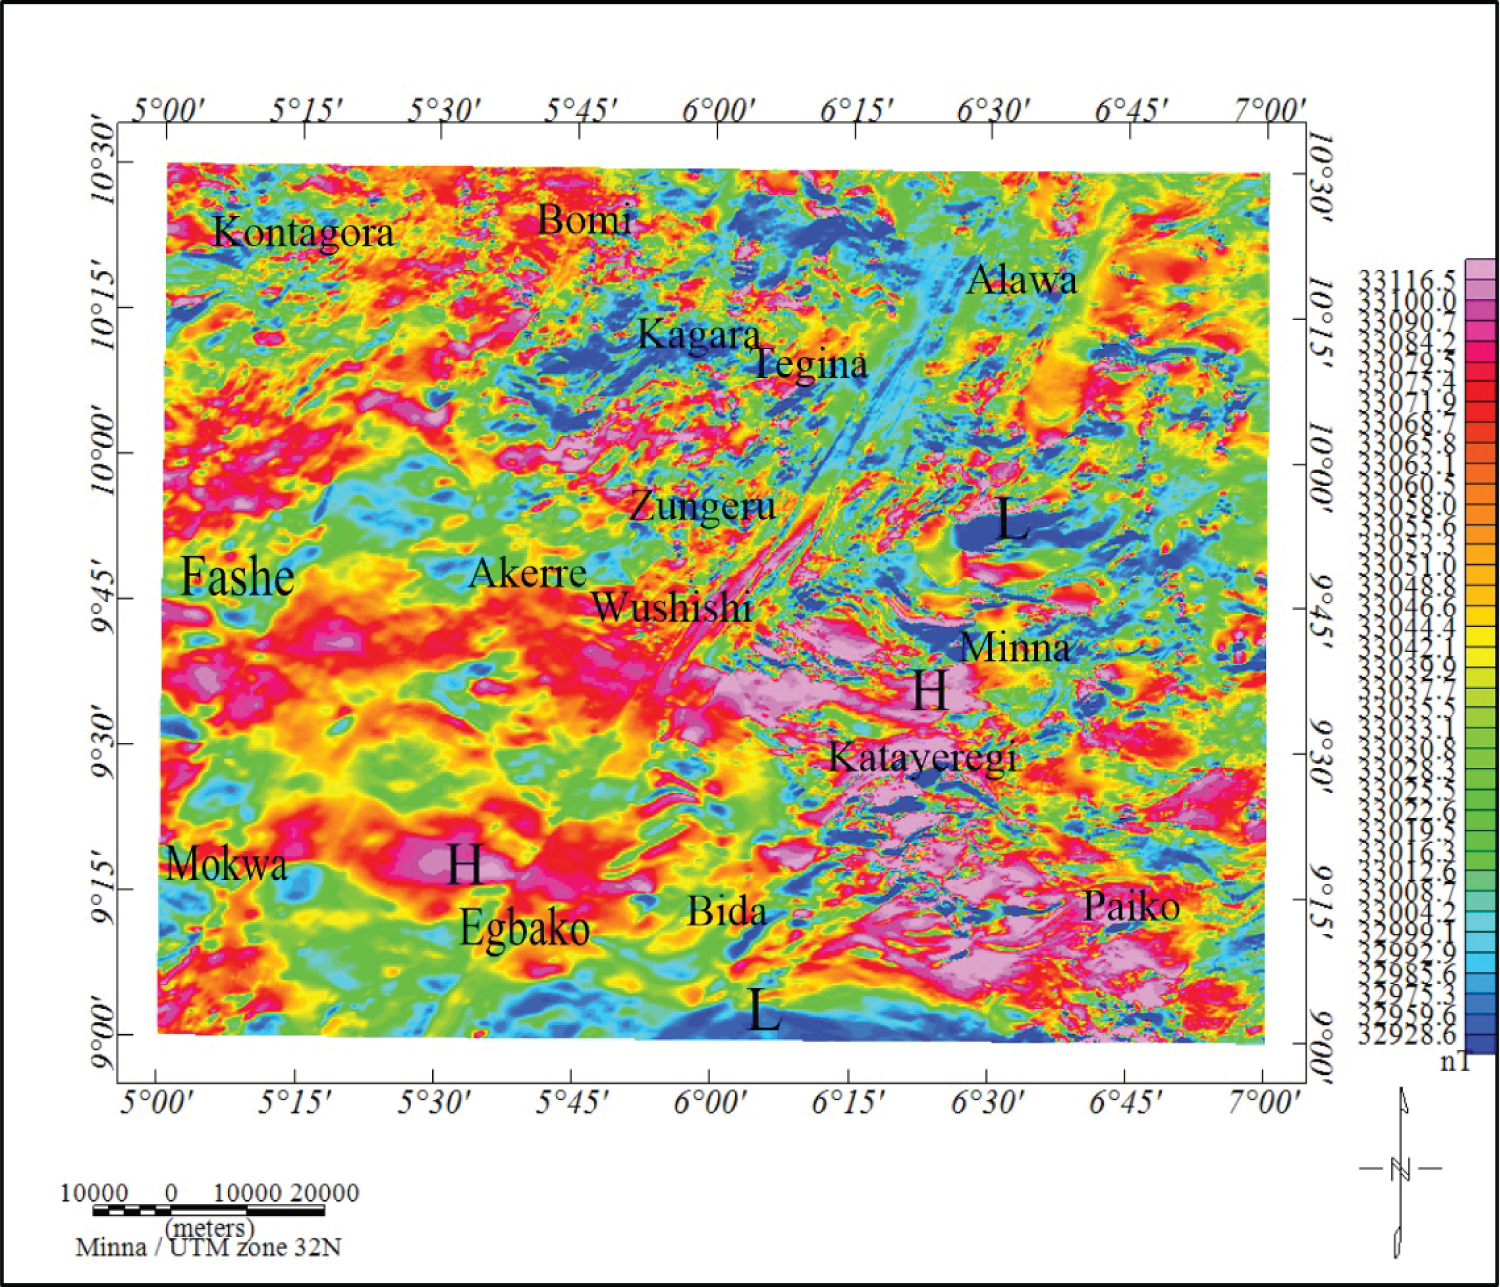
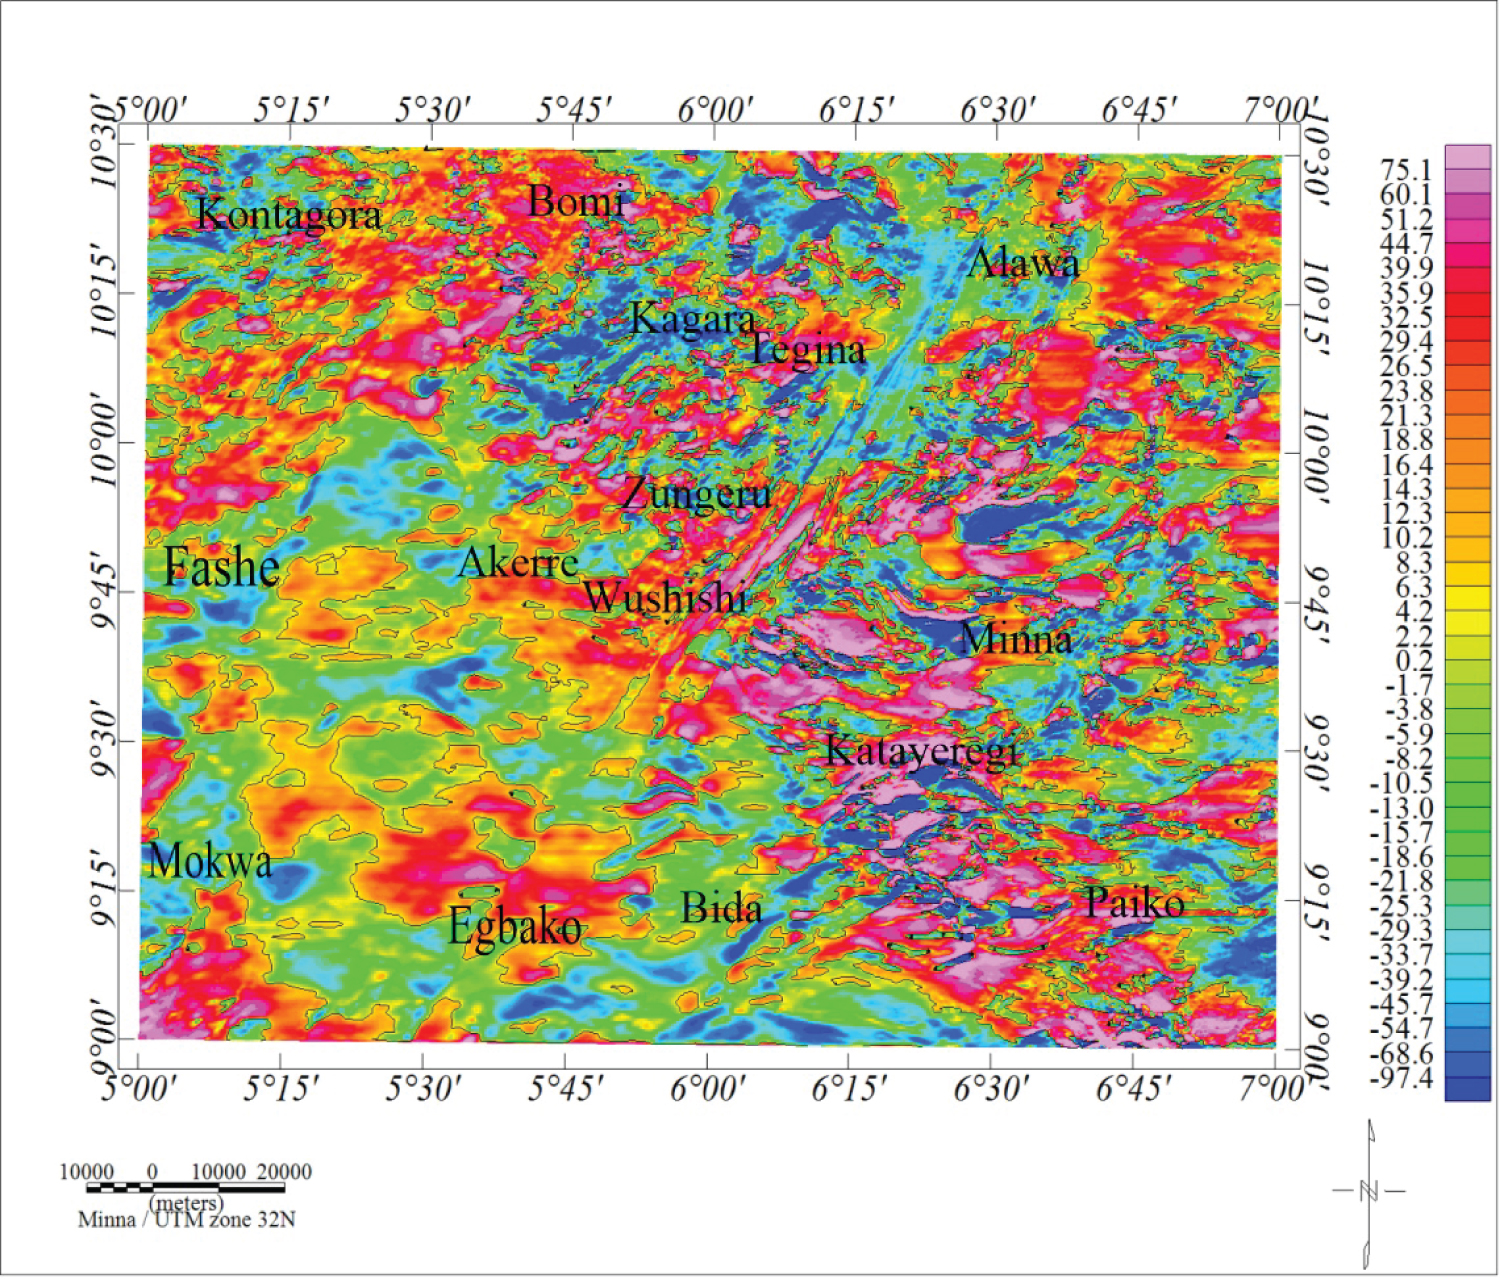
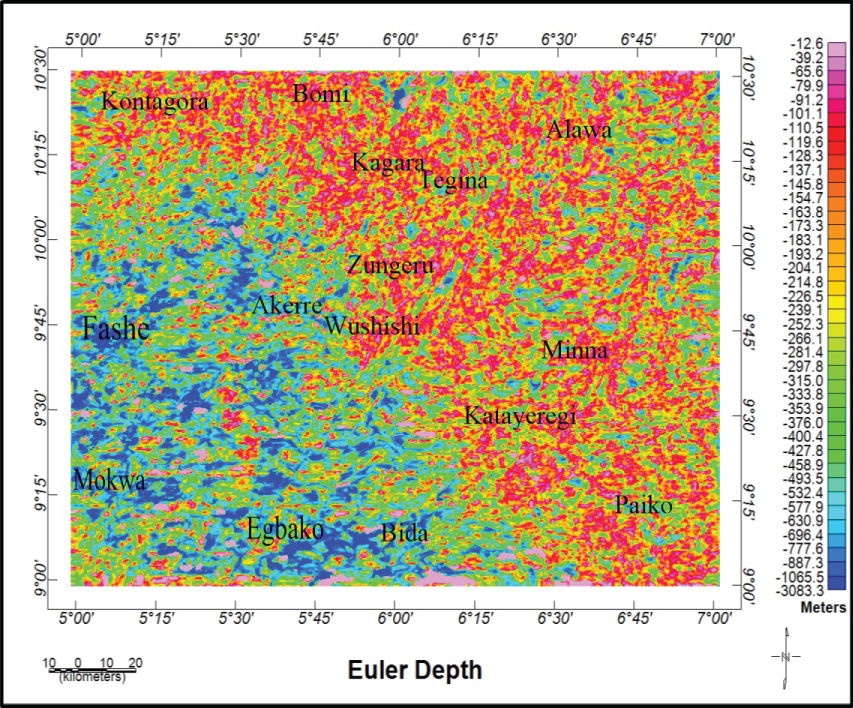
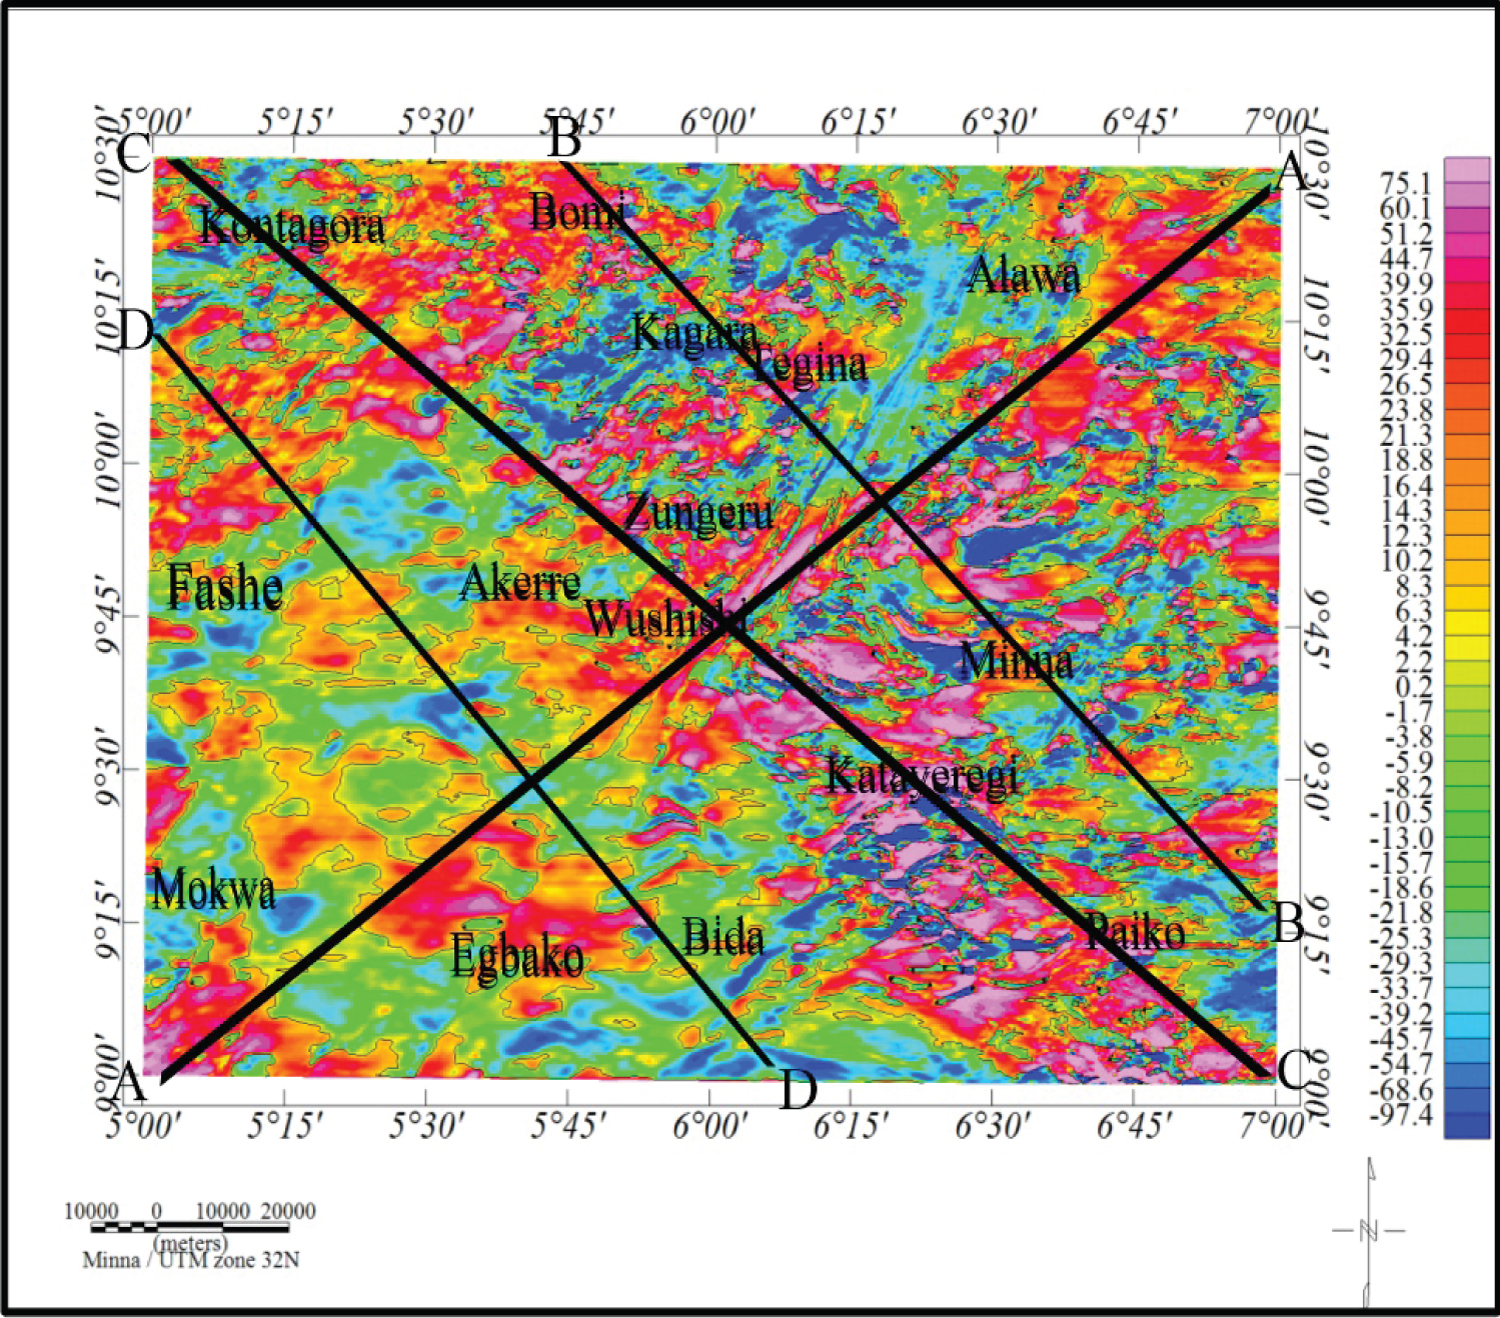
Figure 6: Residual magnetic map showing profile....
Residual magnetic map showing profile AA, BB, CC and DD.
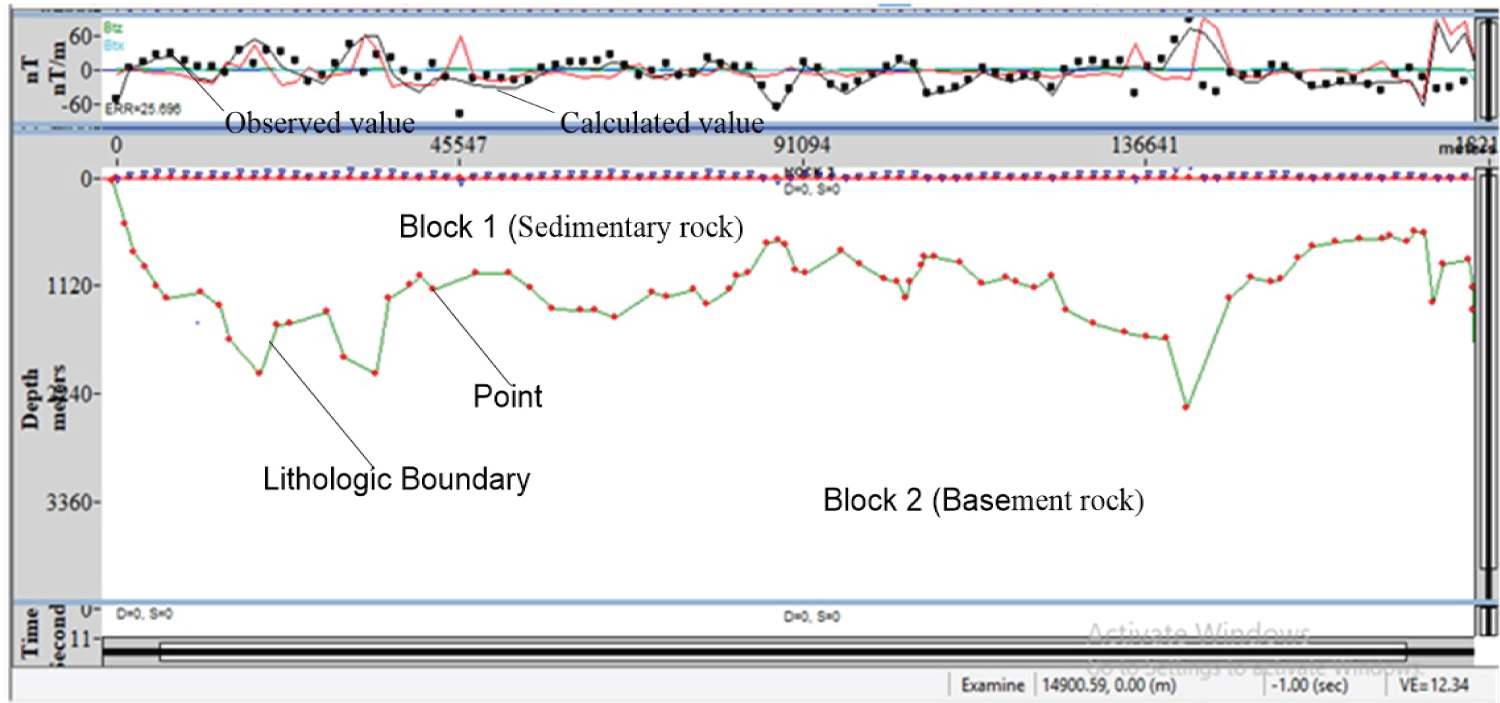
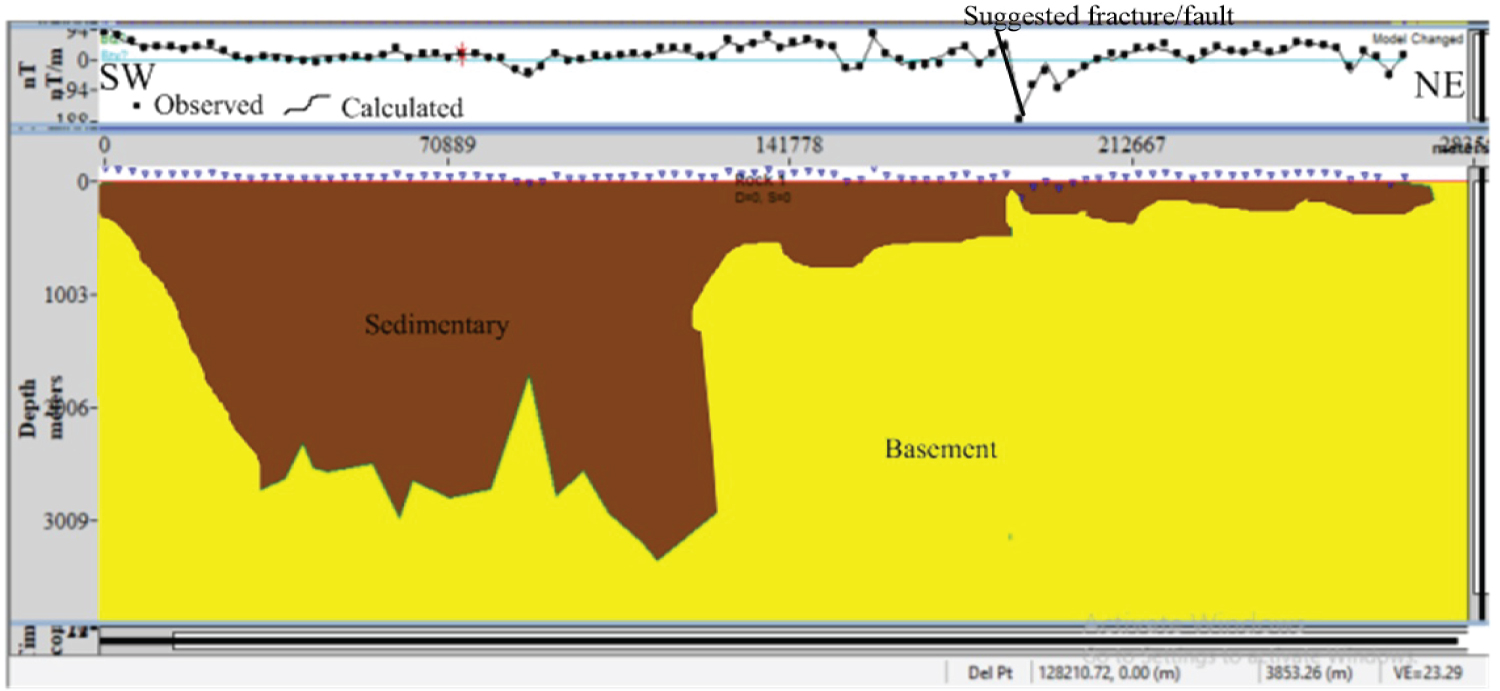
Figure 9: Observed and calculated magnetic depth for...
Observed and calculated magnetic depth for profile AA.

Figure 10: Observed and calculated magnetic depth...
Observed and calculated magnetic depth for profile BB.
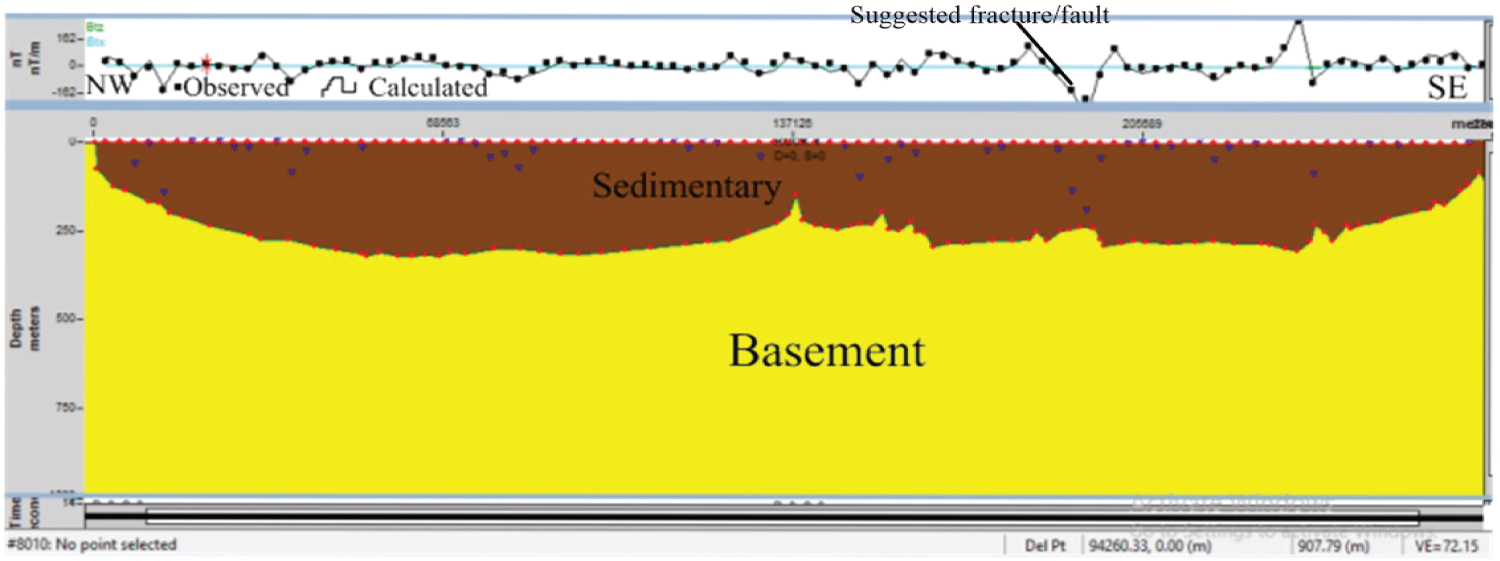
Figure 11: Observed and calculated magnetic depth...
Observed and calculated magnetic depth for profile CC.
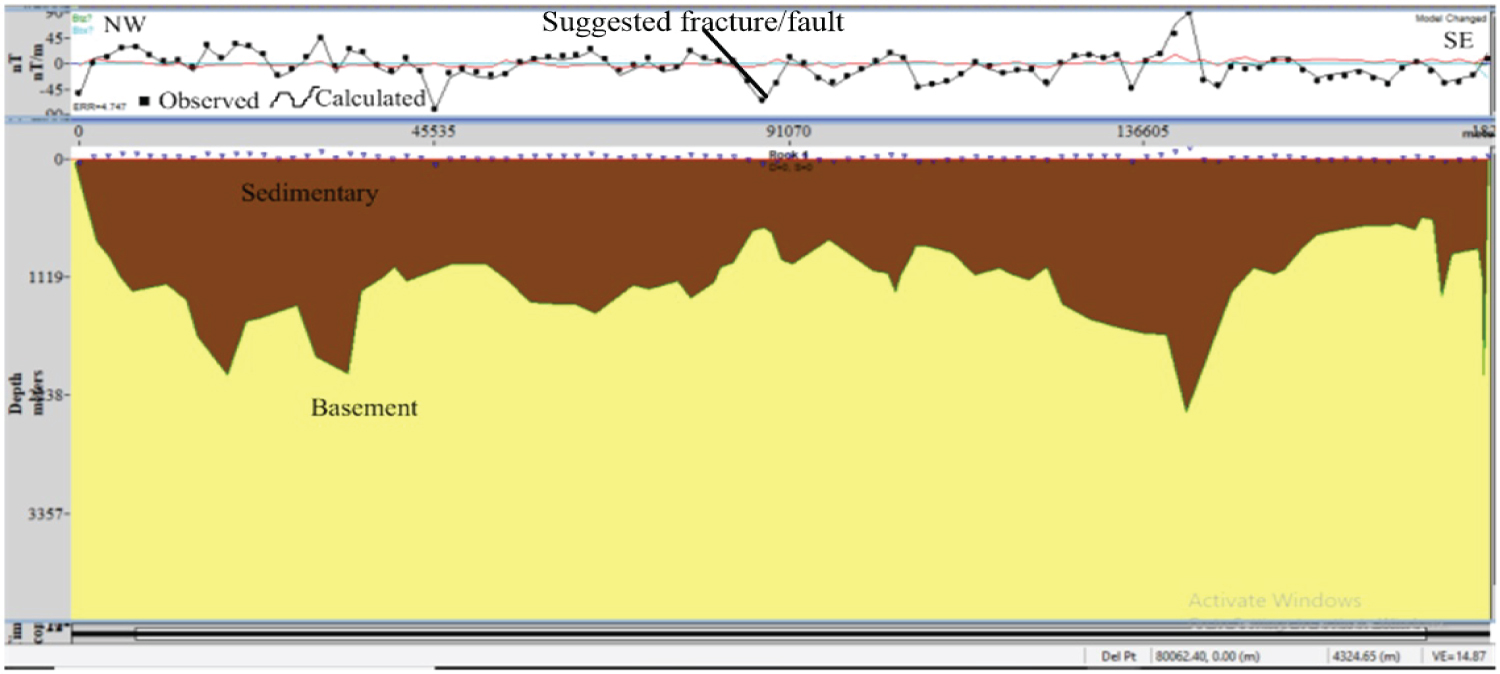
Figure 12: Observed and calculated magnetic depth...
Observed and calculated magnetic depth for profile DD.
References
- Ojo OJ, Akande SO (2012) Sedimentary facies relationships and depositional environments of the Maastrichtian Enagi formation, Northern Bida Basin, Nigeria. Journal of Geography and Geology 4: 136-147.
- Ministry of Mines and Steel Development (2016) Nigeria's mining and metal sector. Investment Promotion Brochure 5-17.
- Saalmaan K (2007) Structural control on gold mineralization in the Satulinmäki and Riukka prospects, Häme Schist Belt, southern Finland. Bulletin of the Geological Society of Finland 79: 69-93.
- Usman AO, Ezeh CC, Chinwuko IA (2018) Integration of aeromagnetic interpretation and induced polarization methods in delineating mineral deposits and basement configuration within Southern Bida Basin, North-West Nigeria. Journal of Geology and Geophysics 7: 449.
- Maigwara JU, Udensi EE (2013) Lineament study using aeromagnetic data overparts of southern Bida Basin, Nigeria and the surrounding basement rocks.International Journal of Basic and Applied Sciences 2: 115-124.
- Udensi EE, Osazuwa IB (2002) Two and half dimensional Modelling of the major structures underlying the Nupe Basin, Nigeria using aeromagnetic data. Nigeria Journal of Physics 14: 55-61.
- Haruna IV, Ahmed HA, Ahmed AS (2012) Uranium favourability study in an area around Pantishawa, Adamawa Massif, northeast. Nigeria. International Journal of Scientific Research 2: 125-131.
- Udensi EE, Ojo SB, Ajakaiye DE (1986) A three-dimensional interpretation of bouguer anomalies over the Minna batholiths in central Nigeria. Precambrian Research 32: 1-15.
- Udensi EE, Osazuwa IB, Daniyan MA (2003) Trend analysis of the total magnetic field over the Bida Basin, Nigeria. Nigerian Journal of Physics 15: 143-151.
- Nigeria Geological Survey Agency (2010) Index map of airborne survey blocks. Flown between 2003 -e 2010 by Fugro Airborne services. Ministry of mines and steel development, Nigeria Geological Survey Agency, 1-2.
- Thompson DT1 (1982) Euler new method for making computer-assisted depth estimates from magnetic data. Geophysics 47: 31-37.
- Biswas A, Mandal A, Sharma SP, Mohanty WK (2014) Integrating apparent conductance in resistivity sounding to constrain 2D gravity modeling for subsurface structure associated with Uranium mineralization across South Perulia Shear Zone, West Bengal, India.International Journal of Geophysics 2014: 1-8.
- Ho SE, Groves DI (1987) Recent advances in understanding Precambrian Gold Deposits. Geology department and University Extension, University of Western Australia.
- Kerrich R, Wyman D (1990) Geodynamic setting of mesothermal gold deposits: An association with tectonic regimes. Geology 18: 882-885.
- Obaje NG (2009) Geology and mineral resources of Nigeria. Springer publishers, Germany, 1-203.
- Nigeria Geological Survey (2006) Geology map of the study area.
Author Details
Abubakar Nda'asabe Dzukogi1*, Yusuf Abubakar Sanusi1, Sabiu Bala Muhammad1 and Kazeem Salako Adeyinka2
1Usmanu Danfodiyo University Sokoto, Nigeria
2Federal University of Technology Minna, Nigeria
Corresponding author
Abubakar Nda'asabe Dzukogi, Usmanu Danfodiyo University Sokoto, Nigeria.
Accepted: December 08, 2020 | Published Online: December 10, 2020
Citation: Dzukogi AN, Sanusi YA, Muhammad SB, Adeyinka KS (2020) Euler Deconvolution and Two-Dimensional Modeling of Subsurface Structures over Part of Northern Bida Basin and its Surrounding Basement Rocks, Northwest, Nigeria Using Magnetic Method. Int J Earth Sci Geophys 6:038.
Copyright: © 2020 Dzukogi AN, et al. This is an open-access article distributed under the terms of the Creative Commons Attribution License, which permits unrestricted use, distribution, and reproduction in any medium, provided the original author and source are credited.
Abstract
Euler deconvolution and two-dimensional modeling over part of Northern Bida Basin and its surrounding basement rocks, using aeromagnetic data was carried out in this research study. The study area is bounded by latitude 9° 00' - 10° 30' and longitude 5° 00' - 7° 00' with total area of 36,300 km2. The magnetic data was processed using Oasis montaj to produce the total magnetic intensity (TMI) data The TMI data was reduced to equator (RTE). The polynomial filter was applied on the RTE grid to performed regional residual separation. The residual data obtained was subjected to euler depth evaluation and two-dimensional modeling. The depth to the subtle magnetic anomalies and basement rock evaluated from euler deconvolution ranged from 3.083 m to 12.6 m. The highest thickness of sedimentary rocks in the study area was observed around Fashe, Mokwa, Egbako and Bida at the west, southwest and southern part of the study area. The profiles labeled AA, BB, CC, and DD were carefully drawn to cut across major strike in the study area. The result obtained from standard euler deconvolution was used as depth constrain for modeling the residual magnetic field anomalies. The result obtained from modeling shows average depth to the basement/basement structure. The depth was found to be high reaching a depth of about 3.1 km around Fashe, Mokwa and Egbako in southwestern part of the study area. This depth and the prevailing fracture/fault in the area could influence the accumulation of hydrocarbon in the study area. The average depth to the subtle magnetic source target (magnetic minerals) around Wushishi/Zungeru, Maiwayo and Paiko were suggested to be 12.8 m.
Keywords
Subtle, Estimation, Maximum, Euler depth, Factor and Deposit
Introduction
The crash of crude oil price in the oil market has drawn the attention of stakeholders to the non-oil revenue sector of Nigeria [1]. Despite the larger part of Nigeria is underlain by basement rocks rich in solid minerals, the search for solid minerals have not been given adequate attention. Thus, there is a gap in solid mineral information across the country. Currently, Nigeria solid mineral sector contributes less than 1% to the Gross Domestic Product (GDP) Ministry of Mines and Steel Development [2]. The knowledge of the structural architecture of mineralized zones, the distribution and orientation of faults/fractures and shear zones; their formation and possible reactivation during the structural revolution and tectonic condition is a key to understanding the formation, origin and location of mineral deposits as well as exploration and finding a new target [3]. In view of environmental pollution associated with oil exploration and decline in the exploration of solid minerals in Nigeria, it is prudent to explore solid mineral deposit for human consumption and safety environment. Interpretation of potential data involves the numerical estimate of shape, volume and depth to the subtle magnetic anomaly. This study focuses on the magnetic interpretation, depth to the basement rock and mineralized fracture/fault that caused the magnetic anomaly; all were estimated through different techniques. This was toward achieving the precise depth to the subtle target (mineralized potential areas). Among the techniques were modeling and euler deconvolution.
The euler deconvolution and two-dimensional modeling of aeromagnetic data over Northern part of Bida basin and its surrounding basement rocks was used to differentiate and characterize regions of sedimentary thickness from those of very shallow basement terrain. These were also used to determine the depths to the magnetic sources. The result is used to suggest whether or not the study area has the potential for oil/gas and solid mineral potential. The study area is bounded by latitude 9° 00ꞌ N to 10° 30ꞌ N and longitude 5° 00ꞌ E to 7° 00ꞌ E located within Niger state Northwest, Nigeria (Figure 1). The study area have an area of 36,300 km2 covered by 12 aeromagnetic maps.
Geologic Setting of the Study Area
The study area fall within the central part of the Northwestern part of Nigeria (Figure 1). The major towns in this area are Kontagora, Bomi, Tegina, Alawa, Fashe, Akerre, Wushishi, Zungeru, Minna, Mokwa, Egbako, Bida and Paiko. The geology of the study area can be viewed in terms of two principal lithologic units, the oldest unit consists of Precambrian Basement rocks at the northeast, southeast and Northwestern part of the study area while the second unit consists of Cretaceous to recent sedimentary rocks (sandstone, silt and clay) of Bida basin which overlie the Precambrian basement unconformable at the southwestern part of the study area (Figure 2). The Cretaceous sediment of Bida Basin was dipping to the southwest reaching a thickness of 1.72 km and 3.24 km [4-6]. The Cretaceous to recent sediment of the study area consist of Sakpe iron stone formation, Enagi silt stone, Batati iron stone and Bida formation.
The schist belt (metasediment and metavolcanic) that overlie the basement rocks of Nigeria (Figure 2) were dominant in the northeast and few in the northwest and central part of the study area. The schist belt was intruded by fine to coarse grain granite rocks (Figure 2). The schist belt boundaries have been described as metamorphic front, Mylonite and rift bounding faults [7]. The basement rocks were characterized by granite to granodiorite and amphibolite rocks [8]. The major structural trend in the basement rock in Nigeria is essentially northeast - southwest and follows the tectonic grain of the schist belt [9]. The study area is bounded at the southwest and southeast by the Cretaceous sediment of Nupe Basin (Figure 2).
Materials and Methods
The materials used in this research study include high resolution aeromagnetic data of sheet 140-143, sheet 161-164 and sheet 182-185 covering the study area. The magnetic data was collected by FUGRO airborne services for Nigeria geological survey agency between. The data was flown at a mean terrain clearance of 80 m and profile line spacing of 500 m [10]. The magnetic data was analyzed using Oasis montaj version 8.3 for the production of total magnetic intensity (TMI) map of the study area. The data was reduced to equator and further analyzed using different methods such as euler deconvolution and modeling, suitable to achieve the designed objectives.
Euler deconvolution was applied to estimate the sedimentary thickness and depth to the subtle magnetic source in the study area. This method involves setting an appropriate structural index (SI) value of one (1) and using least-squares inversion to solve the equation for an optimum xo, yo, zo and B. This technique is based on the Euler homogeneity equation [11]. The magnetic field and it gradient is related to the location of the source of an anomaly, with the degree of homogeneity expressed as a structural index. The relationship is expressed as [11].
Where (xo, yo, zo) is the position of the magnetic source whose total magnetic field (T) is detected at (x, y, z). B is the regional magnetic field and N is the structural index related to the simple source geometry.
Result and Discussion
Quantitative interpretation of potential data involves the numerical estimate of shape, volume and depth to the subtle magnetic anomaly. In this study, estimation of depth to the basement/basement structures that causes the anomalies was estimated through euler deconvolution and modeling which were used in this study.
The total magnetic intensity (TMI) map (Figure 3) represents all the magnetic effect in the area. There are variations in magnetic intensity values which suggest a wide variety of different magnetic properties. The regions with high magnetic effect were denoted with (H) and areas with low magnetic effect were denoted with (L). These magnetic effects are due to the magnetic strength and magnetic susceptibilities of different types of rocks in the study area. The south western part is predominantly characterized with low magnetic response which is characteristics of sedimentary rocks. However the high magnetic effect in the area, suggests the presence of the intra-sedimentary intrusions or oolitic/iron ore, ferruginise sand stone in the area.
Usman, et al. [4] suggested based on the prevalent fractures/fault; the possibility of solid minerals in the southern part of Bida basin is feasible. A geomagnetic inclination of -4.234 and declination of -2.102 (Derived from IGRF) was used to reduce the TMI. In doing these, the magnetic anomalies were centre over their sources. This makes the data easier to interpret while not losing any geophysical meaning. For the interpretation of aeromagnetic data covering the study area, the reduced TMI was separated by the first order polynomial method which gives rise to regional and residual field data of the study area.
Residual Field Anomaly
For effective interpretation of potential field data (magnetic data), the residual field data was separated from the regional background field. The residual field data represent the near surface short wavelength magnetic bodies (Figure 4). High magnetic effect with high frequency was observed on the residual field anomaly map at the northwest, northeast and southeastern part of the study area (Figure 4). Magnetic values of the residual anomalies ranged from -57.4 nT to 75.1 nT. The negative value could indicate a typical sedimentary rock while the magnetically responsive areas indicate the occurrence of basement rocks (Igneous and metamorphic rocks) containing various amount of magnetic minerals. The high magnetic areas observed in the southwestern part of the study area could suggest the presence of oolitic iron ore or probably an intrusion of igneous rock into the sedimentary rock Usman, et al. [4]. Biswas, et al. [12] generally believe there would always be a susceptibility contrast across a fracture/fault zones due to oxidation of magnetite to hematite, or infilling of fractured rocks by dyke like bodies whose magnetic susceptibilities are different from their host rocks.
Euler Depth
The euler deconvolution, depth estimation technique was applied to the magnetic data in view of estimating the depth to the subtle magnetic anomaly and the thickness of sedimentary rocks in the study area. The depth to the subtle magnetic anomalies and basement rock ranges from 3,083 m to 12.6 m (Figure 5). The highest thickness of sedimentary rocks in the study area was 3,083 m (3.1 km) at the south, southwest and western part of the study area (Upper Bida Basin), around Fashe, Mokwa, Egbako and Bida (Figure 5). The estimated sedimentary thickness of 3.1 km and the subsurface fracture/fault (magnetic lineament) could influence the presence of hydrocarbon in the study area. Usman, et al. [4]; Maigwara and Udensi [5] in their findings reported that based on the computed sedimentary thicknesses of 2.3 to 3.2 km and the prevalent fractures; the possibility of hydrocarbon accumulation in the southern part of Bida basin is feasible.
Modeling
The residual grid data was subjected to two-dimensional subsurface modeling. The profiles labeled AA, BB, CC, and DD were carefully drawn to cut across major strike of the anomalies in the study area (Figure 6). These profiles were taken on residual grid using GM-SYS 2D models of Oasis montaj version 8.3. Two blocks (lithologic units) was created along the profile and points were introduced along the boundary. These points were used to calculate the depth of upper lithologic unit (sedimentary thickness) by adjusting the points to merge the calculated magnetic values with the observed magnetic values (string) (Figure 7). The depth to magnetic sources results obtained from standard Euler deconvolution was used as depth constrain for modeling the residual magnetic field anomalies. Anomaly areas including high density structural contact areas were modeled to estimate the sedimentary thickness and depth to top of the mineralized fracture/fault that would caused the anomaly (Figure 8). The regional and local controls of Gold mineralization are mainly structural, made up of a system of transcurrent and subsidiary faults and other structures of Pan African age [13].
Profile AA has a length of 272.252 km (Figure 9). It was drawn across the two major lithologic (Sedimentary and basement rock) contact in the study area. The profile begins from Mokwa, across Wushishi/Zungeru to Alawa (Figure 6). The estimated depth obtained from the modeling (Figure 9) show the depth to the top of the basement ranged from 12.8 m to a minimum of 1,555 m and a maximum of about 3.1 km. The deepest part was about 3.1 km which agreed with result of euler depth around Mokwa and northern part of Egbako town (Figure 5). The Cretaceous sediment of Bida Basin was dipping to the southwest reaching a thickness of 1.72 km and 3.24 km [4-6]. The shallow depth of 112.8 m evaluated by the modeling, suggests shallow basement depth at the central and northeastern part of profile AA which agreed with result of euler depth around Zungeru, Minna and Alawa (Figure 5).
The profile BB was drawn across the contour closures with profile length of 79.072 km. It begins from the northwest to southeastern part of the study area passing through Bomi Kagara, Tegina, Minna to the extreme north of Paiko. The profile run across the basement rocks in the northeastern part of the study area (Figure 6). The depth estimated from modeling profile BB range from 12 m at the central to about 1, 200 m at the northwest on profile BB. The estimated depth was suggested as the depth to the magnetic feature that caused the anomaly in that region. The abrupt changes in magnetic susceptibility along the profiles AA and BB (Figures 9 and Figure 10) suggested the presence of mineralized fracture/fault that could host solid mineral in the study area. The depth to the subtle magnetic anomalies in the central and northeastern part of profile AA agreed with estimated depth to the basement observed in profile BB and also the evaluated depth from euler at the northeastern part of the study area (Figure 5). These peculiarity in depth at the central and northeastern part of the study suggesting a shallow depth to the basement rock in that region concede with geology of the study area showing the basement rocks in that region.
The profile CC have a total length of 272.252 km and was drawn from the northwest to southeast beginning from the northern part of Kontagora through Wushishi and Paiko in the southeastern part of the study area (Figure 6). The profile line cut across the contour closures and the strike direction of magnetic closures in the study area. The profile was drawn across the basement rock in the study area. The modeled profile has average depth to the basement/sedimentary thickness of 260 m (Figure 11). The average depth suggested shallow overburden sediment which is one of the characteristics of basement terrain. These agreed with average depth observed on profile AA, BB and euler depth at the central, northeast, southeast and northern part of the study area (Figures 5, Figure 9 and Figure 10) suggesting shallow depth to the subtle magnetic anomaly (mineralized fracture/fault) in the study area.
The profile DD was drawn across the strike of the magnetic closures and sedimentary rock in the southwestern part of the study area. The profile length was 191.178 km striking from the southern part of Kontagora at the northwest through Fashe to Bida at the southern part of the study area (Figure 6). The modeled profile estimated the magnetic source depth of about 1.90 km around Bida in the southern part of the study area (Figure 12). Usman, et al. [4]; Maigwara and Udensi [5]; Udensi [6] estimated the Cretaceous sediment of Bida Basin reaching a thickness of 1.72 km and 3.24 km. A shallow depth of magnetic response at about 112.8 m which agreed with the evaluated depth from Euler (Figure 5) was observed around western part of Fashe and northeastern part of Egbako (Figures 5, Figure 6 and Figure 12). This depth was suggested to be the depth to the top of geologic structures that could caused the anomaly in the study area. These structures probably are related to the uplifted basement blocks during Pan African orogeny that result to rifted basin known as Bida Basin. Kerrich and Wyman [14] reported that the regional fault systems have been suggested to be Pan African crustal structures.
Conclusion
The average depth to the basement/basement structures (Mineralized fracture/fault) that caused the anomaly was 0.0128 km at the Central, Northeast, Southeast and Northwestern part of the study area. The sedimentary depth was found high reaching a depth of about 3.1 km around Fashe, Mokwa and Egbako (Sheets 161, 182 and 183). This depth and the prevailing fracture/fault in the area could influence the accumulation of hydrocarbon in the study area. The average depth to the subtle target (potential areas of mineralization) around Wushishi, Maiwayo and Paiko were suggested to be 12.8 m.