
International Journal of Earth Science and Geophysics
(ISSN: 2631-5033)
Volume 6, Issue 2
Research Article
DOI: 10.35840/2631-5033/1843

Article Formats
Cretaceous Bida and Sokoto Basins of Nigeria: Deducing Basin Architecture and Basement Topography from Aeromagnetic Data Analyses
Table of Content
Figures

Figure 1: Geologic map of Nigeria....
Geologic map of Nigeria [31]. The cretaceous basins of Nigeria are indicated in green coloration. The study region is indicated in red border lines.
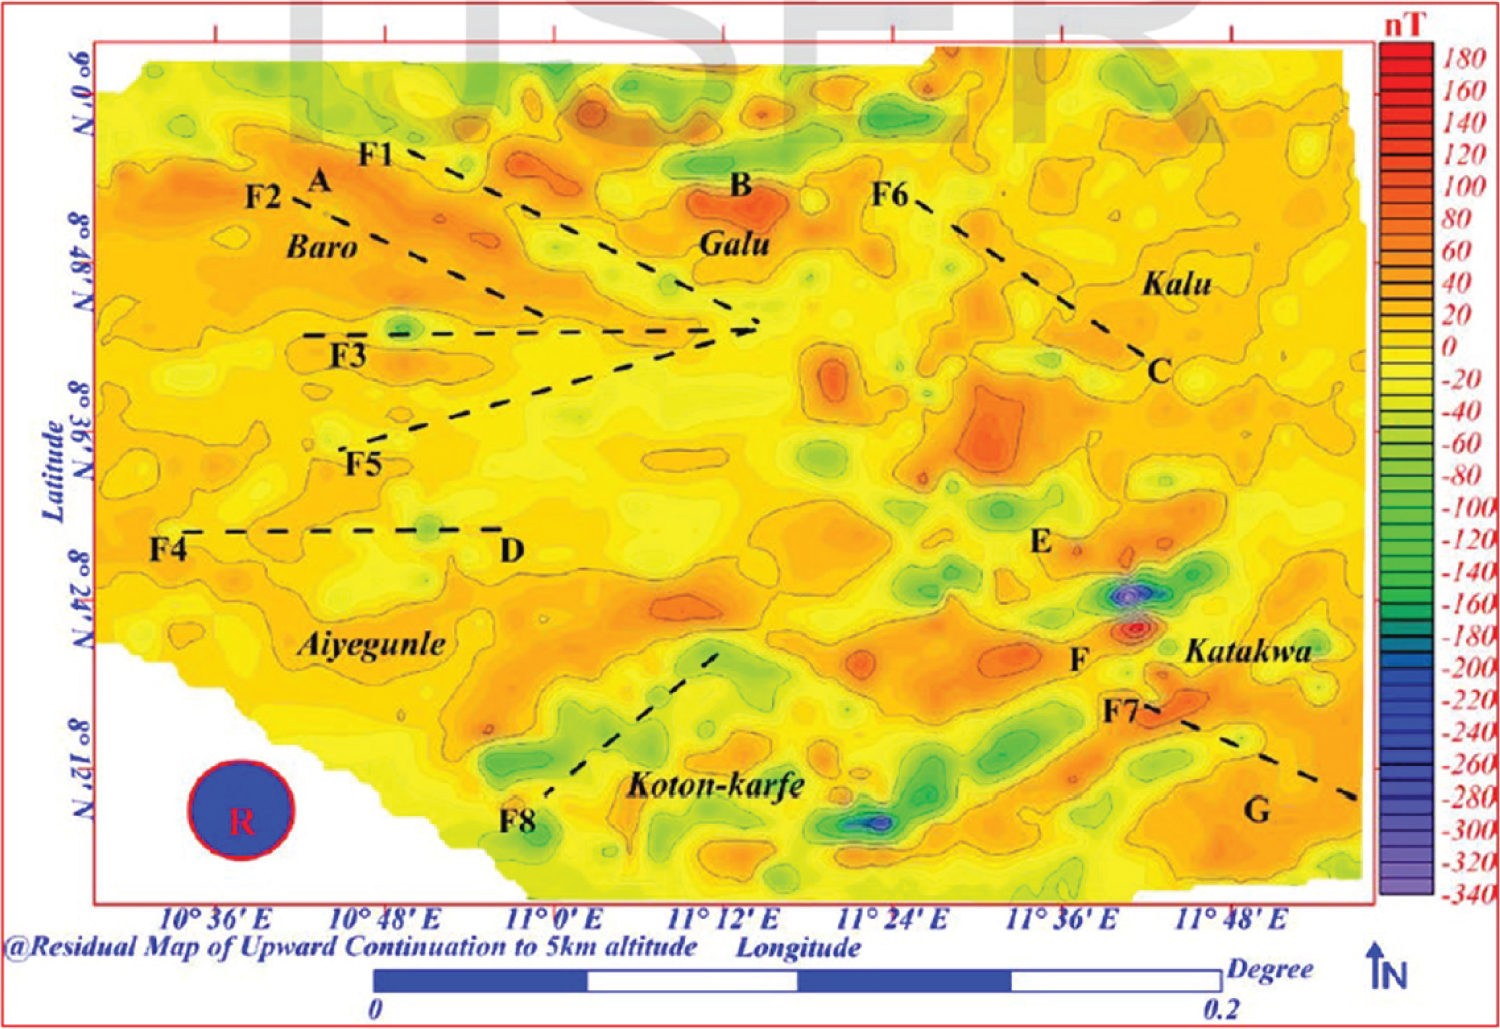
Figure 2: Residual map of upward continuation.....
Residual map of upward continuation to 5 km altitude. From Megwara and Udensi [8].
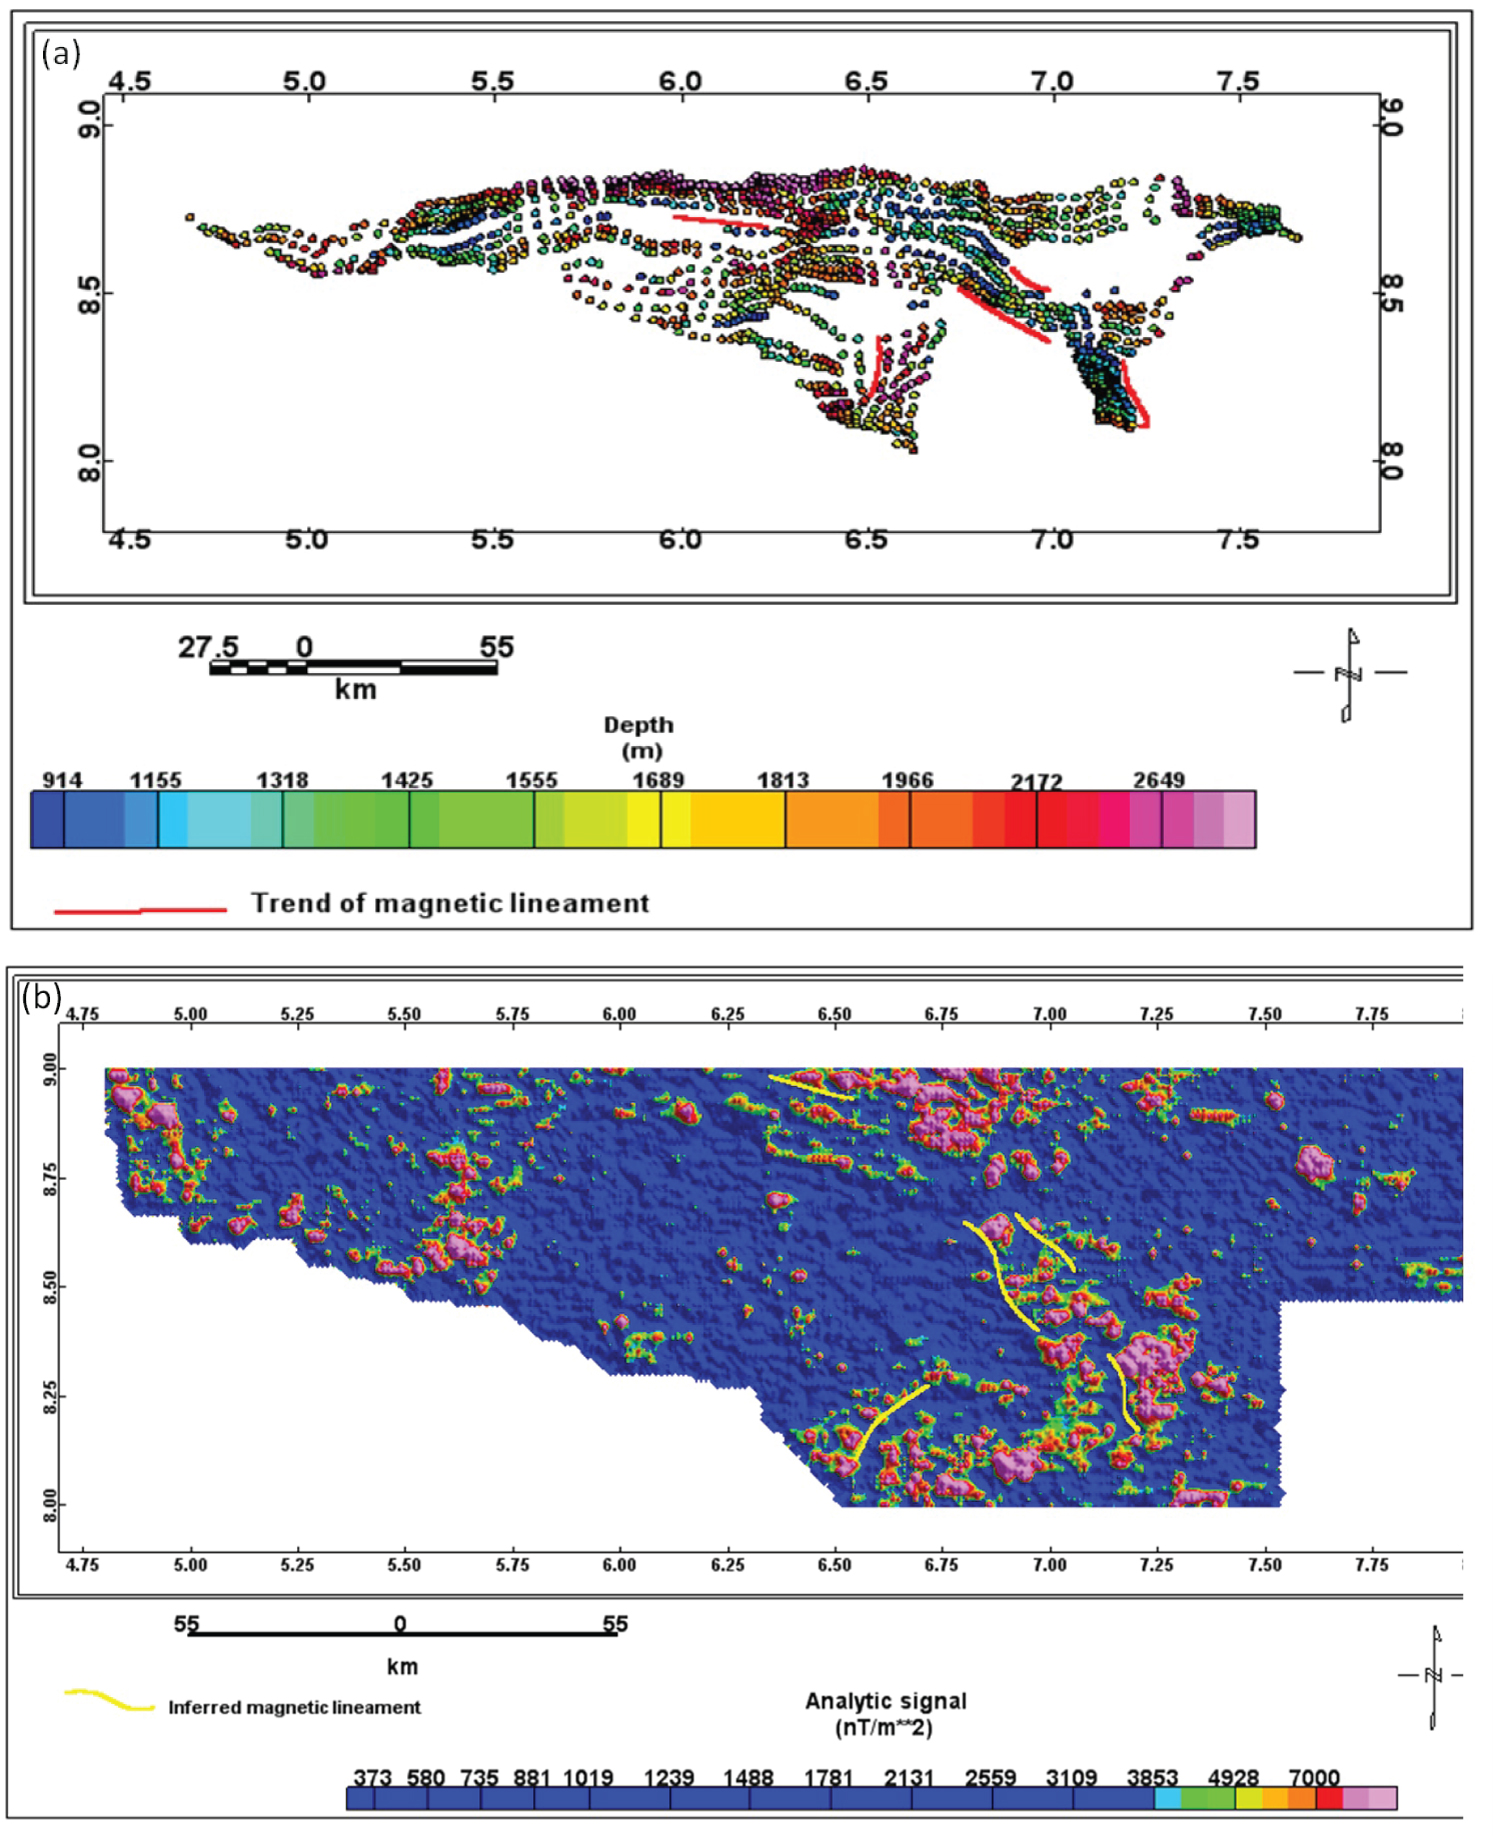
Figure 3: Correlation of (a) Zone coloured Euler....
Correlation of (a) Zone coloured Euler deconvolution and (b) Analytic signal maps. From Megwara and Udensi [8].
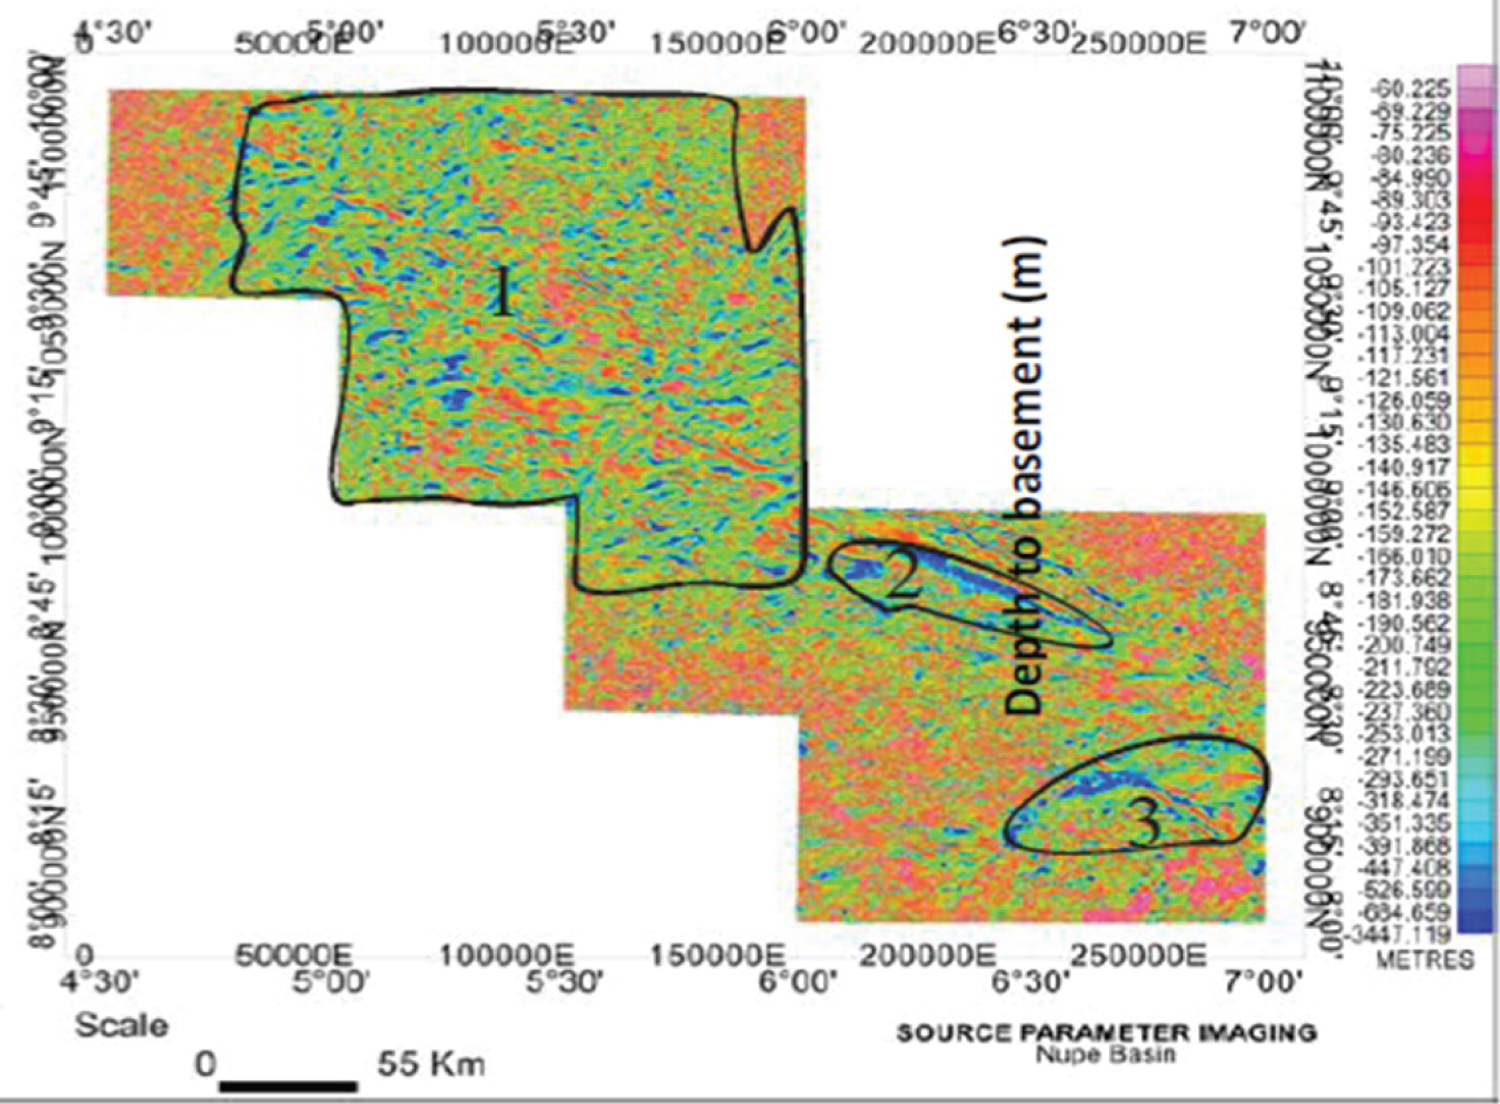
Figure 4: Interpreted depth to basement from the....
Interpreted depth to basement from the 2009 IGRF corrected aeromagnetic data of Bida/Nupe basin using SPI. Blue colour indicates the areas with the lowest total magnetic field intensity, while purple colour indicates regions with the highest total magnetic field intensities. The deepest areas in Bida Basin are indicated by the zones (1-3). From Tsepav and Mallam [2].
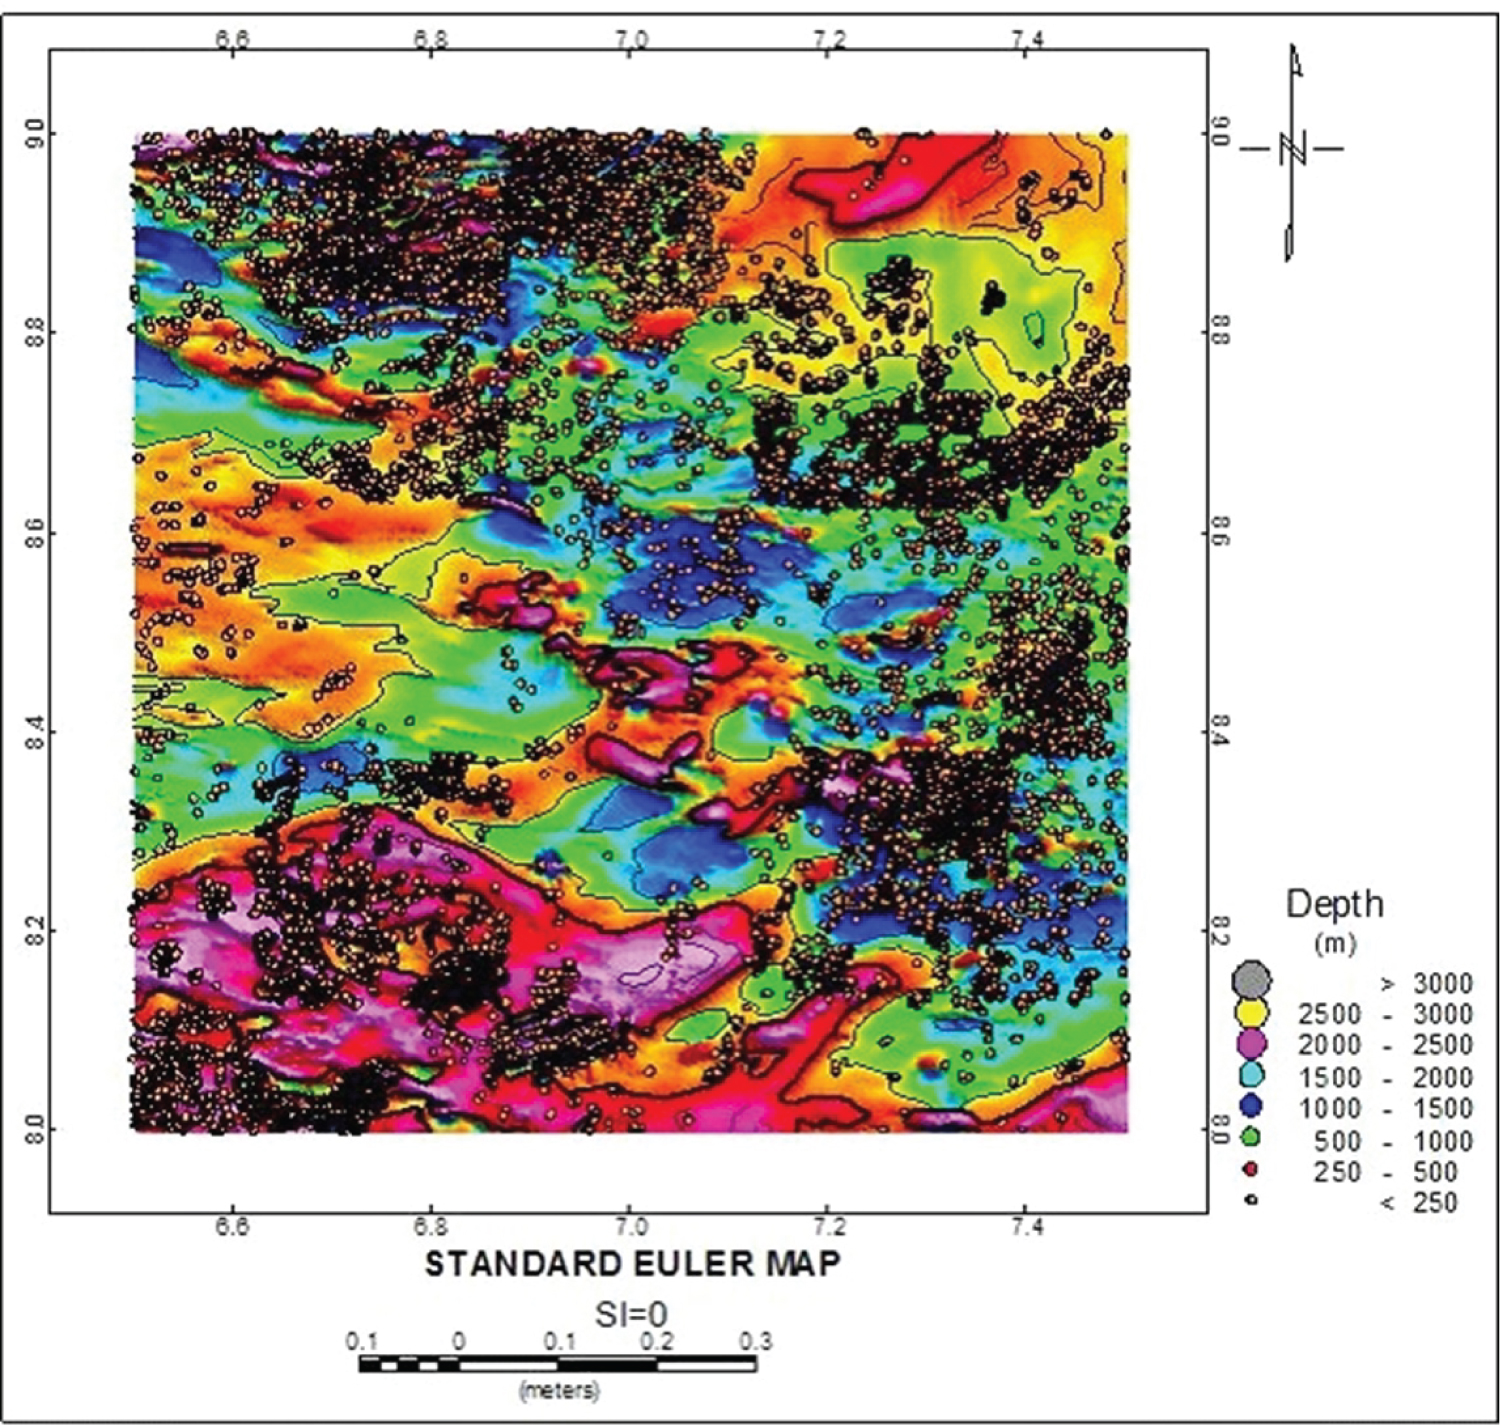
Figure 5: Standard Euler deconvolution depth....
Standard Euler deconvolution depth solution plot draped on the coloured total magnetic intensity contour map of the study area. (Structural Index: 0.0). From Nwofor, et al. [9].
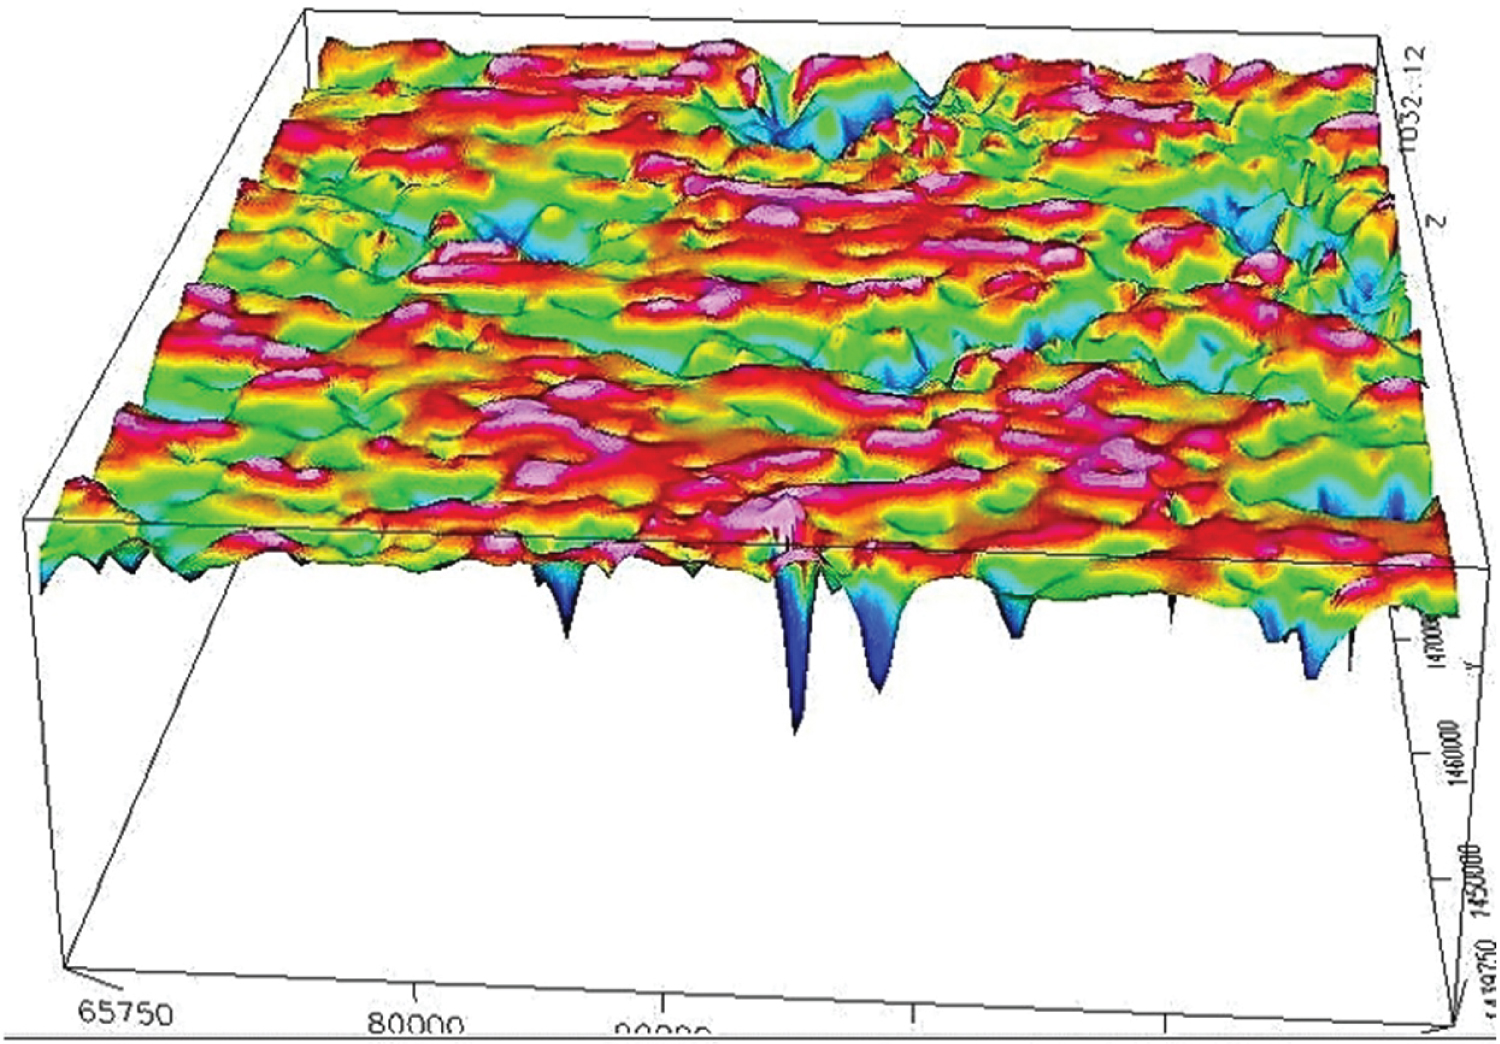
Figure 6: 3D depth to basement map within the....
3D depth to basement map within the study area. From Ofoha, et al. [10].
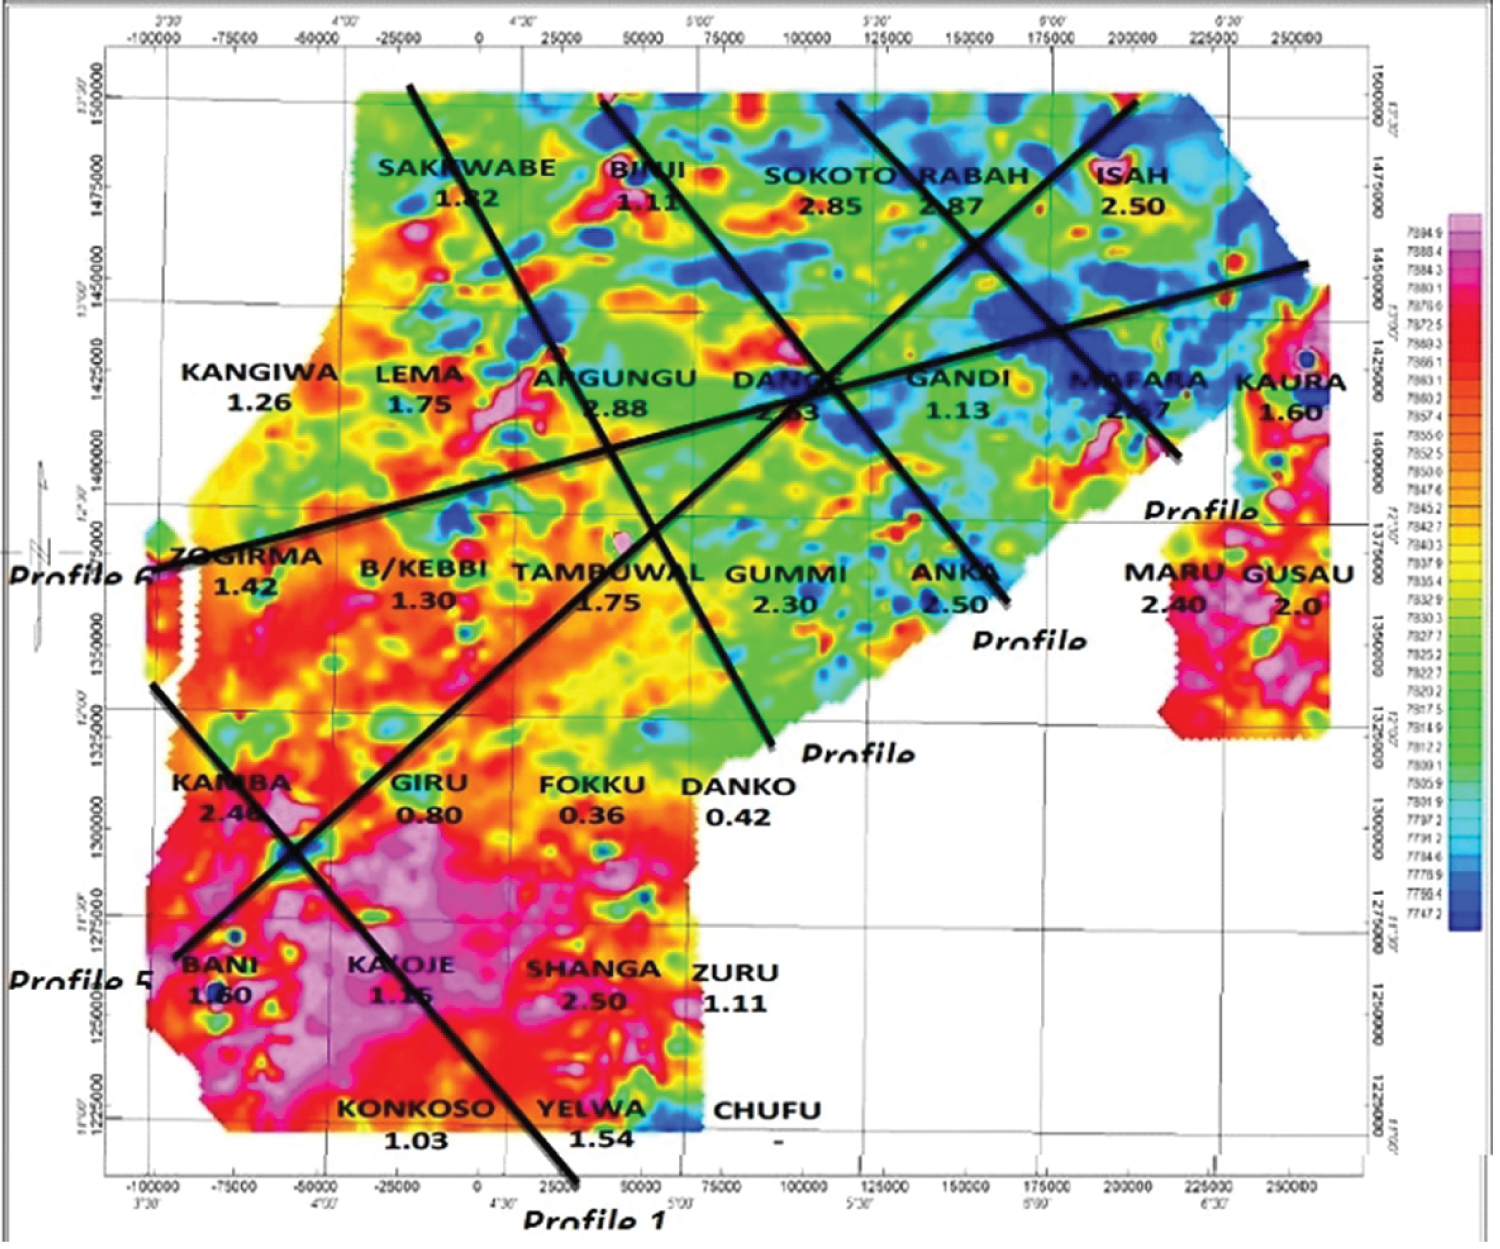
Figure 7: The depth estimates superimposed...
The depth estimates superimposed on TMI, with the diagonal lines indicating the model profiles. From Bonde, et al. [11].
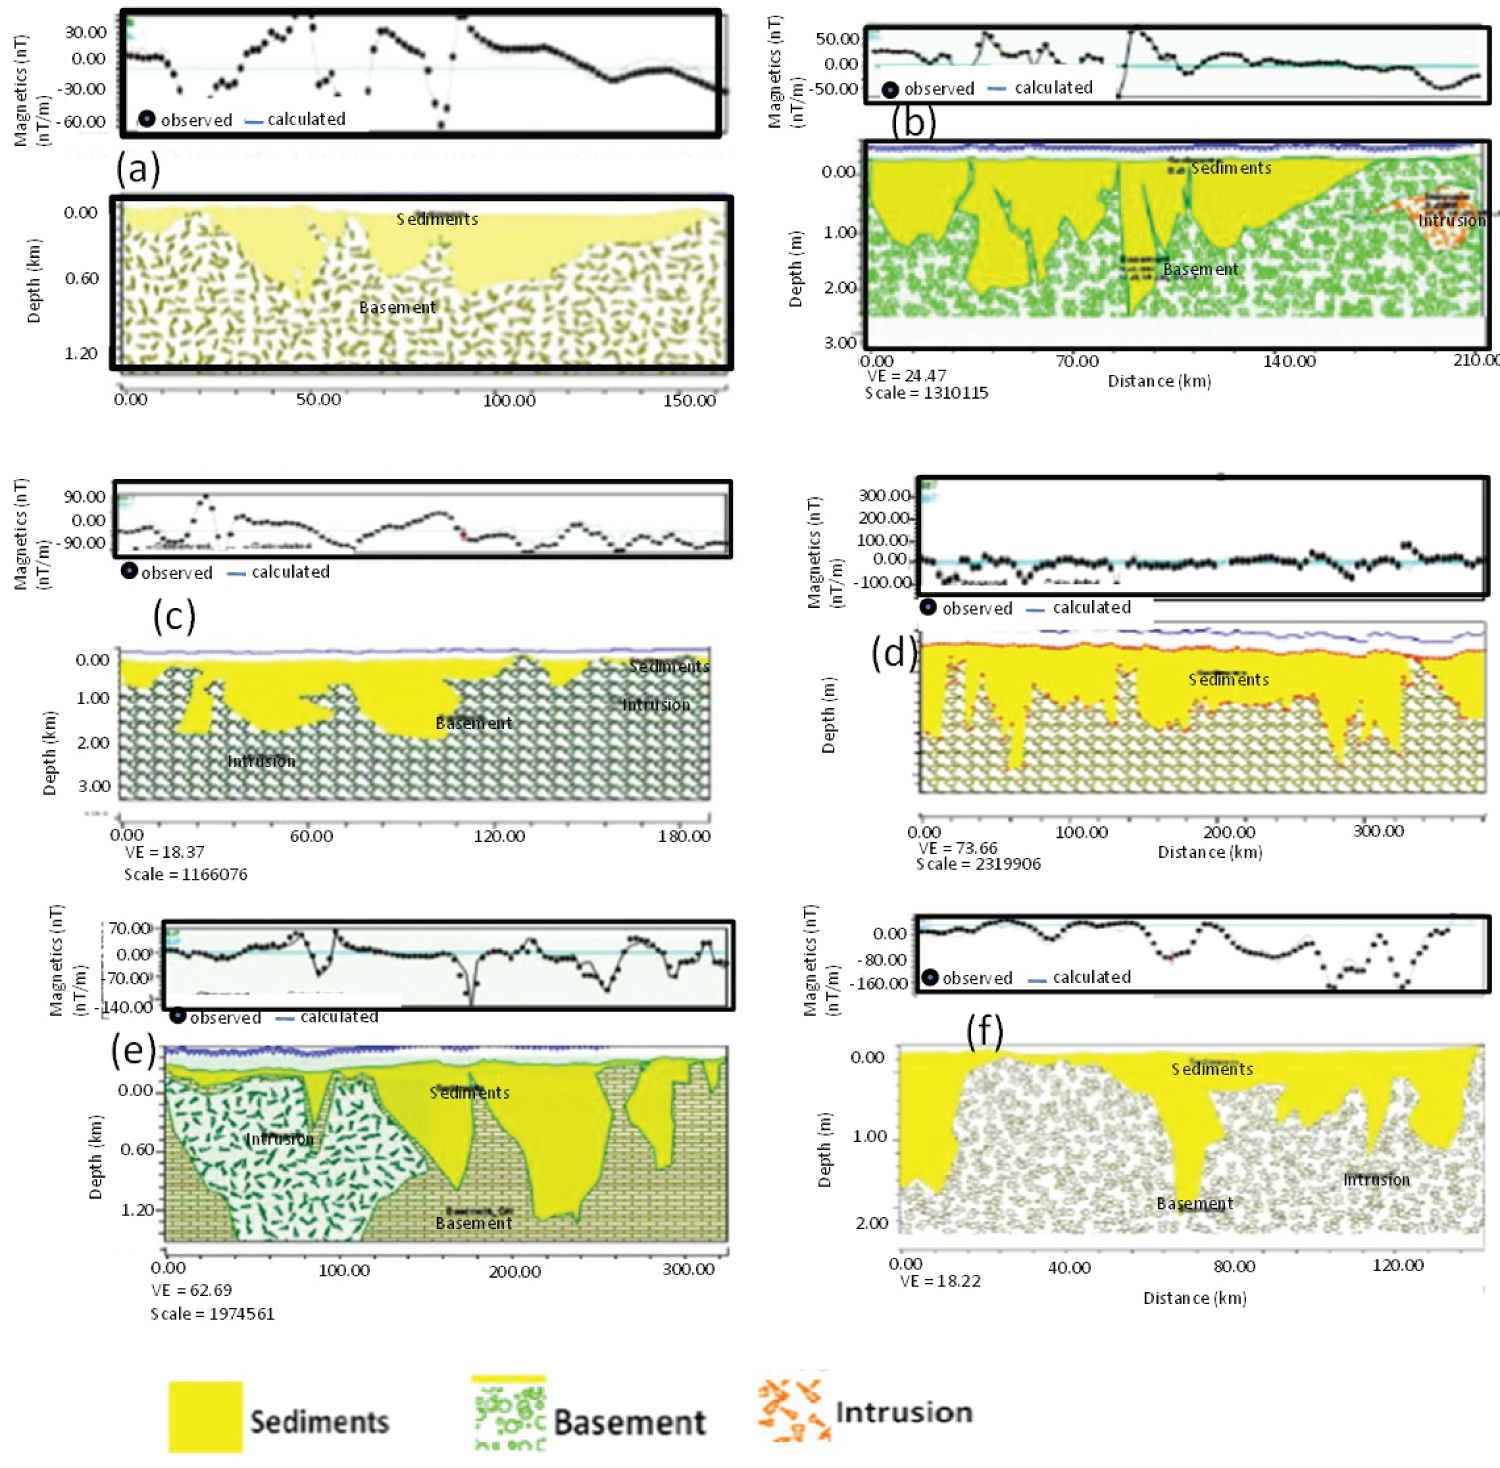
Figure 8: The models for the six profiles...
The models for the six profiles. a) Profile 1; b) Profile 2; c) Profile 3; d) Profile 4; e) Profile 5; f) Profile 6 accordingly. Modified from Bonde, et al. [11].

Figure 9: Cross-sectional view of the Bida ...
Cross-sectional view of the Bida Basin along the southeast-northwest profile. The red arrows indicate the direction of stress, while the thick red lines indicate horst and graben structures in the basin. Not to scale.
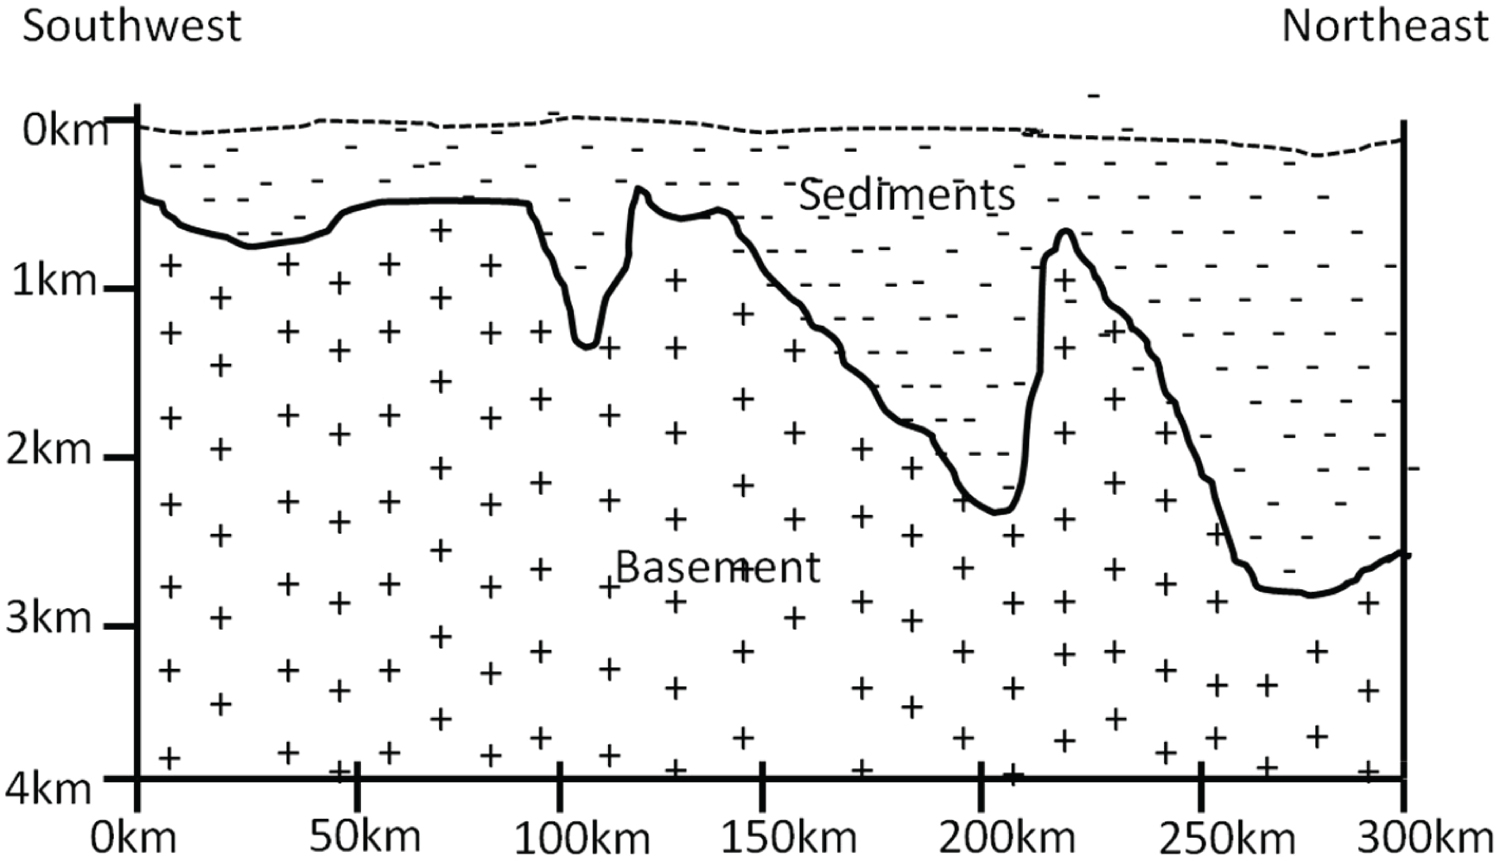
Figure 10: Cross-section through the Sokoto...
Cross-section through the Sokoto Basin along the southeast-northwest profile. Not to scale.
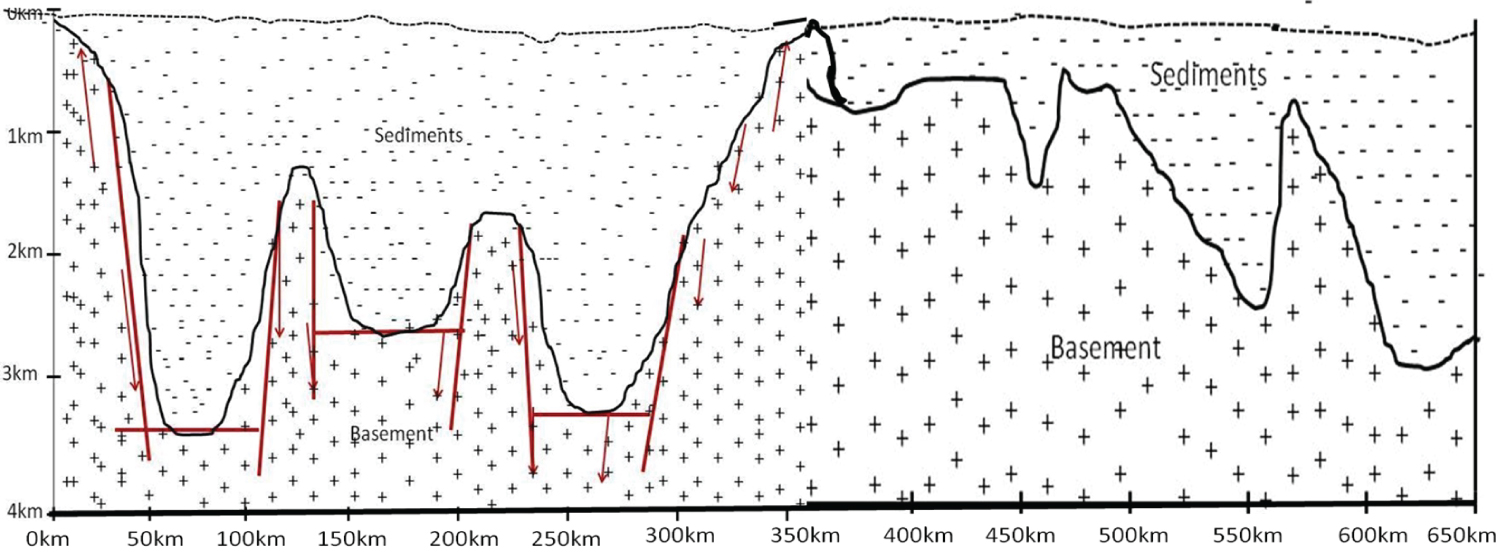
Figure 11: Cross-section through the Bida Basin...
Cross-section through the Bida Basin along the southeast-northwest profile and cross-section through the Sokoto Basin along the southeast-northwest profile. Not to scale.
References
- Udensi EE, IB Osazuwa (2004) Spectral determination of depths to magnetic rocks under the Nupe basin, Nigeria. Nigeria Association of Petroleum Explorationists (NAPE) Bulletin 17: 22-27.
- Tsepav MT, Mallam A (2017) Evaluation of depth to magnetic basement over some parts of the Nupe basin, Nigeria by source parameter imaging method using aeromagnetic data. International Journal of Science and Research Methodology 8: 120-136.
- Ojo SB, DE Ajakaiye (1989) Preliminary interpretation of gravity measurements in the middle Niger basin area, Nigeria. In: Kogbe CA, Geology of Nigeria. (2nd edn), Elizabethan Publishing Co., Lagos, Nigeria, 347-358.
- Ojo SB (1990) Origin of a major aeromagnetic anomaly in the Middle Niger Basin, Nigeria. Tectonophysics 85: 153-162.
- Udensi EE (2001) Interpretation of the total magnetic field over the Nupe basin in West Central Nigeria using aeromagnetic data. Ph.D. Thesis, Dept of Physics ABU, Zaria, Nigeria.
- Olaniyan O, Abbah U, Nwonye N, Alichi A, Udensi EE (2012) Interpretation of total magnetic intensity field over Bida basin. Nigerian Geological Survey Agency. Occasional Paper 15: 98.
- Yana SG, Deng J (2018) Evaluation of aeromagnetic anomalies over southern part of Bida Basin, West-Central Nigeria. International Journal of Scientific & Engineering Research 9: 330-346 .
- Megwara JU, Udensi EE (2013) Lineaments study using aeromagnetic data over parts of southern Bida basin, Nigeria and the surrounding basement rocks. International Journal of Basic and Applied Sciences 2: 115-124.
- Nwofor VU, Echetama OAI, Nkemakolam H, Theophilus ET, Edet IG (2018) Magnetic basement depth and structure over parts of Bida basin, Nigeria interpreted from 2D spectral analysis and 3D Euler deconvolution. Australian Journal of Basic and Applied Sciences 12: 1-9.
- Ofoha CC, Emujakporue G, Ngwueke MI, Kiani I (2016) Determination of magnetic basement depth over parts of Sokoto basin, within Northern Nigeria, using Improved Source Parameter Imaging (ISPI) technique. World Scientific News 50: 266-277.
- Bonde DS, Udensi EE, Momoh M, Rai JK (2014) The most probable sites for hydrocarbon prospects in Sokoto Basin, Nigeria. International Journal of Marine, Atmospheric & Earth Sciences 2: 11-27.
- Ajakaiye DE (1981) Geophysical and geological evidence for the Benue-Chad Basin cretaceous rift valley system and its tectonic implications. Earth Evolution Science: 110-125.
- Nur A (2000) Analysis of aeromagnetic data over the Benue Trough, Nigeria. Jour of mining and Geol 77-84.
- Akande SO, Ojo OJ, Ladipo K (2005) A field guide book. Musuro Publisher, 60.
- Obaje NG, Aduku M, Yusuf I (2013) The Sokoto basin of north-western Nigeria: A preliminary assessment of the hydrocarbon Prospectivity. Petroleum Technology Development Journal 3: 66-80.
- Braide SP (1992) Syntectonic fluvial Sedimentation in the central Bida Basin. Journal of Mining and Geology 28: 55-64.
- Onuba LN, Anudu GK, Chiaghanam OI, Anakwuba EK (2011) Evaluation of aeromagnetic anomalies over Okigwe area, Southeastern Nigeria. Research Journal of Environmental and Earth Sciences 3: 498-507.
- Labbo AZ, Ugodulunwa FX (2007) An Interpretation of total intensity aeromagnetic maps of part of south-eastern Sokoto Basin. Journal of Engineering and Applied Sciences 3: 15-20.
- Taufig S, Udensi EE, Mohammed SB (2014) Analysis of aeromagnetic data across Kebbi State, Nigeria. International Journal of Marine, Atmospheric and Earth Sciences 2: 42-51.
- Chikwelu EE, Ogbuagu FU (2014) Geotechnical investigation of soil around Mbaukwu gully erosion sites, South-Eastern part of Nigeria. International Journal of Emerging Technology and Advanced Engineering 4: 10-15.
- Thurston JB, Smith RS (1997) Automatic conversion of magnetic data to depth, dip, and susceptibility contrast using the SPI (TM) method. Geophysics 62: 807-813.
- Adeleye DR (1974) Sedimentology of the fluvial Bida sandstones (Cretaceous), Nigeria. Sedimentary Geology 12: 1-24.
- Nwajide CS (2013) Geology of Nigeria's sedimentary basins. CSS Books limited, Lagos, Nigeria, 565.
- Ojo SB (1984) Middle Niger Basin revisited magnetic constraints on gravity interpretations. A paper presented at the 20th Nigeria Mining and Geosciences Society Conference, Nsukka, Nigeria, Conference proceedings, 52-53.
- Kogbe CA (1989) The cretaceous and paleogene sediments of Southern Nigeria. In: Kogbe CA, Geology of Nigeria. (2nd edn), Rock View, (Nig.) Ltd, Nigeria, 325-334.
- Nwosu OB (2014) Determination of magnetic basement depth over parts of middle Benue trough by Source Parameter Imaging (SPI) technique using HRAM. International Journal of Scientific and Technology Research 3: 262-271.
- Adeniyi J (1989) The geology of the Mid-Niger Basin. Geology of Nigeria, (2nd edn), 283-287.
- Whiteman A (1982) Nigeria: Its petroleum geology, resources and potential. Graham and Trotman 1: 394.
- Ojo O, Akande S (2003) Facies relationships and depositional environments of the upper cretaceous Lokoja formation in the Bida Basin, Nigeria. Journal of Mining and Geology 39: 39-48.
- Ugbor CC, Emedo CO, Arinze IJ (2020) Interpretation of airborne magnetic and geo-electric data: Resource potential and basement morphology of the Ikom-Mamfe embayment and environs, South-eastern Nigeria. Natural Resources Research.
- Obaje NG (2009) Geology and mineral resources of Nigeria. Lecture notes in Earth Sciences. Springer Dordrecht Heidelberg, New York, London, 221.
Author Details
Auduson AE* and Onuoha KM
Department of Geology, Federal University Lokoja, Nigeria
Corresponding author
Dr. Auduson AE, Applied Geophysicist, Senior Lecturer, Department of Geology, Federal University Lokoja, Nigeria.
Accepted: December 29, 2020 | Published Online: December 31, 2020
Citation: Auduson AE, Onuoha KM (2020) Cretaceous Bida and Sokoto Basins of Nigeria: Deducing Basin Architecture and Basement Topography from Aeromagnetic Data Analyses. Int J Earth Sci Geophys 6:043.
Copyright: © 2020 Auduson AE, et al. This is an open-access article distributed under the terms of the Creative Commons Attribution License, which permits unrestricted use, distribution, and reproduction in any medium, provided the original author and source are credited.
Summary
This paper presents review of the results of aeromagnetic geophysical works carried out over the Cretaceous Bida and Sokoto Basins of Nigeria. The objective of the study was to analyse multiple data from the isolated existing data for the two basins in order to determine the holistic basin architecture, and possible the topography of the basement underlying the two basins, as well as their structural trends and basin evolutions. To this end, structural trends analysis; Lineament analysis; basement depth and structural analysis; determination of depth to basement and structural analysis carried over the two basins were reviewed. Trends analysis over southern Bida reveals four structural trends along the east-west, north-south, northeast-southwest and northwest-southeast directions. Lineament analysis reveals predominant trends of the lineaments occurring along east–west, north-south, northeast-southwest and northwest-southeast directions in the Bida Basin. In addition, it is inferred that the northeast-southwest trending Romanche Fracture Zone passed through a certain survey area of the Bida Basin. Depth to basement estimated over the Bida Basin indicated a range of values from 60.23m to 3.47 km. The sedimentary thickness of the Sokoto basin in general, appears to increase from south to north and with a maximum depth of 2.74 km. Analysis of various data from the two basins give the basement morphology, basin architecture and the basis for recommending the most prospective sites for hydrocarbon exploration in the basins.
Introduction
This review work reveals the information about the Bida and Sokoto basins of Nigeria formed during the Cretaceous period. A detailed look at the Cretaceous Basins in Nigeria is necessary because these basins represent the hinterland basins of Nigeria, which are needed to be explored in order to support the efforts of the Nigerian government and multinational companies to add hydrocarbon reserves. Geophysical works have been conducted in the basins using magnetic and other methods several earlier researchers. Udensi and Osazuwa [1] as indicated in Tsepav and Mallam [2] used statistical analysis to estimate the average depth to the basement to be 3.39 km with a maximum depth of 4.5 km. Ojo and Ajakaiye [3] delineated the presence of a positive gravity residual centre in the Bida Basin. They attributed this to the presence of a shallow metamorphic basement of high density and intermediate composition. They also observed negative anomalies, which were ascribed to relatively great thicknesses of sediments, with maximum thickness ranging between 1.0 km and 2.0 km. Ojo [4] investigated a major east-west magnetic low, whose deep-seated structures dominate the southern part of the basin with depths to basement varying between 4.0 km and 6.0 km. Udensi [5] identified the landward prolongation of St. Paul and Romanche fracture zones as lineaments passing through the northern and southern parts of Bida basin. In the spectral determination of depths to magnetic rocks in the Bida Basin, Udensi and Osazuwa [1] were able to corroborate the interpretations of Ojo and Ajakaiye [3] that outlined the basin as being bounded by a system of linear faults. Olaniyan, et al. [6] used manual and automatic depth estimation methods to determine the depth to basement within the Bida basin to be generally shallow with depths between 1 km and 1.50 km, with some deep pockets around Mokwa, Kudu, Kotonkarfe, Auna, Akerre and Bida, ranging from 2.50 km to 3.75 km.
The objective of this study was to integrate the core information about the two basins with respect to basin architecture, possible topography of the basement underlying the basin, structural trends and basin evolution using existing literatures. To this end, aeromagnetic geophysical papers were critically reviewed and analysed in order to achieve the principal objective. Thus, structural trends analysis from aeromagnetic data [7]; Lineament analysis from aeromagnetic data [8]; evaluation of depth to basement [2]; basement depth and structural analysis [9]; determination of depth to basement [10]; structural analysis [11]; were reviewed and analyzed from which the basin architecture as well as basement topography were depicted for the Cretaceous Bida and Sokoto Basins of Nigeria. The results of this study should help in making reliable recommendation for the most prospective sites for hydrocarbon exploration in the inland sedimentary basins.
Geology of Bida and Sokoto Basins
The Bida Basin is located in the west central Nigeria. It's among the least investigated sedimentary basins in the country. It is a linear intracratonic sedimentary basin of about 350 km long and 75 km to 150 km wide trending northwest-southeast and starting from Kontagora (in the north) to Lokoja (in the south) and is aligned closely orthogonal to the Benue Trough (Figure 1). It is detached from the basal continental beds of the Sokoto Basin by a narrow outcrop of the crystalline basement rocks in the west, and a straddling point with the Anambra Basin in the southeast. The basin has been divided into northern and southern Bida sub-basins, certainly due to great rate of facies changes across the sub-basins. The basin is a gentle down-warped trough with its origin closely connected to Santonian orogenic movement in the south east Nigeria and the Benue Trough. The origin of the basin is connected to sinistral offset along the NE-SW axis of the Benue trough which led to the reactivation of mega-shears in the Precambrian basement which created fault patterns trending North east - South west and North west to south east to form the Bida basin at high angle to the Benue Trough [12].
In the Campanio-Maastrichtian time, the South-Atlantic Tethys Sea transgressed through the Mid-Niger Basin [13]. The Southern Bida Basin comprises of Campanian-Maastrichtian Lokoja and Patti formations. The Patti formation is succeeded by Agbaja ironstone formation, which is lateral equivalent of the North west Bida formations of Sakpe ironstone, Enagi siltstone and Batati ironstone (sandstone). These successions together form lateral equivalents of the Campanio-Mastrichtian Mamu, and Nsukka formations in the adjacent Anambra Basin. The Campanian Basal Lokoja formation overlies the Precambrian crystalline basement migmatites, schist, and granites non-conformably. The Lokoja formation consists of conglomerates, sandstones and claystones; which were deposited in alluvial fan to shallow marine environments [14]. Overlying the Lokoja formation is the Maastrichtian Patti formation which consists of shale, claystone-siltstone and sandstones, deposited in a meandering river.
The Sokoto basin, also known as the Iullemeden basin, is located in the north western Nigeria. It consists predominantly of a great undulating plain with an average elevation varying from 250 to 400 m above sea level. The plain is occasionally interrupted by low mesas, with a low escarpment, known as the ''Dange Scarp'', is the most prominent feature in the basin and it closely reflect the geology [15]. The sediments of the IuIIemeden Basin were accumulated during four main phases of deposition: The Illo and Gundumi Formations non-conformably overlying the Pre-Cambrian Basement, made up of grits and clays and which constitute the Pre-Maastrichtian continental intercalaire of West Africa; the Maastrichtian Rima Group, consisting of mudstones and friable sandstones (Taloka and Wurno Formations) separated by the fossiliferous Dukamaje Formation, which overly the Illo and Gundumi Formations unconformably; The Dange and Gamba Formations (mainly shales) separated by the calcareous Kalambaina, which constitute the Paleocene Sokoto Group; The overlying continental Gwandu Formation, which forms the Post Palaeocene Continental Terminal. These sediments dip gently and thicken gradually towards the northwest with a maximum thickest of over 1200 m near the frontier with Niger Republic [15].
Method and Material
Trends and structural analysis
The structural regimes of the basins were evaluated with respect to the trends and lineaments emplacement in the basins based on the works of Megwara and Udensi [8] and Bonde, et al. [11] and Yana and Deng [7]. Total field aeromagnetic data collected by Nigerian Geological Survey Agency (NGSA) were utilized. Magnetic anomalies map, reduction to equator (RTE) map and residual map of the study region were generated. The residual map, magnetic closures and discontinuity were analysed qualitatively, from which magnetic lineaments were located. Trends were analysed using profiles or gridded data generally consisting of drawing lines on a map that may correspond to edges of structures, faults, or partitions of the data character. The map representing total magnetic field intensity indicating basement topography of the study region in the Bida Basin is shown in Figure 2. The map shows anomalies of high and low magnetic intensity value with predominant E-W, NE- SW and NW-SE trends and steep gradients which are distributed throughout the area. The areas of wide magnetic anomalies are at Baro, Gulu and Katakwa parts, bounded from two sides (north and south) by relatively steep magnetic gradients, suggesting the occurrence of significant deep-seated faults/fracture zones bounding these areas in the stated directions. The great gradient zones are described by a range of equidistant contour directions of same amplitudes, indicating deep-seated shear zones [16], along which alignments of the minerals occur suggesting that these high gradient zones are major fracture/shear zones which influence mineral/hydrocarbon accumulations.
At another part of the Bida Basin, bounded by a longitude range of 4.5° E to 8.0° E and latitude range of 8.0° N to 9.0° N, with an area extent of about 33,275 km2, analysis of lineaments based on Euler Deconvolution (a model that relates the magnetic field and its gradient components to the location of the source), was done by Megwara and Udensi [8]. According to the authors, the TMI values range from a minimum of about 7630 nano tesla to a maximum of about 7930 nano tesla.
Figures 3a and Figure 3b show the magnetic lineaments trending in northeast-southwest and northwest-southeast directions based on correlation of the analytic signal and Euler deconvolution.
Further, another part of the Bida Basin covering the towns of Gulu, Koton-Karfi, Abaji, and Kuje (parts of FCT) between latitudes 8°00' N and 9°00' N and longitudes 6°30' E and 7°30' E was investigated by Nwofor, et al. [9] using the maps produced from Fugro Airborne Surveys in 2006 and 2007 for the National Geological Survey Agency. The high-resolution data (recorded at very small intervals of 0.1s each with 80 m normal flight height) maps were digitally filtered by the authors using the nonlinear filter (NLF). According to the authors, lineament analysis and structural interpretation of the HRAM data set reveal linear features with directional attributes of NW-SE, NE-SW, N-S and E-W directions with the NE-SW direction being dominant.
In a study of the North-eastern part of the Sokoto basin, bounded by Latitude 5° N and 5°30' N and Longitude 13° E-13°50' E with an approximate area of about 3400 km2, Ofoha, et al. [10] use the Improved Source Parameter Imaging method (ISPI), to investigate the magnetic anomalies. The lineament map highlights weakness zones involving faults and dyke like structures which majorly trend in the E-W direction. Regionally, the map reveals minor and major magnetic anomalies trending in the NE-SW, NW-SE and E-W direction respectively, similar to the pattern of lineaments occurrence in the Bida Basin. The prominent E-W directional trend is typical of Pre-Pan African trending fault characterized by little brittle deformation which resulted in the development of conjugate strike-slip fault systems while the weak NE-SW and NW-SE trend is believed to be related to the Pan African Orogeny [17]. The result is in consonance with those obtained by [18-20]. The residual magnetic field map contains anomalies and magnetic discontinuities with dominant E-W trend. Little NW-SE and NE-SW structural trends truncated by the E-W structures are however be seen at the western and eastern portion of the area. The dominant E-W and minor NE-SW, NW-SE structures represent fault and/or fracture zones within the study area. Thus, an older E-W tectonic trend is suggested within the area.
Determination of basement topography
Using data (2009 IGRF corrected aeromagnetic data) acquired from the Nigeria Geological Survey Agency, Tsepav and Mallam [2] determined the depth to magnetic basement of a part of the Bida Basin with Source Parameter Imaging (DPI) as a depth determination method. The study area is situated within latitude 8°00' N-10°00' N and longitude 4°30' E-7°00' E and covered by 10 aeromagnetic data sheets. SPI Method, developed by Thurston and Smith [21], is a technique that uses an extension of the complex analytic signal to estimate magnetic depths was adapted. The method utilizes the relationship between source depth and the local wave number (k) of the observed field, which can be calculated for any point within a grid of data through horizontal and vertical gradients [21] with the depth usually displayed as an image. Figure 4 shows the processed and interpreted aeromagnetic data indicating the depth to basement for the Bida Basin, divided into three zones according to their extents and depths. The results reveal that depth solutions ranging from about 60.23 m to 3.35 km within the study area. According to the authors, the pink areas indicate the shallowest portions of the basin, while the blue portions highlight the deepest pockets. The trend of the deep pockets is observed to lie from NW to SE, which corroborates the observed trend of the direction of the basin itself.
It was also observed from the grid statistics that a greater portion of the basin has its depth ranging from 293.65 m to 684.66 m, indicating that the basin is generally shallow. This result corroborates the findings of other previous results. The authors [2] opined that the observed deep pockets scattered within the basin (shown in blue colour), might be either due to magnetic basement located at such magnificent depths or possibly due to the presence of intrusions and outcrops of ores, which host iron minerals. This is because Obaje, et al. [15], Adeleye [22] and Nwajide [23] have reported that the basin consists of iron stones, which are highly magnetic in nature.
Nwofor, et al. [9] also evaluated depth to basement in the Bida Basin using 2D Spectral Analysis and 3D Euler Deconvolution over an area within latitudes 8°00' N and 9°00' N and longitudes 6°30' E and 7°30' E. The workers divided the study area into 16 overlapping blocks with spectral analysis done on each block of a window dimension 27.5 km × 27.5 km. They also used Fourier analysis to transform the digitized aeromagnetic data from the space domain to the frequency domain where energy spectral analyses were carried out. The results of the spectral analysis of the residual field of the high-resolution aeromagnetic data revealed a two-depth source model represented as D1 and D2, in which D1 represents the depths to the shallow magnetic sources and D2 represents the depth to the deeper sources identified as magnetic basement depth. Basin architecture and basement morphology of the study area were clearly depicted through the 3D contour maps of the shallow magnetic depth (D1) with depth range from 0.138 km to 0.935 km with an average depth value of 0.583 km, which is the shallowest overburden thickness in this section of the basin under review. Similarly, the deeper magnetic basement (D2) has depth ranges from approximately 1.86 km to 4.264 km with an average basement depth of 2.723 km.
The Euler deconvolution map (Figure 5) shows the locations and depths of subsurface anomalies using structural index 0 and indicating the depths to the magnetic contacts from this map were generally below or equal to 250 meters. The shallow depth solution of ≤ 250 m is a pointer that the topmost Agbaja Formation is a great host of magnetic substances.
The results of this work are in line with the works of Ojo [24], who did a gravity study of the Bida Basin and got an estimated maximum thickness of the sedimentary sediments at about 3.5 km in the central axis; Kogbe [25], who infers that the total thickness of Cretaceous sediments in the eastern portion of southern Nigeria is about 3.3 km and Udensi and Osazuwa [1], who shows that an average sedimentary fill of the southern and central parts of the basin is about 3.4 km with basement depth of up to 4.7 km through a spectral analysis of the residual maps of the total magnetic field maps in different sections of the basin. In general, the depths to basement in the basin increase centre-ward from the flanks of the basin.
In Sokoto Basin, investigation of North-eastern part of the basin, bounded by Latitude 5°N and 5°30' N and Longitude 13°E-13°50' E, by Ofoha, et al. [10], determination of depth to basement was also done using the Improved Source Parameter Imaging method (ISPI). According to the authors, the ISPI method is an improvement technique on the Source Parameter Imaging method, capable of extending the method to horizontal cylinders and at the same time allows the most appropriate model to be determined automatically. The regional-residual separation and the ISPI method applied on the composite map generated the the ISPI image maps (Figure 6). The Figure reveals two magnetic source models, namely the long (deep) spikes and the short (shallow) spikes. The long spikes (represented with the blue colour) show areas with thicker sediments that are deeply lying within the basement complex. These thick sediments range from 1175.4 m to 3384.4 m but with an average depth of 1917.025 m. This magnetic basement depth is synonymous to depth of overburden sediment which has a very important significance as to the hydrocarbon generation potential [26].
The short spikes (represented by the magenta, yellow, orange and green colours) have sediment thickness ranging from 54.1 m to 1084 m with an average value of 471.72 m. These short spikes highlights shallow seated magnetic bodies that have intruded unto the sedimentary cover. A thickness average of 1917.025 m and 471.72 m for the long spikes and short spikes respectively is validated by the result of other researchers within the Sokoto Basin, as it falls short of the average thickness needed for the accumulation of oil and gas.
In an attempt to investigate the most probable Sites for hydrocarbon prospectivity in the Sokoto Basin (situated between latitudes 10°30'' N to 14°00″ N and longitude 3°30″ E to 7°00″ E with an estimated area of 59,570 km2), Bonde, et al. [11] carried out the spectral depth analysis involving generation of the residual, total magnetic intensity and residual magnetic intensity maps. As shown in Figure 7, the northern part of the Sokoto basin characterized by low magnetic intensity values (dark-green-blue colour); southern part, dominated by high magnetic intensity values (red colour) and zone of medium magnetic intensity values (yellow-orange colour). Based on the analysis by the authors, the high magnetic intensity values are caused probably by near surface igneous rocks of high values of magnetic susceptibilities. The low amplitudes are most likely due to sedimentary rocks and other non-magnetic sources. The sedimentary thickness of the Sokoto basin in general, appears to increase from south to north. Depths to magnetic basement range from 0.36 km in the southern part to 2.85 km at the north-western bordering with Niger (with the deepest section of the Iullemeden Basin).
The workers did a Profile Modelling involving six profiles drawn perpendicular to identified features and selected anomalies as shown in Figure 7. Profile 1, which is about 200 km long with a maximum sedimentation thickness of 0.85 km is characterised by low sedimentation. The sedimentation shows a gradual decrease southeast. The profile 2 is approximately 210 km long, which is drawn along the southwest-northeast direction in the middle section with the sedimentation thickness of 2.7 km, being the area of highest sedimentation obtained from 2D modelling. Profile 3 is a approximately 180 km long, with sedimentation thickness of 1.6 km, while profile 4 is the longest profile of length of approximately 400 km with sedimentation observed to be generally less than 1.0 km except few depressions that were 1.2 thickness. Profile 5 is approximately 300 km long and with maximum thickness of 1.4 km, while profile 6 is about 160 km long with a thickness of 1.8 km and another portion of sedimentary thickness of approximately 2.2 km. The results of this profile model shown in Figure 7 agree very well with the results of the spectral depth analysis. As observed from Figure 7, the upward continuation map at 15 km at Isah and Rabah areas of the Sokoto sedimentary basin shows the highest sedimentation in the whole area. The depth models of the six profiles are as shown in Figure 8a, Figure 8b, Figure 8c, Figure 8d, Figure 8e and Figure 8f.
Discussion
Structural analysis: Structurally, the evolution of the Bida Basin is unclear. However, from the depth to basement predicted in the various reviewed data it is deduced that the Bida Basin is underlain by an asymmetrical, graben system with major northwest-southeast faults. Previously, researchers have proposed three theories about the evolution of the basin:
• Simple Sag model related to the evolution of post-Santonian Anambra basin [27];
• Strike Slip model related to Basement mega shear tectonics in Gboko-Kotangora regional transform fault system [16,28];
• Rift model related to Benue trough tectonics and gravity-aeromagnetics studies [29];
The series of regional basement-related lineaments observed in the basin are related to the deeper regional rift faults. Using principles of interpretation of airborne magnetic data [30], the review under consideration show a series of well-defined aligned crustal highs and lows and some magnetic spikes. These features serve as the basis for inferring the basement topography and for the definition of regional northwest-southeast faults, throw directions, and to highlight the rift tectonic setting. Also, it can be asserted that the subsurface fault trends run the same direction (northwest-southeast) as the fractures.
Sedimentary thickness: On the basis of the values of the depth to basement at different locations (293.65 m to 684.66 m; 0.138 km to 0.935 km with an average depth value of 0.583 km; 1.86 km to 4.264 km with an average basement depth of 2.723 km; 60.23 m to 3.35 km), average estimated depth is about 3.6 km in the Bida Basin. Although, the basin is relatively shallow, it is characterized with rugged basement topography and undulating morphology. Thus, horsts and grabens at the deeper sections, say 3.5 km to 3.6 km, which are most likely developed during the Aptian-Albian rift phase exist in the basin. Consequently, three depocentres or sub-basins are predictable based on the possible horsts and graben structural settings (Figure 9): one depocentre between Kwali High and Bida high, one between Kwali High and southern Highs, and one between northwest-southeast Dalcada Ridge and northern Highs.
Similarly, in Sokoto Basin, sediment thickness range from 54.1 m to 1084 m with an average value of 471.72 m in shallow areas. Deeper sections have sediments range from 1175.4 m to 3384.4 m with average depth of 1917.025 m. Figure 10 shows the cross-section through the Sokoto Basin along the southeast-northwest profile. Figure 11 shows the cross-section through the two basins, indicating the basin morphology and basement topography deduced from the data integrated from the various sources.
Conclusion
Lineament analysis from aeromagnetic data based on the various works reviewed reveals predominant trends of lineaments occurring along the east-west, north-south, northeast-southwest and northwest-southeast directions in the Bida Basin. There are excellent correlation in trend, location between basement structures, and overlying sedimentary fault systems. These correlations strongly show that the sedimentary section has been influenced by the underlying basement architecture. The linear structures running northeast-southwest observed from the study are suggested as the continental extension of the Pre-Cretaceous oceanic fracture zone; that is, the Romanche Fracture Zone which runs along the trough axis beneath the sedimentary cover.
Depth to basement estimated using the source parameter imaging method over the Bida Basin gave a range of values from 60.23 m to 3.47 km, which corroborate the findings several previous works. The deepest part of the Bida basin (with magnetic basement depth range of 3.3-4.4 km, which falls within the range of oil window of a typical sedimentary basin) is at the south-eastern region (Abaji and environs) and hence, the most suitable area for hydrocarbon exploration. Thus, it is inferred that although, the basin is relatively shallow, it is characterized with rugged basement topography and undulating morphology.
Spectral depth analysis and modelling of the residual magnetic anomalies identified on the Total Magnetic Intensity (TMI) of Sokoto sedimentary Basin reveal a depth range from 2.29 km to 2.74 km. The sediments dip and thicken towards the northwest with the maximum thickness towards the border of the Republic of Niger. These deeper sections of the Sokoto sedimentary basin deduced from the reviews might be probable potential sites for hydrocarbon deposits and is therefore recommended to be subjected to further investigation based on seismic data. Thus, on the basis of analysis of structural trends and determination of depth to magnetic basement in both the Bida and Sokoto Basins, it is concluded that their basin morphologies and basement topographies are rugged, with very sharp variations. Although, these two Cretaceous inland basins seem to be relatively shallow, it is recommended that further effort for hydrocarbon exploration should be intensified with seismic data.
Acknowledgment
All previous workers, whose papers were used in the review work, particularly Yana and Deng [7], Megwara and Udensi [8], Tsepav and Mallam [2], Nwofor, et al. [9], Ofoha, et al. [10] and Bonde, et al. [11].