
International Journal of Earth Science and Geophysics
(ISSN: 2631-5033)
Volume 7, Issue 1
Research Article
DOI: 10.35840/2631-5033/1845

Article Formats
Estimation of Reservoir Capacity and Sedimentation Rate Using Direct and Indirect Methods
Table of Content
Figures
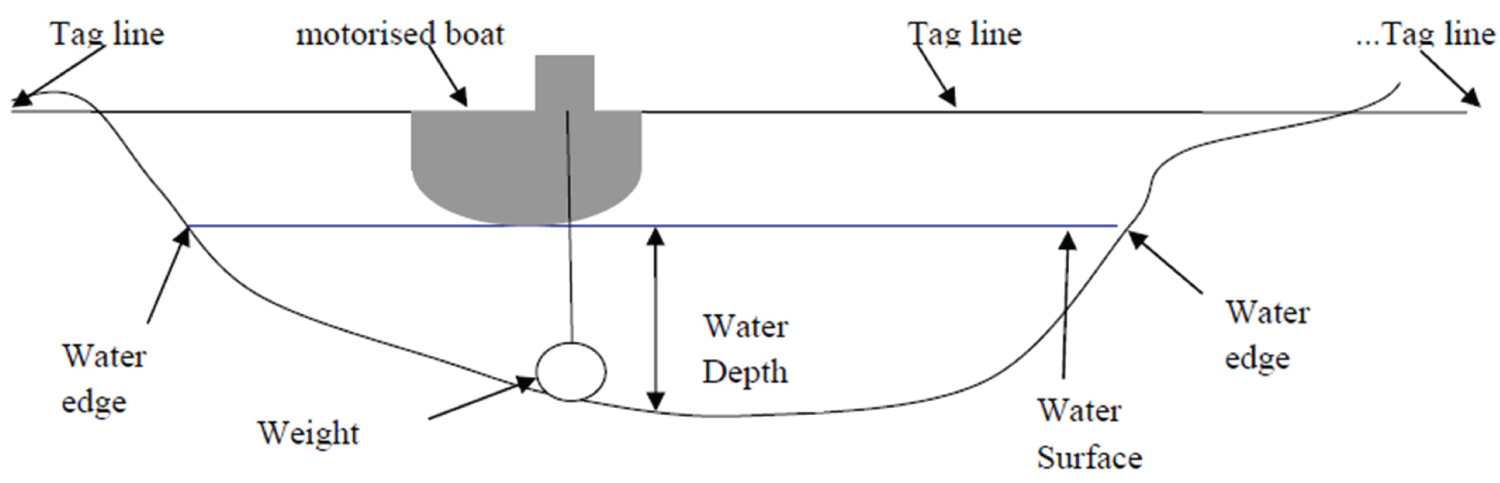
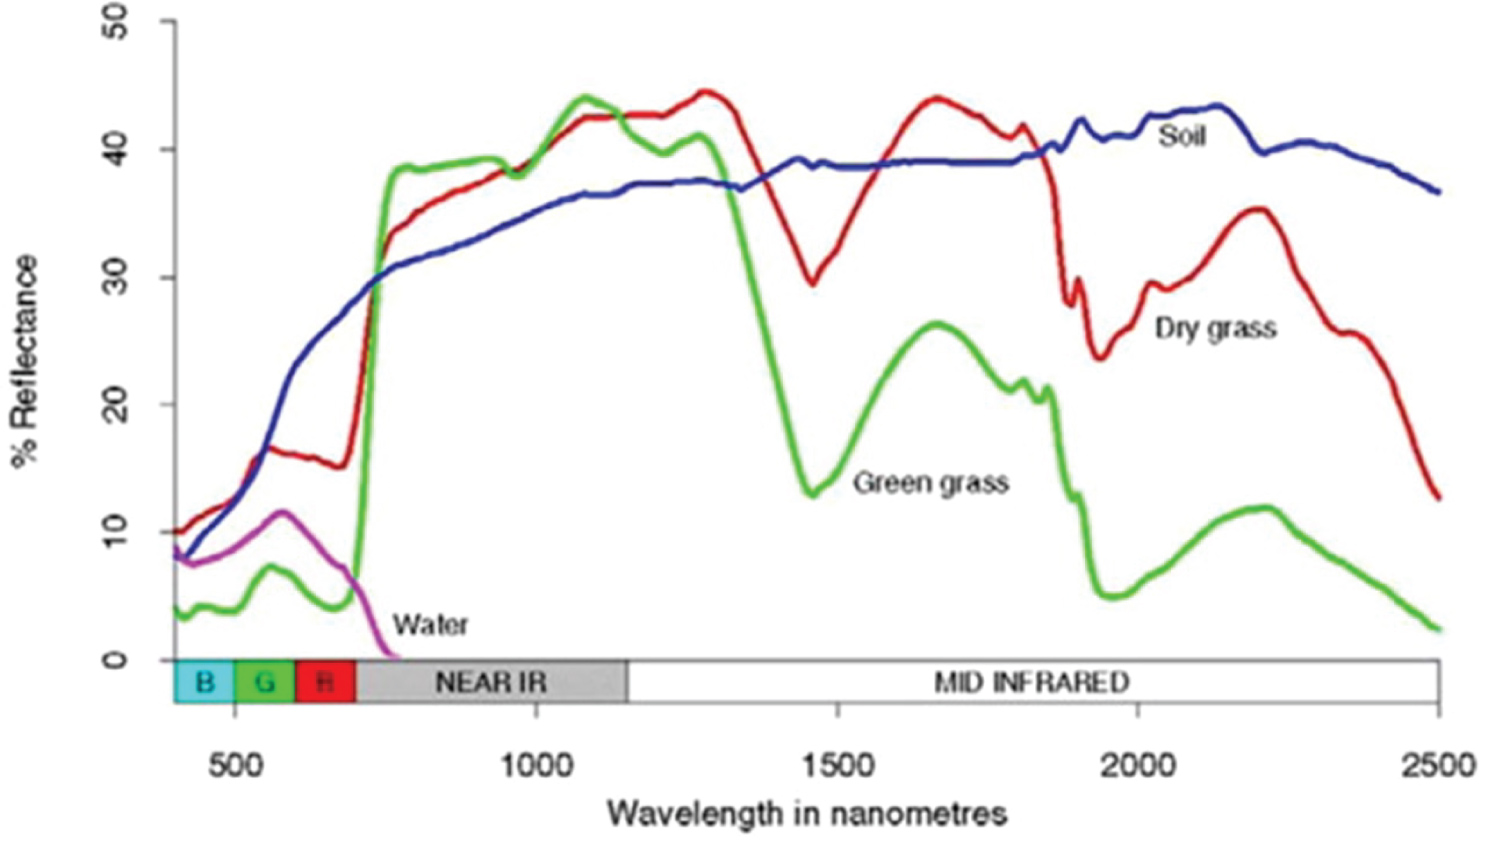
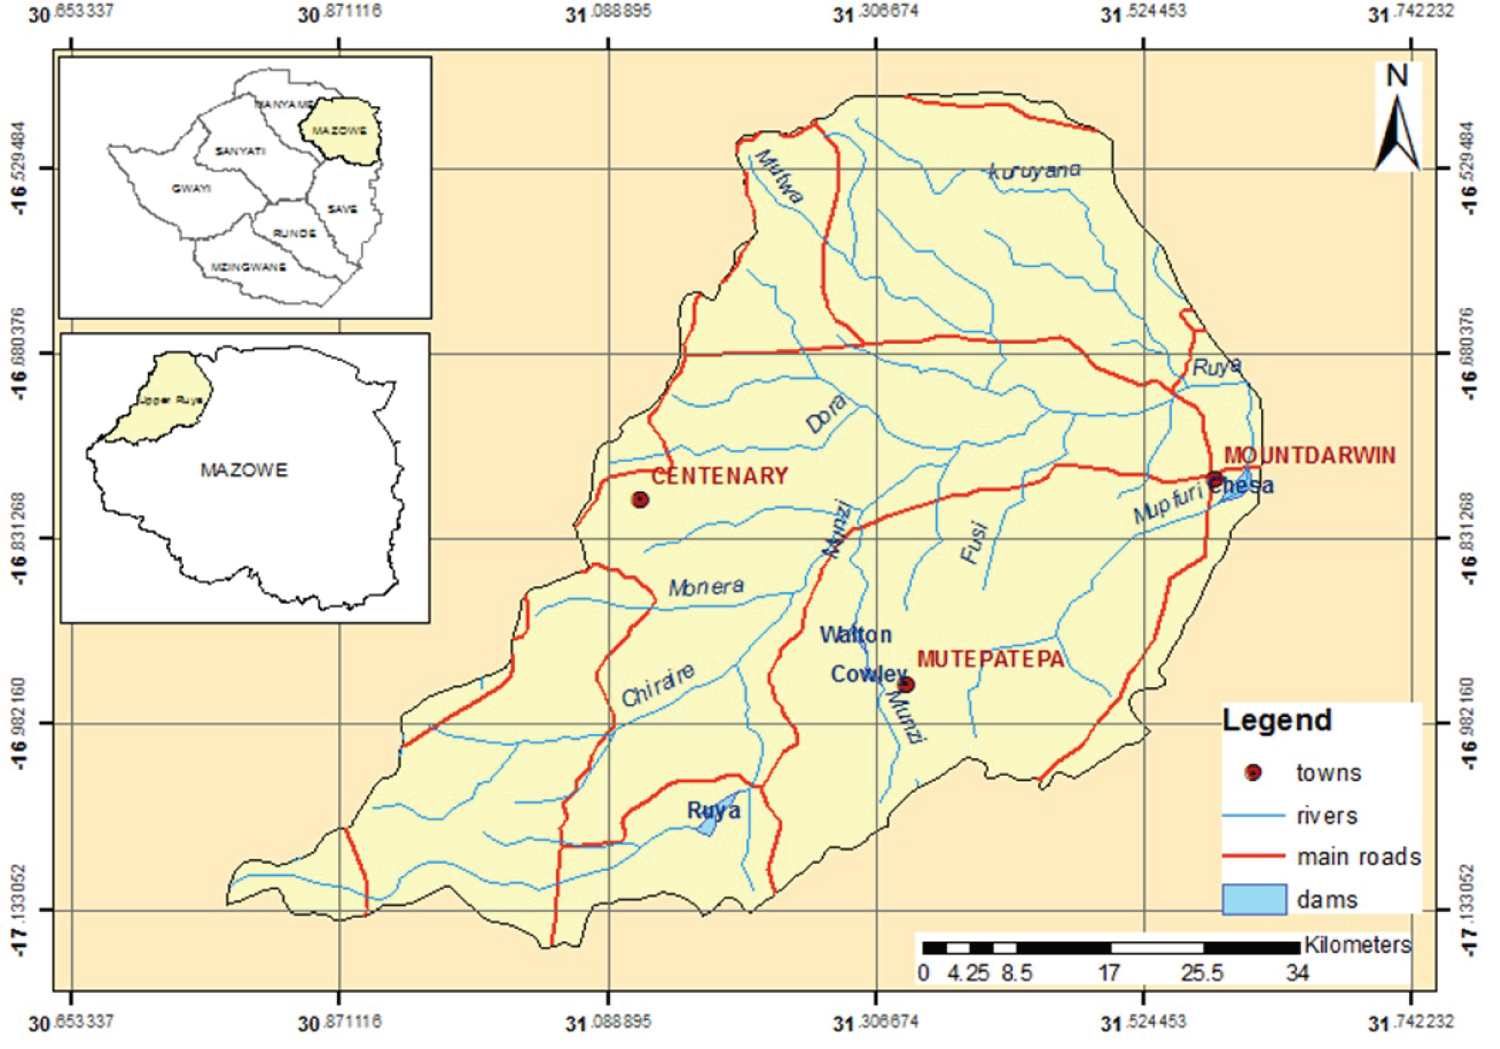

Figure 4: Flowchart for remote sensing data....
Flowchart for remote sensing data analysis (Source: Adapted from [8]).
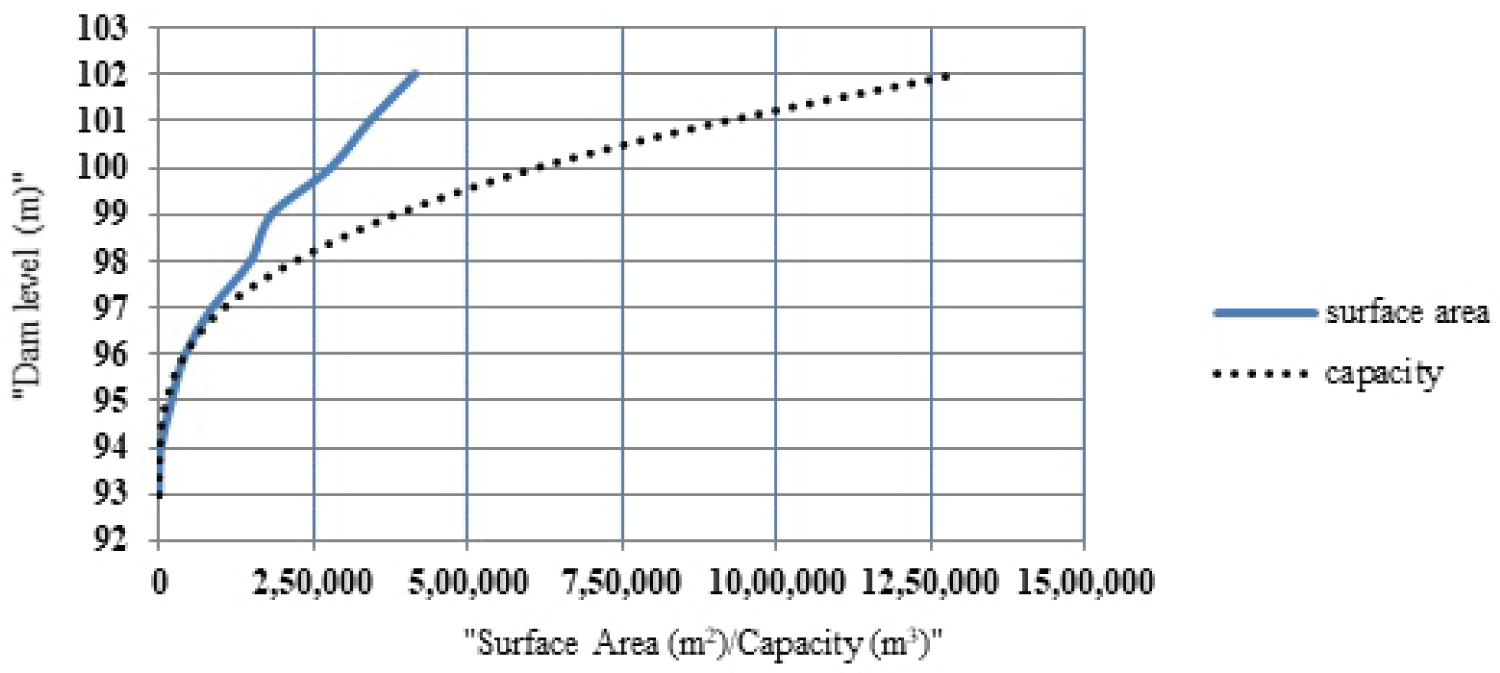
Figure 5: Surface area and capacity relationship....
Surface area and capacity relationship of Chesa dam in 2003.
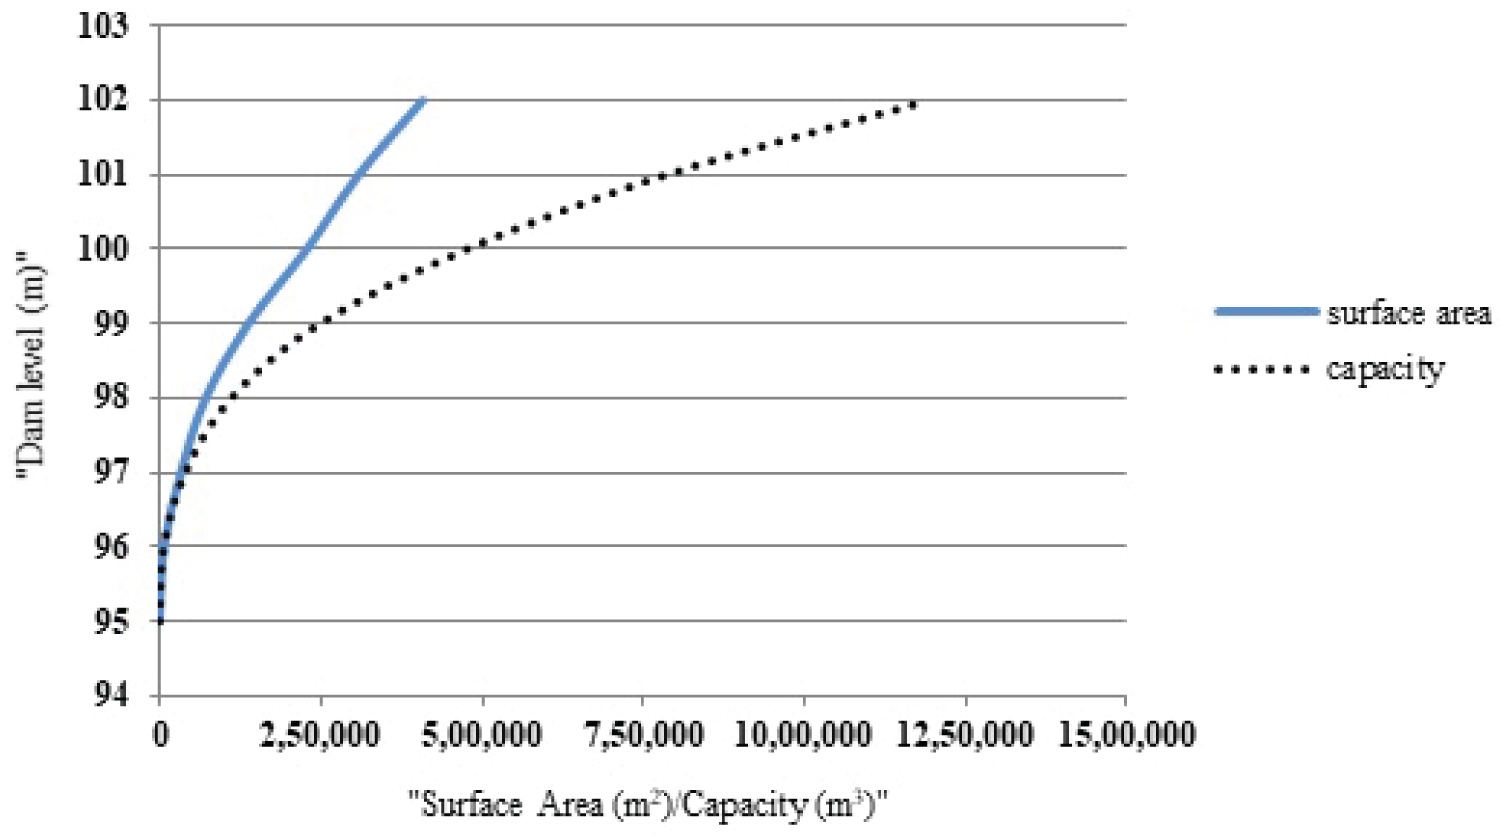
Figure 6: Surface area and capacity relationship....
Surface area and capacity relationship of Chesa dam in 2016.
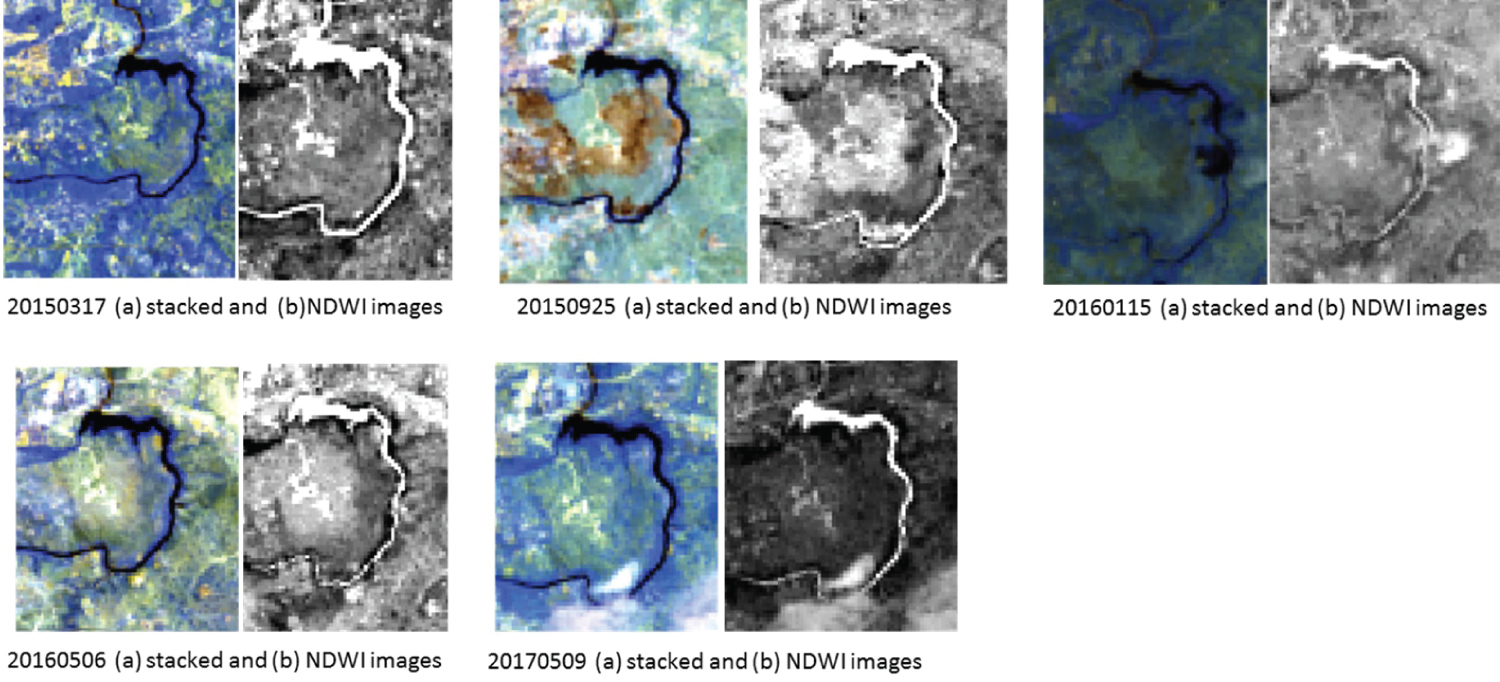
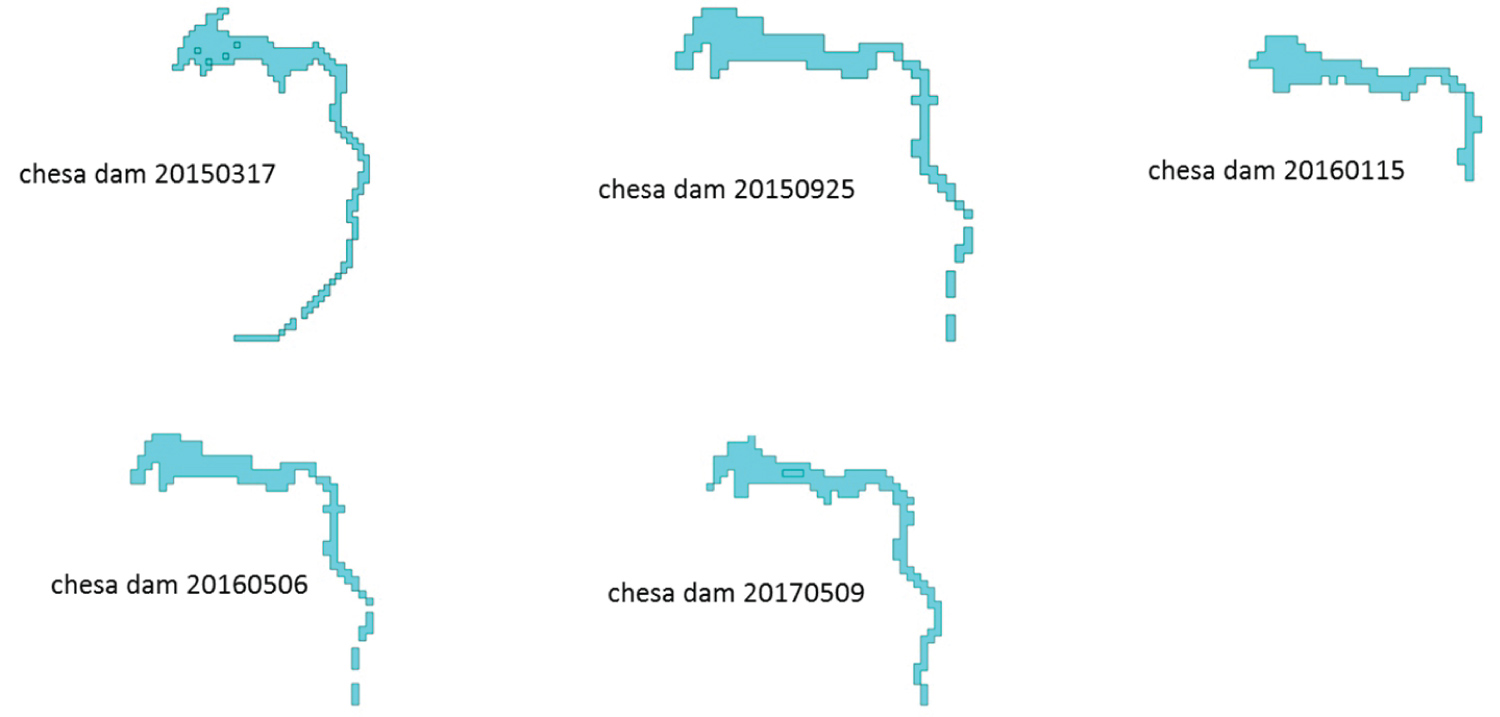
Figure 8: Water masks showing spread areas...
Water masks showing spread areas for the study datasets.
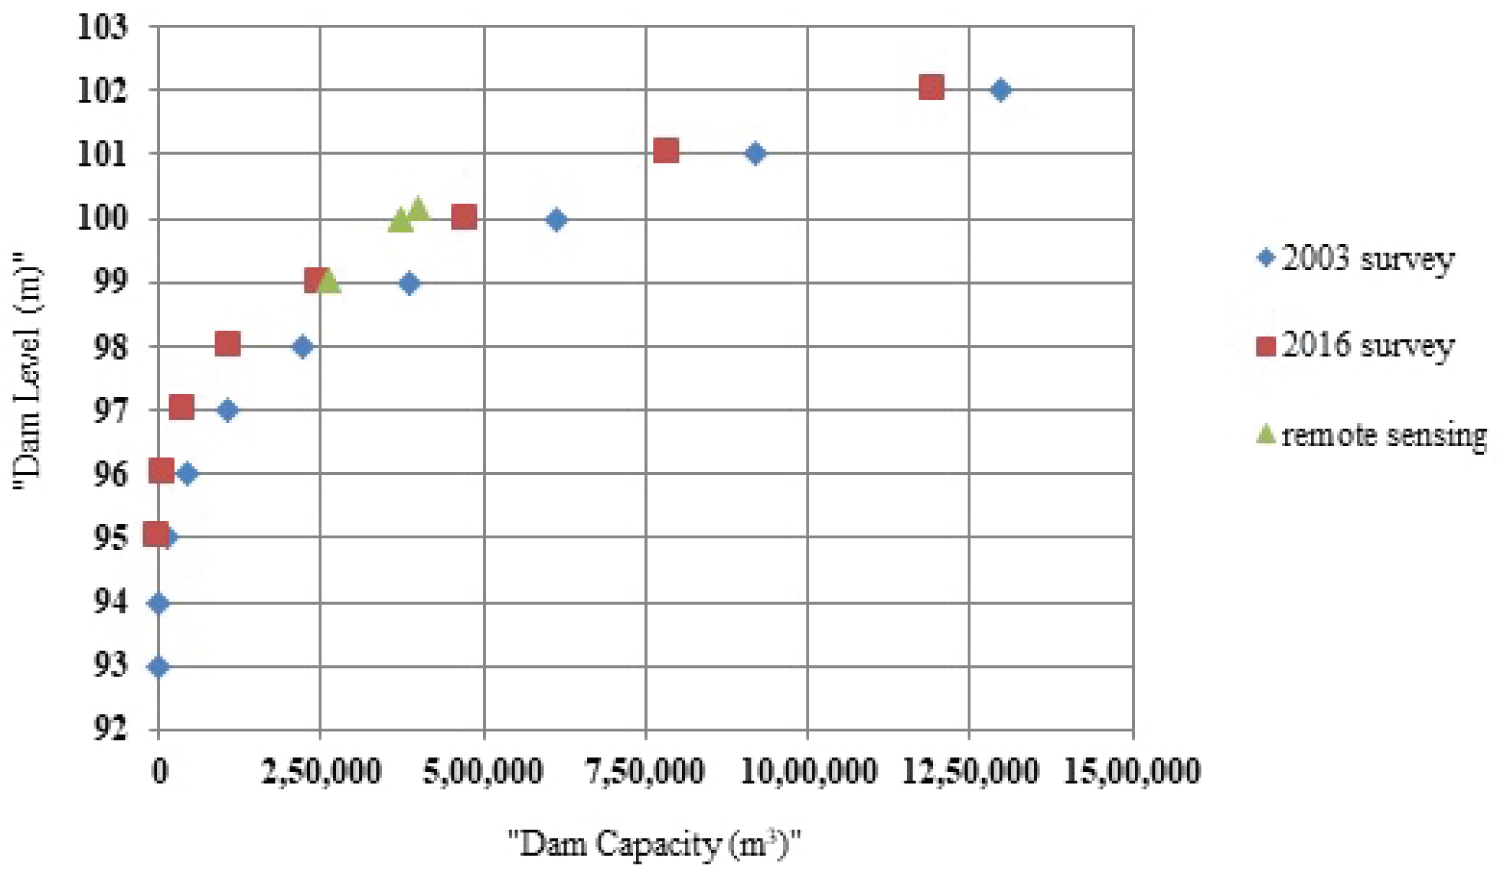
Figure 9: Comparison of results of hydrographic...
Comparison of results of hydrographic surveys and remote sensing techniques.
Tables
Table 1: Satellite data collected for the study.
Table 2: Water spread areas and reservoir capacities.
Table 3: Water spread areas and reservoir capacities.
Table 4: Sedimentation rates for Chesa dam.
References
- Bhavsa MV, Gohil KB (2015) Review on study of reservoir sedimentation by remote sensing technique. IJIRST: International Journal for Innovative Research in Science and Technology 1: 251-254.
- Ninija-Merina R, Sashik kumar MC, Rizvana N, Adlin R (2016) Sedimentation study in a reservoir using remote sensing technique. Applied Ecology and Environmental Research 14: 296-304.
- Shavkat R, Frédéric H, Masharif B, Mikael M, Philippe Le C (2011) Sedimentation of reservoirs in Uzbekistan: A case study of the Akdarya Reservoir, Zerafshan River Basin. Sediment Problems and Sediment Management in Asian River Basins. IAHS Publ 349: 1-11.
- Chomba IC (2017) Sedimentation and its effects on selected small dams in Lusaka Province, Zambia. University of Zambia, Zambia.
- Mupfiga ET, Munkwakwata R, Mudereri B, Nyatondo UN (2016) Assessment of sedimentation in Tuli-Makwe dam using remotely sensed data. Journal of Soil Science and Environmental Management 7: 230-238.
- Goel MK, Jain SK, Agarwal PK (2002) Assessment of sediment deposition rate in Bargi reservoir using digital image processing. Hydrological Sciences Journal 47: S81-S92.
- Vente J, Poesen J, Verstraeten G (2003) Evaluation of reservoir sedimentation as a methodology for sediment yield assessment in the Mediterranean: Challenges and limitations. Soil Conservation Protection for Europe 1315: 1475-1482.
- Avinash G, Chandramouli PN (2018) Assessment of reservoir sedimentation using RS and GIS technique: A case study of Kabini reservoir, Karnataka, India. International Research Journal of Engineering and Technology 5: 630-635.
- Patni BS, Patel HR, Bhangaonkar PD (2017) Assessment of sedimentation in Ajwa reservoir in the Vadodara Gujarat region using remotely sensed data. International Journal of Advance Engineering and Research Development, 16-20.
- (1998) The water act. Government of Zimbabwe, Zimbabwe 20: 24.
- Murinda SS (2011) Comparative assessment of performance of urban water supply systems in small towns of Zimbabwe: Case study of ZINWA and local council water supply systems. University of Zimbabwe, Zimbabwe.
- Mavima GA, Soropa G, Makurira H, Dzvairo W (2011) Sedimentation impacts on reservoir as a result of land use on a selected catchment in Zimbabwe. International Journal of Engineering Science and Technology 3: 6599-6608.
- Hawley JH (1931) Hydrographic manual. Hydrographic and Geodetic Engineer, US Coast and Geodetic Survey, Special Publication No. 143, USA.
- Wallingford (2002) Tollesbery fleet hydrographic survey report. Department of the Environment, Food and Rural Affairs.
- Pandey A, Chaube UC, Mishra SK, Kumar D (2016) Assessment of reservoir sedimentation using remote sensing and recommendations for desilting Patratu reservoir, India. Hydrological Sciences Journal 61: 711-718.
- Rango A (1975) Application of remote sensing to watershed management, Symposium on watershed management. American Society of Civil Engineers, USA.
- Dalu T, Tambara EM, Clegg B, Chari LD, Nhiwatiwa T (2013) Modelling sedimentation rates of Malilangwe reservoir in the south-eastern lowveld of Zimbabwe. Applied Water Science 3: 133-144.
- Rathore DS, Anju-Choudhary, Agarwal RK (2006) Assessment of Sedimentation in Harakud reservoir using digital remote sensing technique. Journal of the Indian Society of Remote Sensing 34: 377-383.
- ZINWA (2016) Hydrographic survey of Chesa Causeway dam 2016. Zimbabwe National Water Authority, Zimbabwe.
- Mazvimavi D, Williams H, Makurira H, Kusangaya S (2017) Assessment of surface water resources of Zimbabwe and guidelines for planning. Department of Water Resources and ZINWA, Zimbabwe.
- Al-Saady Y, Merkel B, Al-Tawash B, Al-Suhail QA (2015) Land use and land cover (LULC) mapping and change detection in the Little Zab River Basin (LZRB), Kurdistan Region, NE Iraq and NW Iran. Freiberg Online Geoscience 43: 1-32.
- (2019) Landsat 8 (L8) data users handbook. Version 4.0, LSDS-1574, Department of the Interior US Geological Survey, USA.
- ZINWA (2003) Hydrographic survey of Chesa Causeway dam 2003. Zimbabwe National Water Authority, Zimbabwe.
- Mohamed ES, Saleh AM, Belal AB, Gad AA (2018) Application of near-infrared reflectance for quantitative assessment of soil properties. The Egyptian Journal of Remote Sensing and Space Sciences 21: 1-14.
Author Details
B Nyikadzino1,2* and O Gwate2
1Zimbabwe National Water Authority, Mzingwane Catchment, Bulawayo, Zimbabwe
2Department of Geography and Population Studies, Lupane State University, Bulawayo, Zimbabwe
Corresponding author
B Nyikadzino, Zimbabwe National Water Authority, Mzingwane Catchment, P.O. Box 2880, Bulawayo, Zimbabwe; Department of Geography and Population Studies, Lupane State University, P.O. Box AC 255, Ascot, Bulawayo, Zimbabwe, Tel: +263292885191/2; +263778265417.
Accepted: May 04, 2021 | Published Online: May 06, 2021
Citation: Nyikadzino B, Gwate O (2021) Estimation of Reservoir Capacity and Sedimentation Rate Using Direct and Indirect Methods. Int J Earth Sci Geophys 7:045.
Copyright: © 2021 Nyikadzino B, et al. This is an open-access article distributed under the terms of the Creative Commons Attribution License, which permits unrestricted use, distribution, and reproduction in any medium, provided the original author and source are credited.
Abstract
Dams are important in harnessing flood water to enhance water availability during the dry season. Globally, most dams no longer hold the amount of water they were designed to hold due to sedimentation. The study sought to monitor sedimentation of Chesa dam in Upper Ruya Subcatchment, Mazowe Catchment in Zimbabwe. Five Landsat 8 OLI datasets for the period 2015 to 2017 were used. Remotely sensed sedimentation data was analysed using the NDWI method. Results indicated that Chesa dam's current capacity was 374,535 m3 against the design capacity of 1,150,000 m3 in 1991, indicating a loss of 775,465 m3. The annual rate of sedimentation for Chesa was estimated to be 2.7% and this suggests that the dam might completely sediment by year 2028. The difference between observed and predicted sedimentation rate was 0.36% indicating that remote sensing can be used for reservoir capacity estimation. It was concluded that there is rapid environmental degradation upstream hence the high rates of sedimentation. There is need for drastic interventions to enhance sustainable landuse practices upstream of the dam. The study confirmed that remotely sensed data and GIS technology can be used in determining reservoir capacity. Future studies may need to use finer resolution data for similar studies.
Keywords
NDWI, Landsat 8 OLI, Hydrographic survey
Introduction
Climate change has increased water supply uncertainty thereby putting more emphasis on the damming of rivers to meet power, food, industry and agricultural water demand [1]. As such, dams are important in capturing flood water during the rainfall season for use during times of water deficit [2]. Sedimentation of reservoirs reduces the amount of water available for use and takes away important water sources from needy communities. Shavkat, et al. [3] reported that globally between 0.5% and 1% of reservoir storage is lost to sedimentation each year. The rate of sedimentation is believed to be much higher in developing countries due to the obtaining land use practices [4]. According to Ninija-Merima, et al. [2] soil erosion, which often results from a host of bad land management practices like deforestation, streambank cultivation and others is regarded as one of the major causes of reservoir sedimentation. Loose soil upstream of a reservoir can be swept into the stream and end up in the reservoir, subsequently affecting reservoir capacity and water availability [1]. The loss of reservoir capacity especially in developing countries brings with it adverse environmental, social and economic problems to people relying on these dams [4]. Therefore, it is imperative that reservoir capacity re-assessment studies are regularly carried out. However, current methods of sediment analysis being employed in many countries are resource demanding in a context of financial and material resources scarcity [5].
Periodic assessment of reservoir capacity is important in water resources management as it helps in improving water resources management [6]. Reservoir capacity estimation and sedimentation analysis have commonly been conducted through the use of either direct or indirect methods of sediment quantification. According to Vente, et al. [7], direct methods refer to hydrographic survey techniques, which measure the actual sediments in the reservoir. Mupfiga, et al. [5] adds that indirect methods refers to sediment sampling and soil loss models which can be used to indirectly quantify expected sediment flow into a reservoir without conducting any direct measurements in the reservoir. Of late, remote sensing has come in as an important indirect method of sediment analysis and is proving to be a cheaper alternative [1,8].
Hydrographic surveys and sediment sampling methods, which the Zimbabwe National Water Authority (ZINWA) rely on, are known, for being costly and time consuming. It is against this backdrop that, Geographic Information Systems (GIS) and Remote Sensing technologies become useful cost-effective methods in tracing reservoir capacity changes as well as sedimentation rates [9]. Goel, et al. [6] advised that reservoir capacity should be monitored periodically to; quantify the annual capacity loss of a reservoir as a result of sedimentation, determine the spatial distribution of sediments in the reservoir, update the reservoir rating curves and tables as well as to evaluate the impact of watershed management practices in the reservoir upstream catchment. However, the frequency with which reservoir capacity and sediment estimation exercises are conducted depends on the methods employed as some methods are time consuming and resource intensive.
Silt surveying or reservoir capacity re-assessment of all national dams in Zimbabwe is a responsibility of ZINWA which is a national state agency for water resources planning, development and management [10]. Nationally ZINWA runs 125 small, medium and large dams which supply water for agricultural, industrial, mining, rural and urban uses [11]. In order to properly advise the country's citizens and policy makers on available water resources, ZINWA should keep updated records of reservoir live capacities and sedimentation rates. In developing countries it is understood that around 15% of reservoirs are filled up by sedimentation within 20 years of being constructed [5]. In countries like Zimbabwe and Tanzania, annual sedimentation rates are normally around 2.6% [5]. The prohibitive costs and time required to conduct hydrographic surveys often result in the surveys being carried out after long periods of around 20 years. Remote Sensing and GIS are, therefore, cost effective methods that can be used to re-assess the capacity and sedimentation rates of dams.
Locally, Mupfiga, et al. [5] used the Water Index (WI) method to assess sedimentation of the Tuli-Makwe dam built at the confluence of Tuli and Makwe rivers in the Mzingwane Catchment. Mavima, et al. [12] compared results of grab (sediment) sampling and hydrographic survey methods on a study of the Chesa Causeway (Chesa) dam. The study which was based on the grab sampling method revealed that the dam lost about 9% to sedimentation during the 2009-2010 rainfall season [12]. It can be seen that hydrographic surveys, sediment sampling and remote sensing techniques have been applied in previous studies conducted in Zimbabwe. The current study therefore seeks to apply Remote Sensing and GIS technology to determine reservoir capacity and sedimentation rate of Chesa dam which is a small dam built within a peri-urban area where poor land use management practices are rife. The results are then compared with those obtained through the use of hydrographic surveying. Basing on previous studies conducted elsewhere; it is hypothesised that both hydrographic surveying and GIS and remote techniques are applicable for the study area.
Hydrographic survey method
Hydrographic surveying involve establishment of cross sections, measurement of depths (sounding) along reservoir cross sections and recording and plotting the data to come up with surface area/capacity curves or tables [13]. Control pegs for the establishment of taglines are set, surveyed and referenced to the spillway level as the datum [12]. A number of taglines are set up at distances of between 50m and 150m apart to form cross sections depending on the reservoir stretch [12]. The same established transects or cross sections should however be surveyed again next time when another hydrographic survey is conducted so as to measure any sedimentation progression [14]. The different types of vessels used in hydrographic surveying include survey ships, tenders, survey launches and boats [13]. Mupfiga, et al. [5] adds that depth sounding is done either by dropping a weight to the bottom of the water and then measure the depth or by simply using eco-sounders (Figure 1).
The reading obtained is then subtracted from the spillway level to get the level at the bottom of the dam [5]. The points are then plotted on plain paper and used to come up with contour lines. These surface areas are traced and used to calculate volume between successive contour lines [12]. The prismoidal formula as shown by Equation 1 is often used for calculating the volume of water as suggested by [8];
Where;
V = volume between successive elevations
A1 and A2 = areas for elevations 1 and 2
h = difference between elevations 1 and 2
The cumulative volumes of the new surface areas represent the new capacity of the reservoir [5].
The NDWI Method
Two commonly used techniques for delineating water spread area involve visual and digital application [15]. The NDWI is a digital method used for delineating water spread area on remotely sensed images [15]. Within the visible range of the magnetic spectrum (0.4 μm-0.7 μm) water has a distinct reflectance pattern [6]. Figure 2 shows the reflectance patterns of water and other land cover types.
Absorption of radiation energy by water rises sharply in the Near-Infrared (NIR) band resulting in low reflectance values hence the reflectance signature is distinct from vegetation and bare surfaces [6]. This peculiar response of water to electro-magnetic radiation energy can therefore be used to identify and distinguish water pixels from other land cover types. Algorithms and indices like the NDWI are often used in the process of identification of water pixels as water has NDWI values of 0.44 and greater [6]. Goel, et al. [6] adds that absorption of electro-magnetic energy by water is highest in the NIR band and lowest in the Green band hence the following formula represented by Equation 2 is used for the identification of water pixels;
According to Pandey, et al. [15] the Green and NIR bands or wavelengths are used to maximise the reflectance properties of water through;
❖ Ensuring maximum reflectance of water through the Green band
❖ Ensuring minimum reflectance of NIR energy by water
❖ Ensuring high reflectance of NIR energy by non-water features like vegetation and soil
Landsat images from the Multi Spectral System (MSS) sensors are very mush applicable to water resources studies [16]. Dalu, et al. [17] and Rathore, et al. [18] applied the Normalised Difference Water Index (NDWI) and Water Index (WI) methods respectively for identifying and mapping water pixels. Studies in China which used the Landsat 8 Operational Land Imager (OLI) multispectral images produced results with accuracies of around 95%. Landsat Thematic Mapper (Landsat TM) data was recently used by Pandey, et al. [15] who applied the NDWI method to also assess reservoir sedimentation.
Locally, Mupfiga, et al. [5] used the Water Index method to assess sedimentation of the Tuli-Makwe dam built at the confluence of Tuli and Makwe rivers in the Mzingwane Catchment. Mavima, et al. [12] compared results of grab (sediment) sampling and hydrographic survey methods on a study of the Chesa Causeway (Chesa) dam. The study which was based on the grab sampling method revealed that the dam lost about 9% to sedimentation during the 2009-2010 rainfall seasons [12]. It can be seen that hydrographic surveys, sediment sampling and remote sensing techniques have been applied in previous studies conducted in Zimbabwe. Remote Sensing and GIS technology can therefore be applied for capacity determination and reservoir sedimentation analysis at Chesa dam thereby significantly reducing the cost and time of conducting these very important activities.
Materials and Methods
Study area
Chesa dam also referred to as Chesa Causeway or Mupfure dam was constructed in 1991 with a net capacity of 1,150,000 m3. The dam is located on latitude 16° 53" and longitude 31° 36" within the Upper Ruya Subcatchment of the greater Mazowe Catchment (Figure 3). At full supply, the dam covers 27.8 ha and drains a catchment area of 437.73 km2. The dam is located very close to the urban settlement of Mt. Darwin where it supplies the bulk of its water requirements for potable water use [19]. Chesa dam sits on Mupfure River and falls into Hydrological Subzone DM2 of Mazowe Catchment. Mupfure River has a Mean Annual Runoff (MAR) of 130 mm and Coefficient of Variation of Runoff of 95% [20]. People in the area strongly depend on their land and often engage in streambank cultivation and gold panning activities which are detrimental to the dam lifespan [12].
Methods
The study employed a longitudinal survey design. Longitudinal survey design allowed the use of data collected overtime between years 1991 and 2017. Dam level and remotely sensed data was used in the study and the Normalised Difference Water Index (NDWI) method was employed for data analysis. No new hydrographic surveys were conducted however; results of previous studies conducted by ZINWA in 2003 and 2016 as well as the dam's design capacity of 1991 were also analysed for comparison purposes. Landsat 8 OLI (Landsat 8 Operational Land Imager) data which is freely available on the internet was used for the study (www.earthexplorer.usgs.gov). The selection of a particular Landsat 8 OLI image was dependent on the availability of dam level data for the same day. As such, this affected the number and dates of Landsat 8 OLI images used in the study.
The NDWI is a digital method used for delineating water spread areas on remotely sensed images [15]. Within the visible range of the magnetic spectrum (0.4 μm-0.7 μm) water has a distinct reflectance pattern [6]. Absorption of radiation energy by water rises sharply in the Near-Infrared (NIR) band resulting in low reflectance values hence the reflectance signature for water is distinct from vegetation and bare surfaces [6]. This peculiar response of water to electro-magnetic radiation energy can therefore be used to identify and distinguish water pixels from other land cover types.
Data collection
Landsat 8 OLI images were downloaded from the United States Geological Survey (USGS) website (www.earthexplorer.usgs.gov) through the Earth Explorer. The images were carefully selected to coincide with periods when dam levels were measured (Table 1). Design surface area-capacity data for Chesa dam was collected from the ZINWA Hydrological Services Department [19]. This data was used to establish the surface area and capacity relationship of the dam on construction. Results from hydrographic surveys conducted at the dam in 2003 and 2016 were provided by the ZINWA Hydrological Services Department [19]. Daily dam water level data for Chesa dam indicating dam gauge plate height against the date when the reading was taken was also collected from the ZINWA (Table 1). The dam water level readings from the highest to the lowest capacities between years 2015 and 2017 were used to select the relevant Landsat 8 OLI images for download. The lowest dam level of 96.400m corresponded to imagery data for 15 January 2016 while the highest dam level of 100.150m corresponded with remotely sensed data acquired on 17 March 2015.
Data analysis
The NDWI method was adopted for the study. Quantum Geographical Information Systems (QGIS) software was used to analyse remotely sensed data. The general data analysis followed the framework depicted by Figure 4.
Pre-processing: Pre-processing steps were carried out using the semi-automatic plugin in QGIS before commencement of image analysis. Pre-processing steps that include radiometric calibration, top of the atmosphere (TOA) and geometric corrections were carried out. Radiometric correction was applied to images through the use of QGIS software to convert the Digital Numbers (DNs) of the images to radiances [21]. The following equation was used for radiometric calibration [22
Where:
b and a represents gain and bias
DN represents the band image thus;
where;
= TOA spectral radiance
= Band specific multiplicative rescaling factor from metadata
= Band specific additive rescaling factor from metadata
= Quantised and calibrated standard product pixel values (DN)
The radiometrically calibrated images were then corrected for TOA. According to Al-Saady, et al. [21], TOA correction converts the solar radiances to satellite reflectance using equation 5 [22];
where;
= TOA planetary reflectance without correction for solar angle
= Band specific multiplicative rescaling factor from metadata
= Band specific additive rescaling factor from metadata
= Quantised and calibrated standard product pixel values (DN)
Therefore, TOA reflectance with correction for sun angle is;
where:
= TOA planetary reflectance
= Local sun elevation angle
= Local solar zenith angle
Water spread area extraction: A total of five Landsat 8 OLI imagery data was used during the study. The 30m spatial resolution data had less than 10% cloud cover for both scene and land cover. The Blue, Green, Red and Infrared bands were stacked in QGIS software to form a multiband image. The stacked images were then clipped using a vector layer of the area covering the dam. A Red, Green and Blue (RGB) false colour composite was created to enhance water and vegetation visualisation [5]. The NDWI method using Equation [2] was used for identification of water pixels as suggested by Avinash & Chandramouli [8].
The raster calculator in QGIS was used to enter the NDWI formulae using bands 3 and 5. Band 3 represented the Green band while Band 5 represented the NIR band. The area covered by water or what is referred to as water spread area at different elevation levels after extraction was used to come up with surface areas for the reservoir [5]. These surface areas were then used for the calculation of reservoir volumes using the Trapezoidal formula as suggested by Avinash & Chandramouli [8]. For calculation of reservoir volumes or capacities at varying elevations, Equation [1] was used.
Where:
V = volume between successive elevations
A1 and A2 = areas for elevations 1 and 2
h = difference between elevations 1 and 2
The cumulative volumes of the new surface areas represent the new capacity of the reservoir [5]. The surface area-capacity relationship data obtained from remote sensing was then plotted on a Microsoft Office Excel spreadsheet and compared with hydrographic survey results for the same period. The difference between the current reservoir capacity and the capacity on completion of dam construction indicated the level of sedimentation in the reservoir.
Validation of results: The remotely sensed results were validated with those obtained by ZINWA during a hydrographic survey conducted in 2016 at the same dam. Findings by Mavima, et al. [12] who used the sediment sampling method to assess the rate of sedimentation and the 2003 hydrographic survey of the same dam were also compared with remotely sensed sedimentation results.
Results
Hydrographic survey results
Results of the 2003and 2006 hydrographic surveys: Figure 5 shows the Surface Area/Capacity relationship of the Chesa dam after the 2003 hydrographic survey. The dam's net capacity was now 612,843 m3. During the 12 years the dam had been in operation, it had lost about 537,175 m3 from its original net capacity of 1,150,000 m3 at completion of construction in 1991. It means that Chesa dam lost about 46.7% of its capacity to sedimentation over a period of 12 years thus an annual sedimentation rate of 3.9%.
An analysis of the hydrographic survey results for the year 2016 revealed that the dam's net capacity was 476,781 m3 after 25 years of operation (Figure 6). By year 2016, the dam had lost about 673,219 m3 which translates to 58.5% of the original capacity of the dam. The annual sedimentation rate was estimated to be 2.34%. The results indicate that the annual sedimentation rate had slightly reduced by 1.55% from 3.89% in 2003. At a sedimentation rate of 2.34%, the dam was expected to be filled up with sediments after 18 years.
Remotely sensed water spread and reservoir capacities: Figure 7 shows the stacked and NDWI images for the 5 datasets used for the study. The five datasets show Chesa dam in false colour composite to the left (a) while to the right (b) it indicates the NDWI calculation outputs. Water pixels on the (b) images were magnified so that they appear distinct as light-coloured pixels.
The NDWI images were then reclassified and vectorised in QGIS to select water pixels. The output vector, which were in the .shp format were ultimately used to mask the water spread areas (Figure 8 and Table 2).
The surface areas for the five water spread areas were calculated from the vector files in the QGIS environment. The resultant surface areas and capacities were tabulated against the corresponding dam level and date of satellite data acquisition (Table 2).
The dam's full supply capacity was at the 100.00m dam level. On the table, capacity represents the amount of water contained between two successive dam levels while cumulative capacity represents the total amount of water (inclusive of sediments) contained from the bottom of the dam up to that dam level. Therefore, the cumulative dam capacity at dam level 100.00m represents Chesa dam's full supply capacity of 374,535 m3 as at 9 May 2017 (Table 3).
Reservoir surface areas and capacity: Results of previous hydrographic surveys and remote sensing techniques conducted during the study were plotted on the same graph for comparison purposes. At full supply capacity from a hydrographic survey conducted in 2016 the dam produced a capacity of 476,781 m3 as compared to 374,535 m3 produced from sensing remote techniques during the current study. Figure 9 shows a comparison of the results.
Chesa dam sedimentation: The net capacity of the reservoir was calculated using remotely sensed data. The loss of capacity to sedimentation of the reservoir was calculated from the design capacity of the reservoir as well as results of previous hydrographic surveys. Table 4 presents the results.
Remote sensing data covering the period 2015 to 2017 showed that the dam lost about 67% of its capacity to sedimentation as compared to 59% obtained from a hydrographic survey done in 2016. The average annual sedimentation rate was estimated to be 2.7% as compared to 2.34% obtained from the ZINWA 2016 hydrographic survey. According to the results of this study, Chesa dam is likely to been silted up by the year 2028.
Discussion
Dynamics in sedimentation: Remotely sensed data has been used widely for determining reservoir sedimentation rates with great success. Rathore, et al. [18] applied the NDWI and WI methods on Landsat 8 OLI data and obtained accuracies of around 95%. The annual sedimentation rate of 2.7% obtained during the study is very close and comparable to 2.34% obtained by ZINWA in 2016 through a hydrographic survey. The sedimentation rate is however far from 9% obtained by Mavima, et al. [12]. Mavima, et al. [12] used the grab sampling technique during the 2009/10 rainfall season to estimate an annual sedimentation rate for the dam. This could explain the 6.3% difference between the two sets of results since Mavima, et al. [12] did not use long term sediment sampling data to arrive at an acceptable annual sedimentation rate for the dam. Hydrographic surveys and sediment sampling studies conducted by [19,23] and Mavima, et al. [12] indicated that the dam lost between 2.34% and 9% annually to sedimentation. These results are in line with Chomba [4] who indicated that small dams in developing countries lose around 50% of their capacity to sedimentation during the first 20 years of operation. The results are also consistent with those of Mupfiga, et al. [5] who found that in Tanzania sedimentation rates were around 2.6%.
Relationship between measured and remote sensing derived sedimentation: Remote sensing techniques produced an annual sedimentation rate of 2.7% against 2.34% produced through the hydrographic survey of 2016. There was a marginal difference of 0.36% between the two sets of results. This indicates that remote sensing was successful in estimating reservoir sedimentation. Shavkat, et al. [3] put the global figure of annual sedimentation rate of reservoirs at around 1%. The sedimentation rate is, however believed to be higher in developing countries due to the poor land-use practices upstream of reservoirs [2,4].
Conclusions
The study interrogated the application of remotely sensed data for determination of reservoir capacity and estimation of sedimentation rates in comparison with the traditional hydrographic survey method. The NDWI method was used for identification of water pixels while the trapezoidal method was used for the calculation of dam capacities at the different water spread areas or surface areas. The surface areas were derived from remotely sensed data for respective dam levels. Our results suggest that remotely sensed data and GIS technology can confidently be used in the determination of reservoir capacity since the results were consistent with those from hydrographic surveys. High rates of sedimentation obtained from this study suggest that there is rampant environmental degradation within the catchment. Land-use practices upstream and within a dam catchment should be monitored closely to safeguard against degradation of water resources.
Funding
This research did not receive any specific grant from funding agencies in the public, commercial, or not-for-profit sectors.