
International Journal of Earth Science and Geophysics
(ISSN: 2631-5033)
Volume 7, Issue 2
Research Article
DOI: 10.35840/2631-5033/1851

Article Formats
Assessing the Seismicity of Shillong Plateau Using 'b value'
Table of Content
Figures

Figure 1: Geoelectric cross-section over....
Geoelectric cross-section over Shillong Plateau and Lower Brahmaputra valley plots along with earthquakes hypocentre, dot circle (after Gokarn, et al. [10]).
MFT: Main Frontal Thrust; BF: Brahmaputra Fault; OF: Oldham Fault; DF: Dauki Fault; LBV: Lower Brahmaputra Valley; and SP: Shillong Plateau.
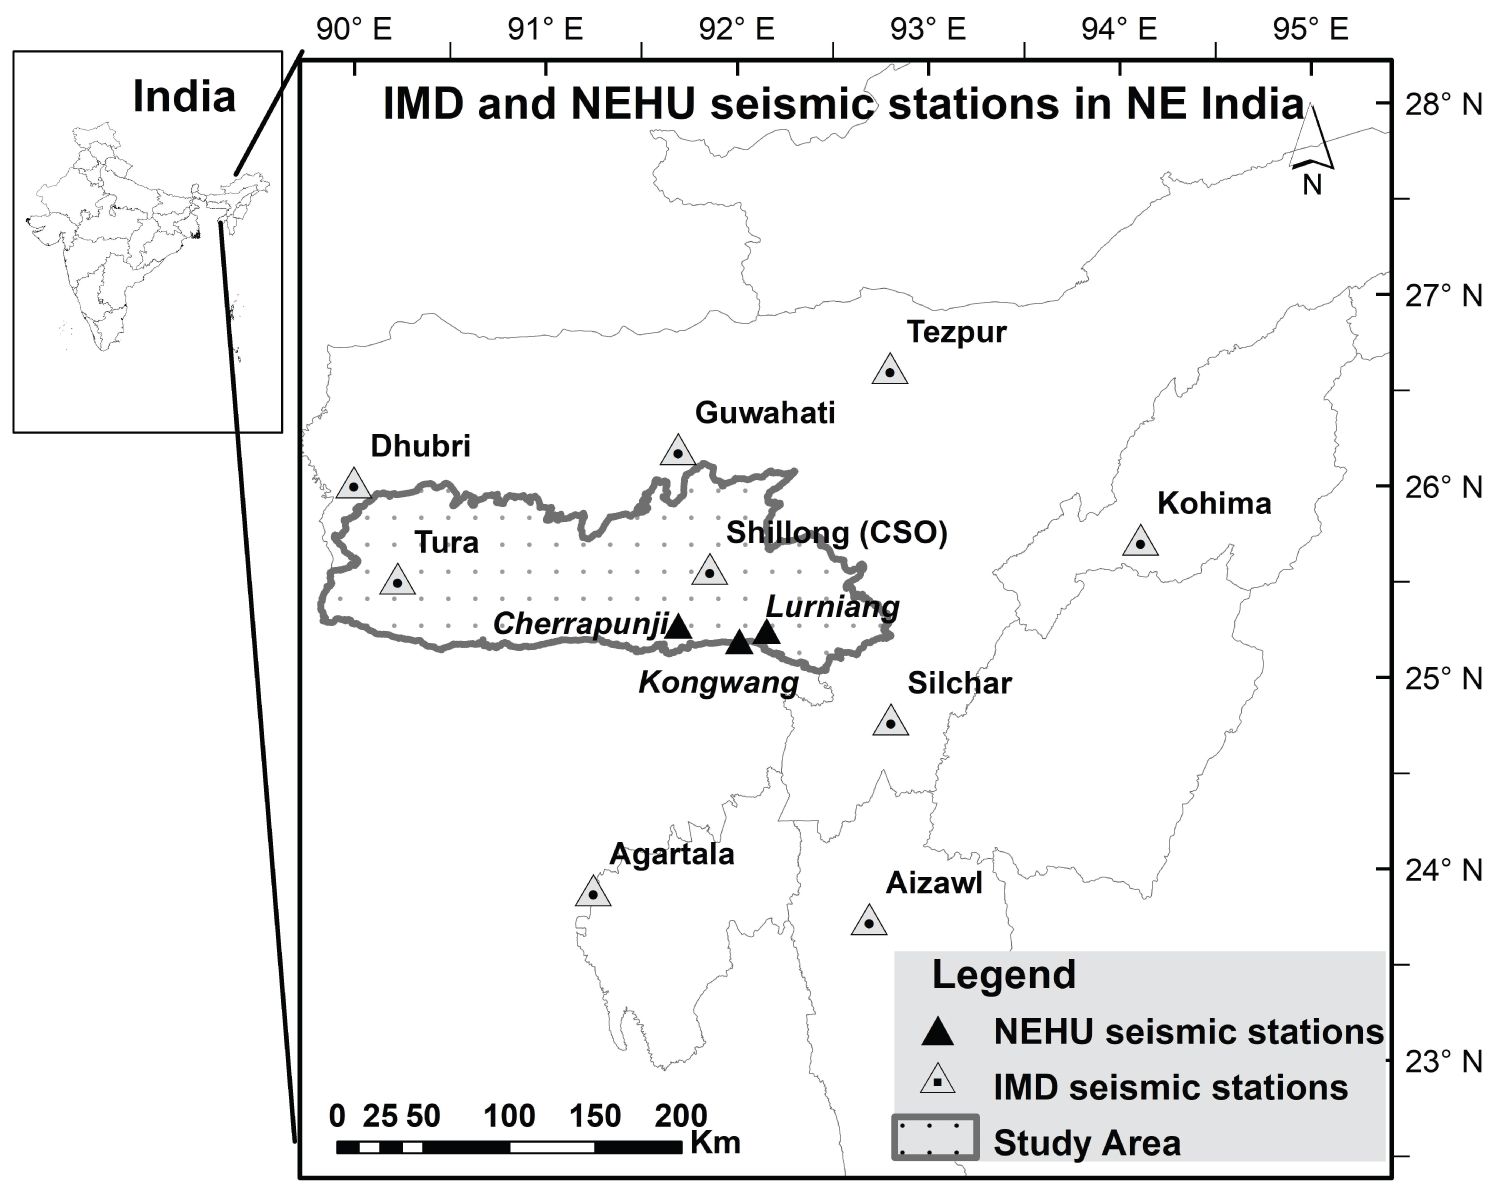
Figure 2: Map showing seismic stations.....
Map showing seismic stations in NE India and the study area.
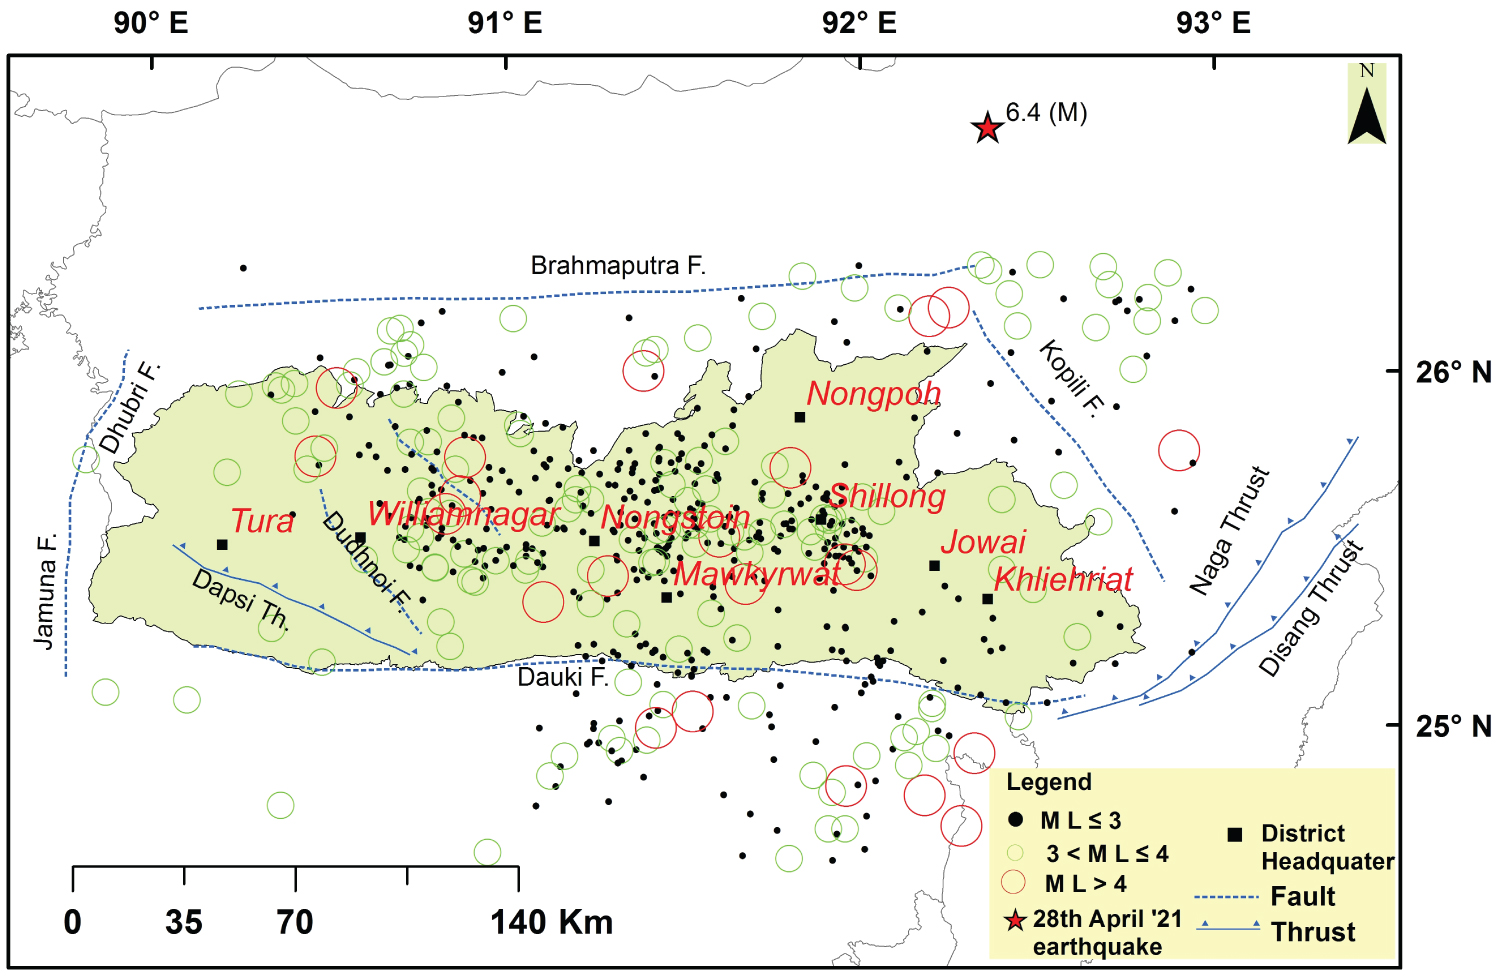
Figure 3: Epicentre map of earthquakes for....
Epicentre map of earthquakes for March 2013 to December 2017, and tectonic map of Shillong Plateau (modified after Kayal [24]).
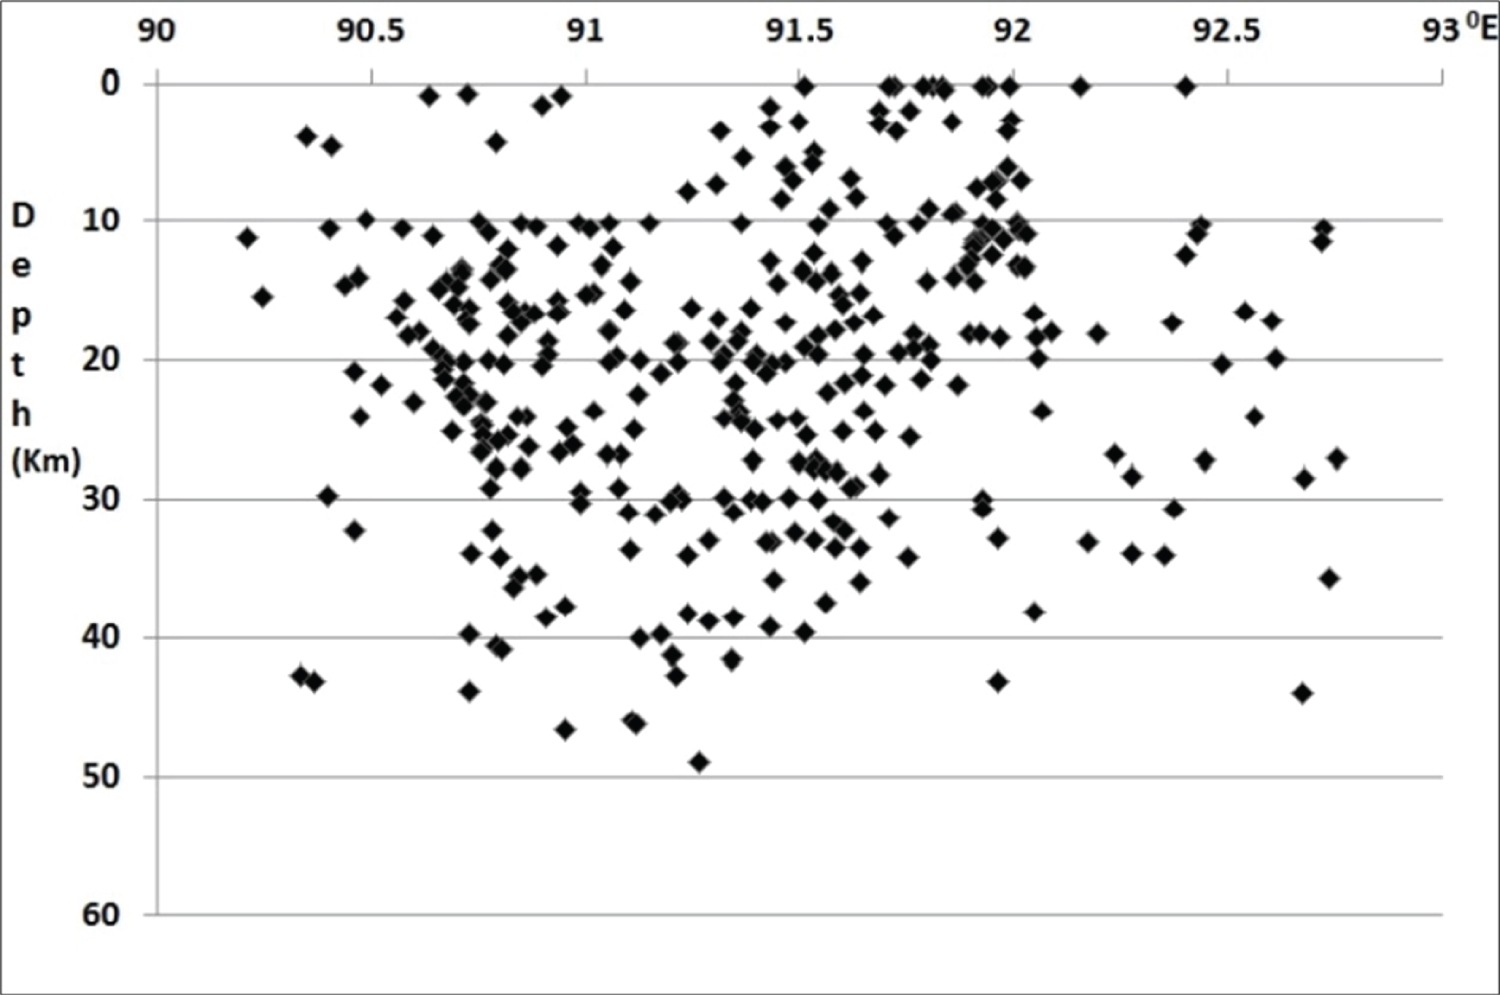
Figure 4: Depth distribution of the....
Depth distribution of the recorded earthquakes along E-W direction.
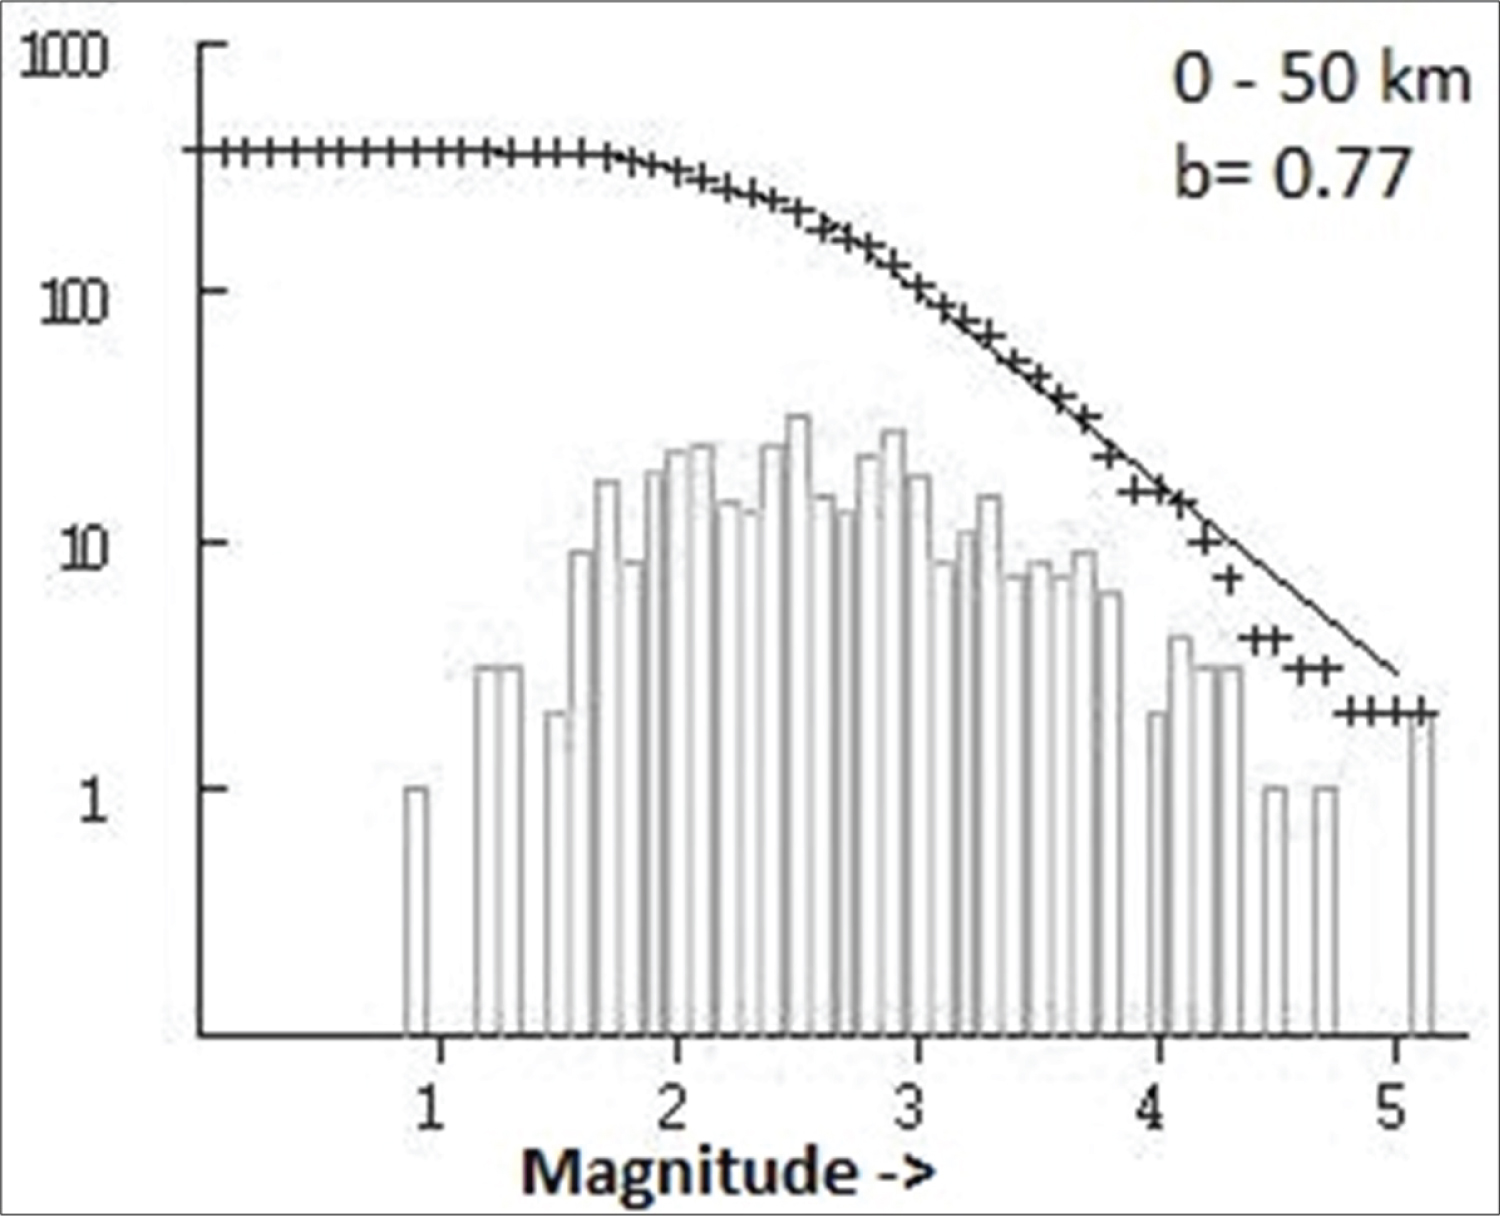
Figure 5: Solid line represents Gutenberg.....
Solid line represents Gutenberg-Richter relation for b = 0.77 and a = 4.31 (depth 0 - 50 km). '+' represent data points of cumulative frequency magnitude (along the y-axis); the bars are the number of events.
Tables
Table 1: Seismic stations detailed used for our work.
Table 2: 'b value' at different depth layers in the Shillong Plateau.
References
- Gutenberg B, Richter CF (1944) Frequency of earthquakes in California. Bull Seism Soc Am 34: 185-188.
- Scholz CH (2015) On the stress dependence of the earthquake b value. Geophys Res Lett 42: 1399-1402.
- Scholz CH (1968) The frequency-magnitude relation of microfracturing in rocks and its relation to earthquakes. Bull Seismol Soc of Am 58: 399-415.
- Thingbaijam KK, Nath SK, Yadav A, Raj A, Walling MY, et al. (2008) Recent seismicity in Northeast India and its adjoining region. J Seismol 12: 107-123.
- Bhattacharya PM, Majumdar RK, Kayal JR (2002) Fractal dimension and 6-value mapping in northeast India. Current Science 82: 25.
- Wiemer S, Wyss M (1997) Mapping the frequency-magnitude distribution in asperities: An improved technique to calculate recurrence times? J Geophys Res 102: 15115-15128.
- Kayal JR, Das V, Ghosh U (2012) An appraisal of the 2001 Bhuj Earthquake (Mw 7.7, India) source zone: Fractal dimension and b-value mapping of the aftershock sequence. Pure and Appl Geophys 169: 2127-2128.
- Mogi K (1967) Earthquakes and fractures. Tectonophysics 5: 35-55.
- Wiemer S, Benoit J (1996) Mapping the b value anomaly at 100 km depth in the Alaska and New Zealand subduction zones. Geophys Res Lett 23: 1557-1560.
- Gokarn SG, Gupta G, Walia D, Sanabam SS, Hazarika N (2008) Deep Geoelectric structure over the Lower Brahmaputra valley and Shillong Plateau, NE India using magnetotellurics. Geophys J Int 173: 92-104.
- BIS (2004) Seismic zoning map of India. Bureau Indian Standard publication.
- Gutenberg B (1956) Great earthquakes between the period 1896-1903. Eos, Trans AGU 37: 608-614.
- Ambraseys N, Bilham R (2003) Reevaluated Intensities for the Great Assam Earthquake of 12 June 1897, Shillong, India. Bull Seismol Soc of Am 93: 655-673.
- GSI (2009) Geology and mineral resource of Meghalaya, Geological Survey of India. Miscellaneous Publication no. 30, Part IV, 2.
- Kailasam LN (1979) Plateau uplift in peninsular India. Tectonophysics 61: 243-249, 252-269.
- Walia D, Chaudhary S (2014) Geology and mineral resources of Meghalaya (Geo-Resources). In: K.L. Shrivastava, Arun Kumar, 672 pages.
- Lee WHK, Lahr JC (1975) A computer program for determining local earthquake hypocenter, magnitude, and first motion pattern of local earthquakes. US Geol Surv.
- Bhattacharya PM, Pujol J, Majumdar JK, Kayal JR (2005) Relocation of earthquakes in the Northeast Indian region using joint hypocentre determination method. Current Science 89: 1404-1413.
- Aki K (1965) Maximum likelihood estimate of b in the formula log N = a - bM and its confidence limits. Bulletin of Earthquake Research Institute of the University of Tokyo 43: 237-239.
- Utsu T (1965) A method for determining the value of b in a formula, log (N) = a-bM, showing the magnitude frequency relation of earthquake. Geophysics Bulletin, Hokkaido University 13: 99-103.
- Bhattacharya PM, Kayal JR, Baruah S, Arefiev SS (2010) Earthquake source zones in Northeast India: Seismic tomography, fractal dimension and b value mapping. Pure Appl Geophys 167: 999-1012.
- Shi Y, Bolt BA (1982) The standard error of the magnitude-frequency b value. Bull Seismol Soc of Am 72: 1677-1687.
- Chen WP, Molnar P (1990) Source parameters of earthquakes and intraplate deformation beneath the Shillong Plateau and the Northern Indo-Burman range. Journal of Geophysical Research 95: 12527-12552.
- Kayal JR (1998) Seismicity of northeast India and surroundings - development over the past 100 years. J Geophys 19: 9-34.
- Kayal JR (1996) Earthquake source processes in northeast India: A review. J Himalayan Geol 17: 53-69.
- Mukul M, Jade S, Bhattacharyya AK, Bhusan K (2010) Crustal shortening in convergent orogens: Insights from global positioning system (GPS) measurements in Northeast India. Journal Geological Society of India 75: 302-312.
- Wyss M (1973) Towards a physical understanding of the earthquake frequency distribution. Geophys J R Astron Soc 31: 341-359.
- Spada M, Tormann T, Wiemer S, Enescu B (2013) Generic dependence of the frequency-size distribution of earthquakes on depth and its relation to the strength profile of the crust. Geophysical Research Letters 40: 709-714.
Author Details
Double M Siangshai1, Devesh Walia2*, Atul Saxena1 and Andrew Cuthbert Lyngdoh3
1Department of Physics, North-Eastern Hill University, Shillong, India
2Department of Environmental Studies, North-Eastern Hill University, Shillong, India
3Central Seismological Observatory, Shillong, India
Corresponding author
Devesh Walia, Department of Environmental Studies, North-Eastern Hill University, Shillong, India.
Accepted: August 10, 2021 | Published Online: August 12, 2021
Citation: Siangshai DM, Walia D, Saxena A, Lyngdoh AC (2021) Assessing the Seismicity of Shillong Plateau Using 'b value'. Int J Earth Sci Geophys 7:051.
Copyright: © 2021 Siangshai DM, et al. This is an open-access article distributed under the terms of the Creative Commons Attribution License, which permits unrestricted use, distribution, and reproduction in any medium, provided the original author and source are credited.
Abstract
The Shillong Plateau is a detached North-eastern portion of the Indian plate and is part of the Eastern Himalayan Syntaxial zone. It is one of the most seismically active plateaus in the world and falls under zone V of the Indian seismic hazard zonation map, the highest seismic hazard zone. During the period of study (2013-2017) numerous local earthquakes of varied magnitude were recorded by the installed broadband seismic stations. The present study is focused on the calculation of the 'b value' using the Gutenberg-Richter relation, which is the rate of fall in the frequency of earthquake occurrences with their increasing magnitude. The 'b-value' is estimated by the maximum likelihood method at five different layers of the lithosphere considering the geoelectric crustal configuration up to the depth of 50 km. The calculated 'b values' at different layers are estimated to be 0.78 (0 < depth ≤ 10), 0.83 (10 < depth ≤ 20), 0.74 (20 < depth ≤ 30), 0.66 (30 < depth ≤ 40), 0.71 (40 < depth ≤ 50), with an average of 0.77 (0 < depth ≤ 50). The result indicates that the overall b value of the Shillong Plateau has a moderate value and the variation of the 'b value' at a different range of depth layers is due to the converging varying stresses due to strength, stress orientations, and physical properties of the layers.
Keywords
Shillong Plateau, Gutenberg-Richter relation, b value, Maximum likelihood method
Introduction
The Gutenberg-Richter relation describes the relationship between the frequencies of occurrence of earthquakes with increasing magnitudes. The relation is given as
'N' denotes the cumulative number of earthquakes having a magnitude equal to or larger than 'M'. The constant 'a' measures the level of seismic activity and the constant 'b' also known as the 'b value' is the slope of a straight line, which determines the rate of fall of frequency of occurrence of events with increasing magnitude. Based on the tectonic setup of the region the b value normally varies from 0.45 to 1.50 [1] and is commonly close to 1.0 in seismically active regions.
The 'b value' is an important parameter in seismic studies as it indicates the stress regime of a region [2]. The 'b value' of the region where stress is continually released by an earthquake will be high; on the other hand, the b value will be low when stress is getting accumulated [3,4]. A high 'b value' indicates large numbers of earthquakes are of lower magnitude and a low 'b value' indicates large numbers of earthquakes are of higher magnitude [5,6]. The 'b value' varies on the strength and composition of the material constituting the rock mass, stress orientations, and physical properties of the layers at different depth range. The region with low strength and large heterogeneous rock mass has a high 'b value' and the region with asperity and homogeneity has a low 'b value' [3,7-9]. In this paper, the 'b-value' is estimated in the Shillong Plateau at five different layers of the lithosphere considering the geoelectric crustal configuration up to the depth of 50 km [10].
Study Area
The Shillong Plateau is considered to be one of the most active seismic regions in the world. It is a detached portion of the Indian plate and falls under zone V [11] the highest earthquake hazard zone. The plateau experienced a great earthquake on 12th June 1897 with a magnitude of 8.7 [12]. The Great Shillong earthquake has caused huge property damage and killed 1542 people [13]. Our study area falls under 25° N to 26° N latitude and 90° E to 92.5° E longitude and covers almost the entire state of Meghalaya. The recent strong earthquake on 28th April 2021 of magnitude 6.4 with epicentre at 26.690° N and 92.360° E, around 132 km N of Shillong, and focal depth of ~17 km is indicative of the fact that the region is active and requires consistent efforts to understand the seismotectonic setup of the region. Geologically, the Shillong Plateau is mainly comprised of the Precambrian Gneissic Complex and younger Cretaceous Shillong Group of sedimentary rocks sequence unconformably overlying the Precambrian Gneissic Complex and Tertiary sediments towards its southern margin [14-16]. The Shillong Plateau acts as a shallow crustal block in which the lithosphere beneath it subducts along the Dauki and Brahmaputra thrust [10]. The geoelectric cross-section along with the earthquake hypocentres in the Shillong Plateau and Lower Brahmaputra valley is shown in Figure 1.
Data Analysis and Methodology
Earthquakes waveform data are obtained from three broadband seismic stations set up at Cherrapunji, Kongwang, and Lurniang on the Shillong Plateau and data from Indian Meteorological Department (IMD), Shillong from March 2013 to December 2017 (Figure 2). The geographical coordinate of the seismic stations is given in Table 1.
The earthquake epicentres are located using the location program, HYPO71 [17], and the crustal velocity model of Bhattacharya, et al. [18].
The 'b value' is estimated by the Maximum likelihood method [19-21] given as
Where 'M' is the mean magnitude of the set of events and Mo is the minimum or threshold magnitude.
The 'b value' is calculated at depths ranging from 0 to 50 km. The earthquake maximum depth of 50 km is chosen considering the geoelectric crustal configuration [7]. The depth (km) is classified into 5 zones; 0 < depth ≤ 10, 10 < depth ≤ 20, 20 < depth ≤ 30, 30 < depth ≤ 40, 40 < depth ≤ 50. Each depth layers consist of a minimum of 14 events above the threshold magnitude and up to a maximum of 180 events.
The standard deviation of b-value (δb) is given as [19,22]
Where 'Mi' is the magnitude of the ith event, 'M' is the average magnitude for a set of events and 'n' denotes the total number of events in a set.
Results and Discussion
The seismicity map showing the earthquake epicentres on the Shillong Plateau for the years 2013 to 2017 is presented in Figure 3. The earthquake epicentres are distributed in almost every part of the plateau, but the highest density of the epicentral distribution is in the central part of the plateau, trending in the NW-SE direction. The hypocentres of the earthquakes are confined within a depth of 50 km. The earthquakes of the Shillong Plateau are plate boundary earthquakes with a maximum hypocentral depth of 50 km [10,23,24]. The E-W depth distribution of the events is shown in Figure 4, the highest seismic activity (a-value) is observed at a depth range of 10 to 20 km. The seismicity of the Shillong Plateau is influenced by the tectonic driving forces from the Himalayan Arc to the north and the Burmese Arc to the east [10,25]. About 1.5-3.5 mm/yr. of the present-day N-S convergence in the Eastern Himalaya is accommodated in Shillong Plateau [26].
During the study period (2013 to 2017), the results show that the Shillong Plateau has a moderate 'b value' (0.77) as derived in Figure 5 which is lower than the 'b value' (1.29) calculated during the period 1983 to 1986 [24]. The cumulative frequency magnitude distribution of Shillong plateau for the study period (2013 to 2017) at depth less than 50 km is shown in Figure 5. According to Wyss [27] the 'b value' of a region changes in time and space. The decrease in 'b value' from 1.29 to 0.77 indicates that the tectonic stress is getting accumulated in the recent past after 1986. The standard deviation of the 'b value' varies from 0.01 to 0.02. The lower limit magnitude is taken to be 2.5 and a maximum limit of 5.1. The 'b value' at different depth layers is shown in Table 2. The b value obtained using the Maximum likelihood method is comparable with the least square fit. Lower 'b value' in the lower layers compared to the upper layers indicates low strength of the tertiary and Cretaceous sediments as compared to Precambrian Gneissic Complex. The variation of the 'b value' at a different range of depth layers is due to the converging varying stresses due to strength, stress orientations, and physical properties of the layers. The lower 'b value' at greater depth is a result of higher effective stress on the deeper earth's layer [27,28].
Conclusions
The Shillong Plateau shows high seismicity during the recent past (2013-2017). The epicentres are scattered on almost every part of the plateau but the highest density is found in the central part of the plateau. This indicates that the central part of the Shillong Plateau is more active. A detailed microseismic zonation study is required for earthquake risk reduction as urbanisation and infrastructural setup are rapidly growing in this area. The minimum 'b value' 0.66 is from the layer of depth around 35 km. A lower 'b value' indicates the accumulation of tectonic stress in the Shillong Plateau (Table 2). The results show that stress is being built up in the Shillong plateau and considering the shallow seismicity confined to depths within 50 km and the plateau's potential to generate earthquakes such as the Magnitude 8.7 earthquake experienced on the 12th of June 1897, the vulnerability and risk in the Shillong Plateau grow exceedingly high. The average 'b value' of this region is 0.77 (Figure 5). This indicates a decreasing trend as compared to 1986 which is a matter of concern that needs a concerted effort to study the stress accumulation and earthquake activity in the Shillong plateau.
Acknowledgments
The authors would like to thank the Department of Environmental Studies and Department of Physics, North-Eastern Hill University, Shillong for supporting the research work. The authors also acknowledge IMD, Shillong for providing broadband seismic data.