
International Journal of Earth Science and Geophysics
(ISSN: 2631-5033)
Volume 7, Issue 2
Research Article
DOI: 10.35840/2631-5033/1853

Article Formats
Analysis of the CO2 Storage and Migration Characteristics of a Low-Permeable Sandstone using the μ-Focus X-Ray CT Method
Table of Content
Figures
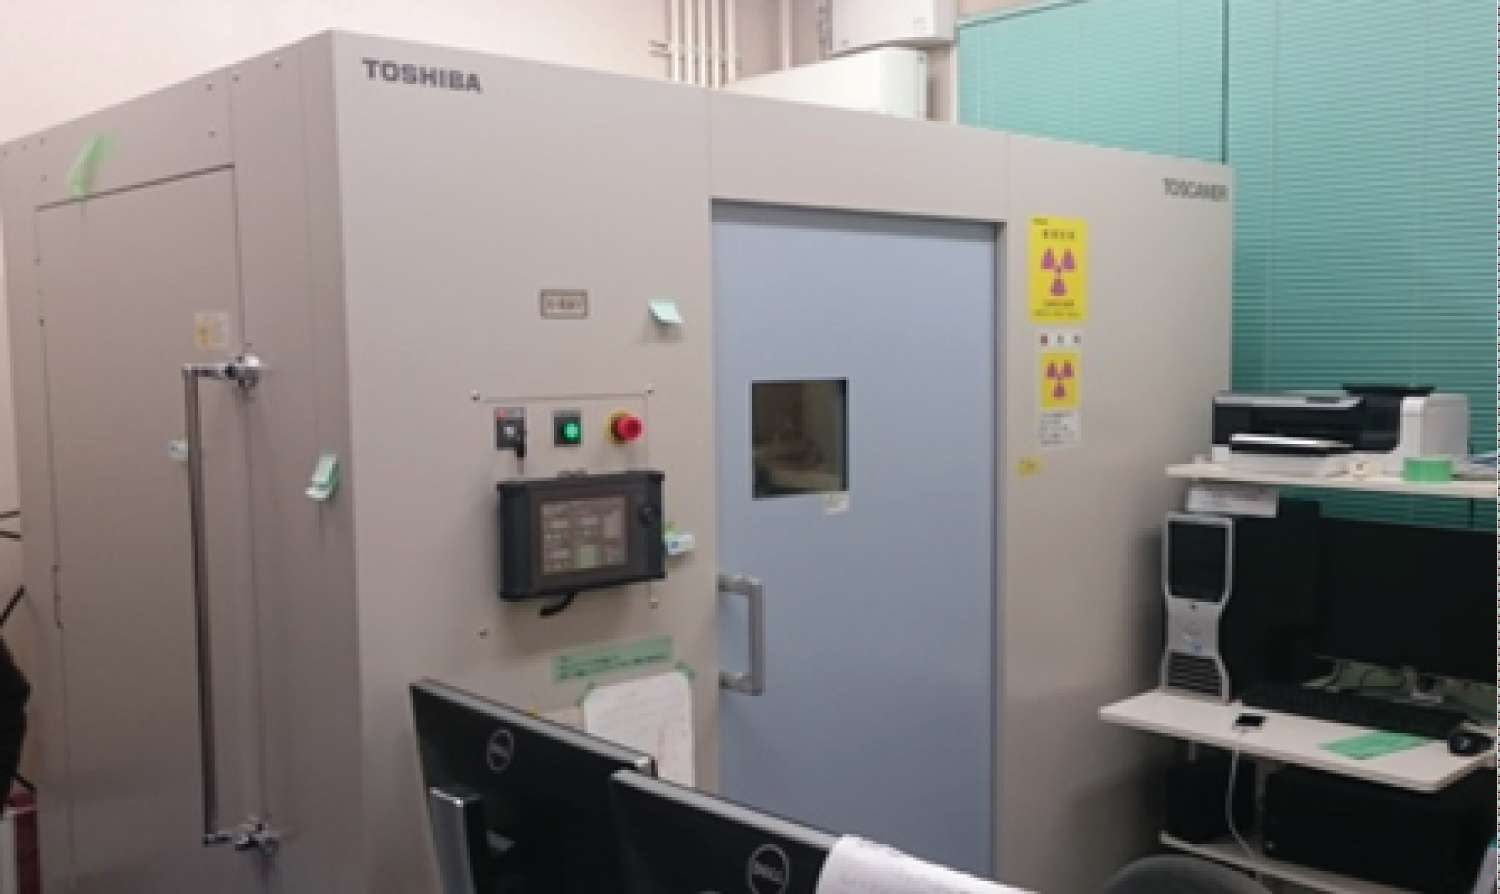
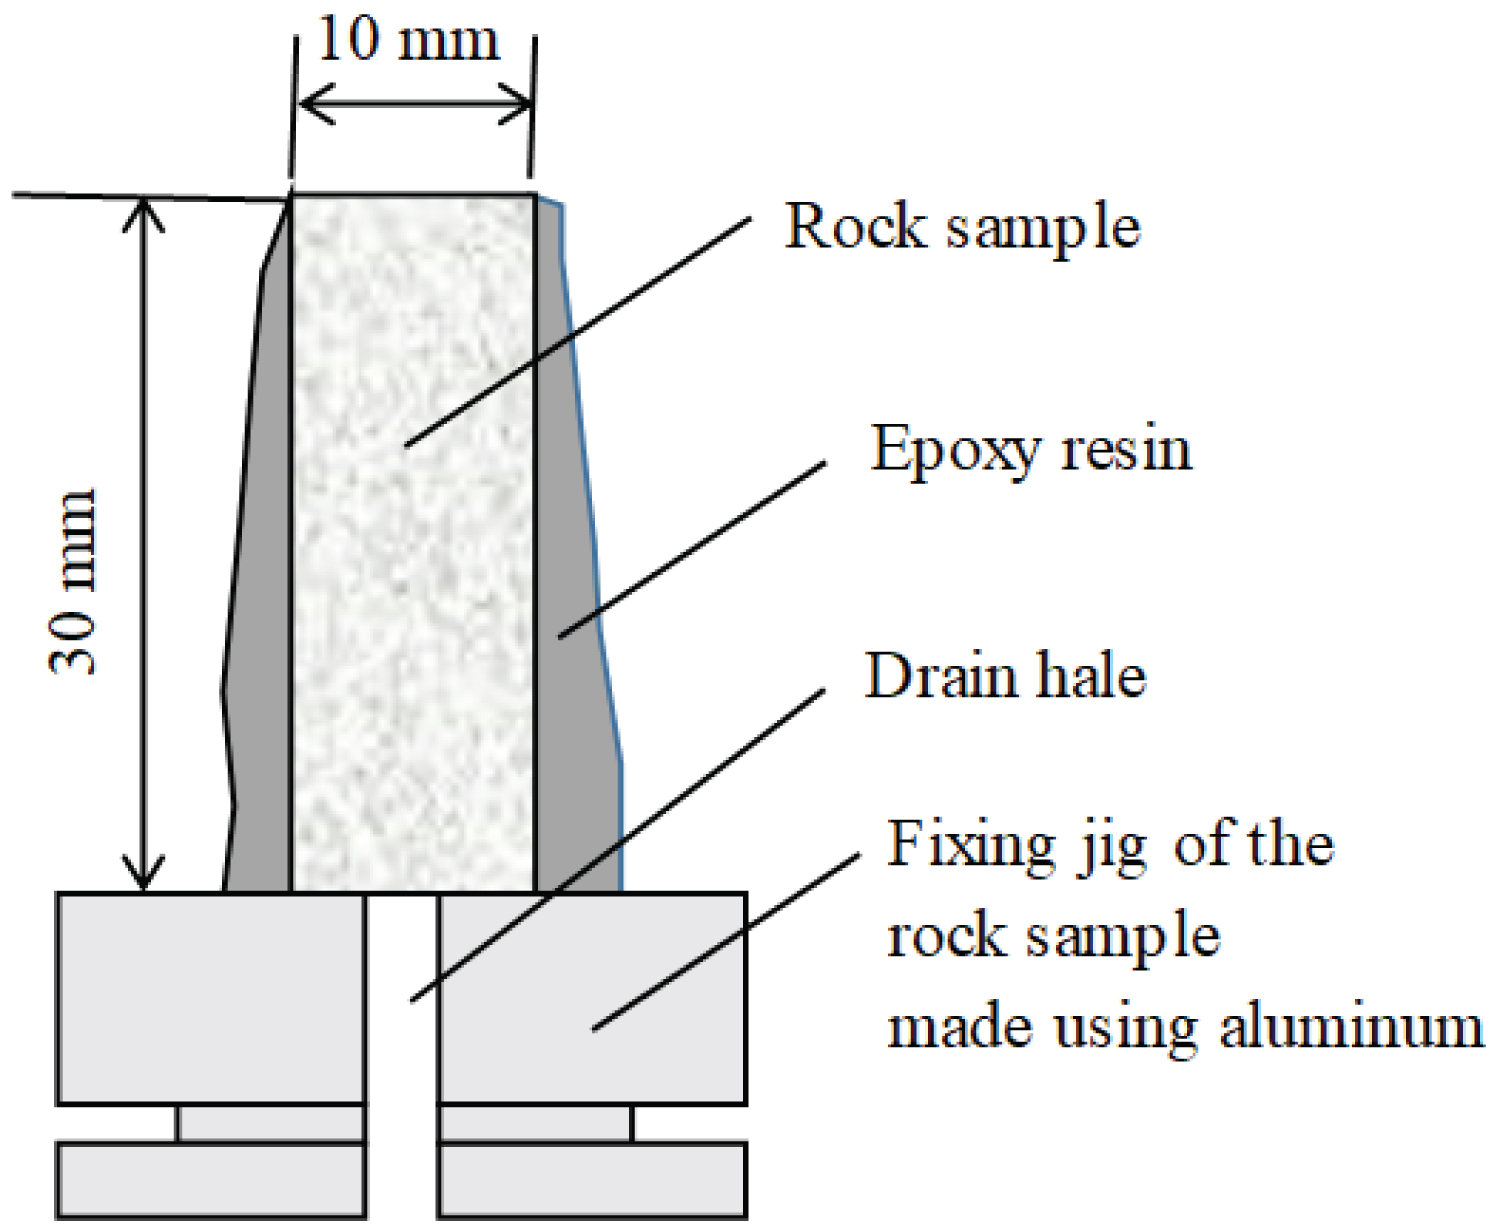
Figure 2: Schematics of the rock sample fixed....
Schematics of the rock sample fixed on the Aluminium jig for CT.
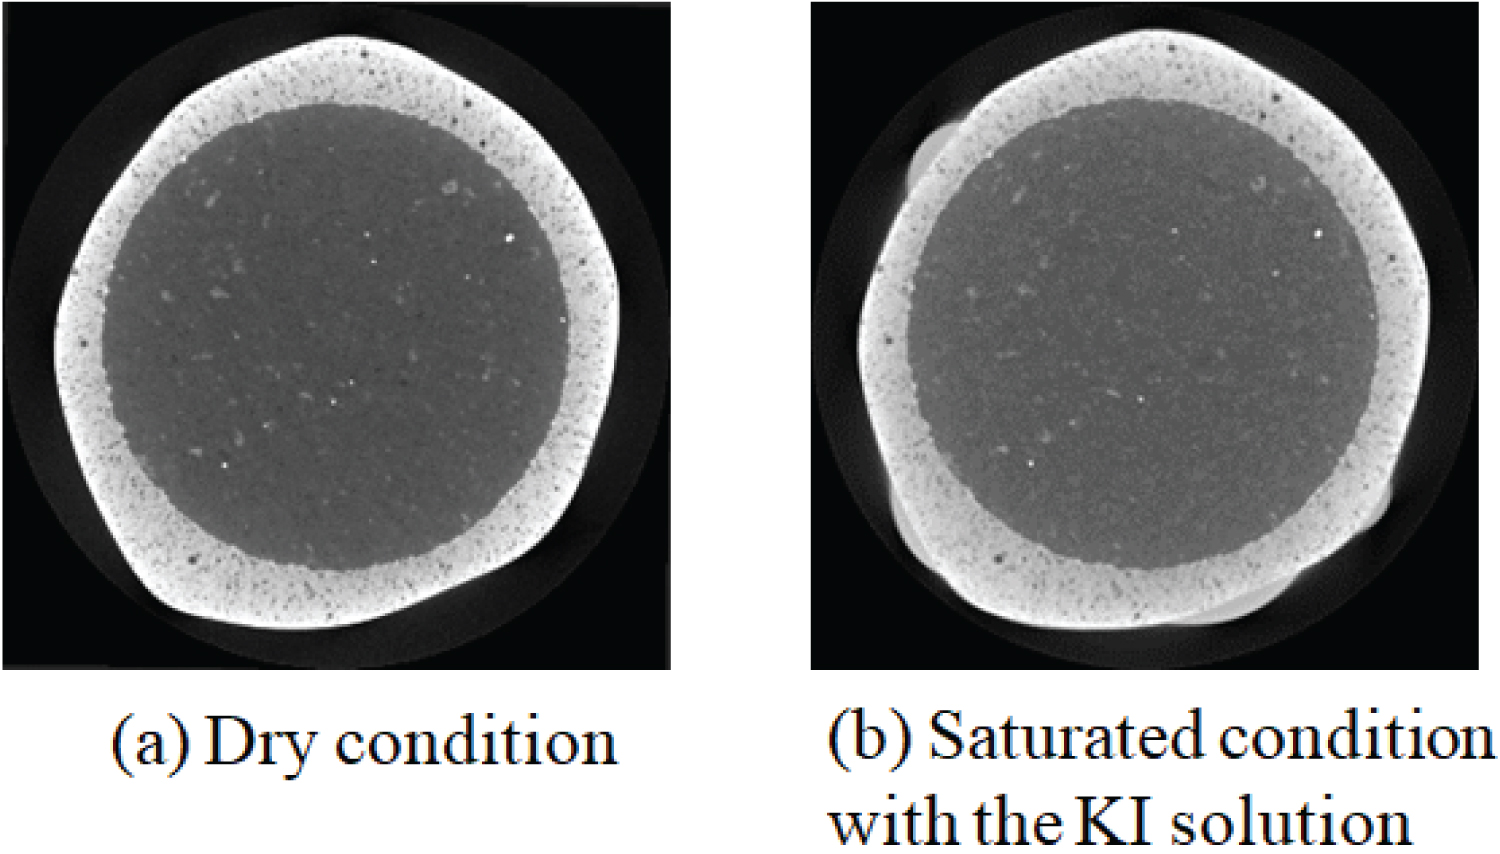
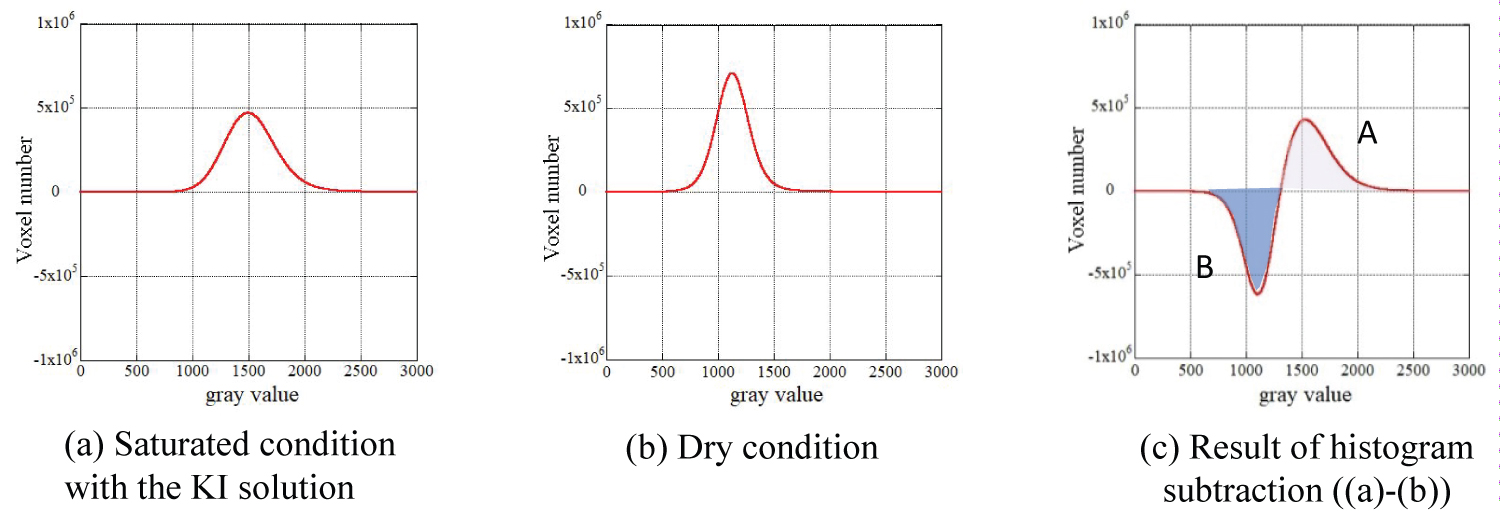
Figure 4: Results of the histogram subtraction...
Results of the histogram subtraction method for Ainoura.

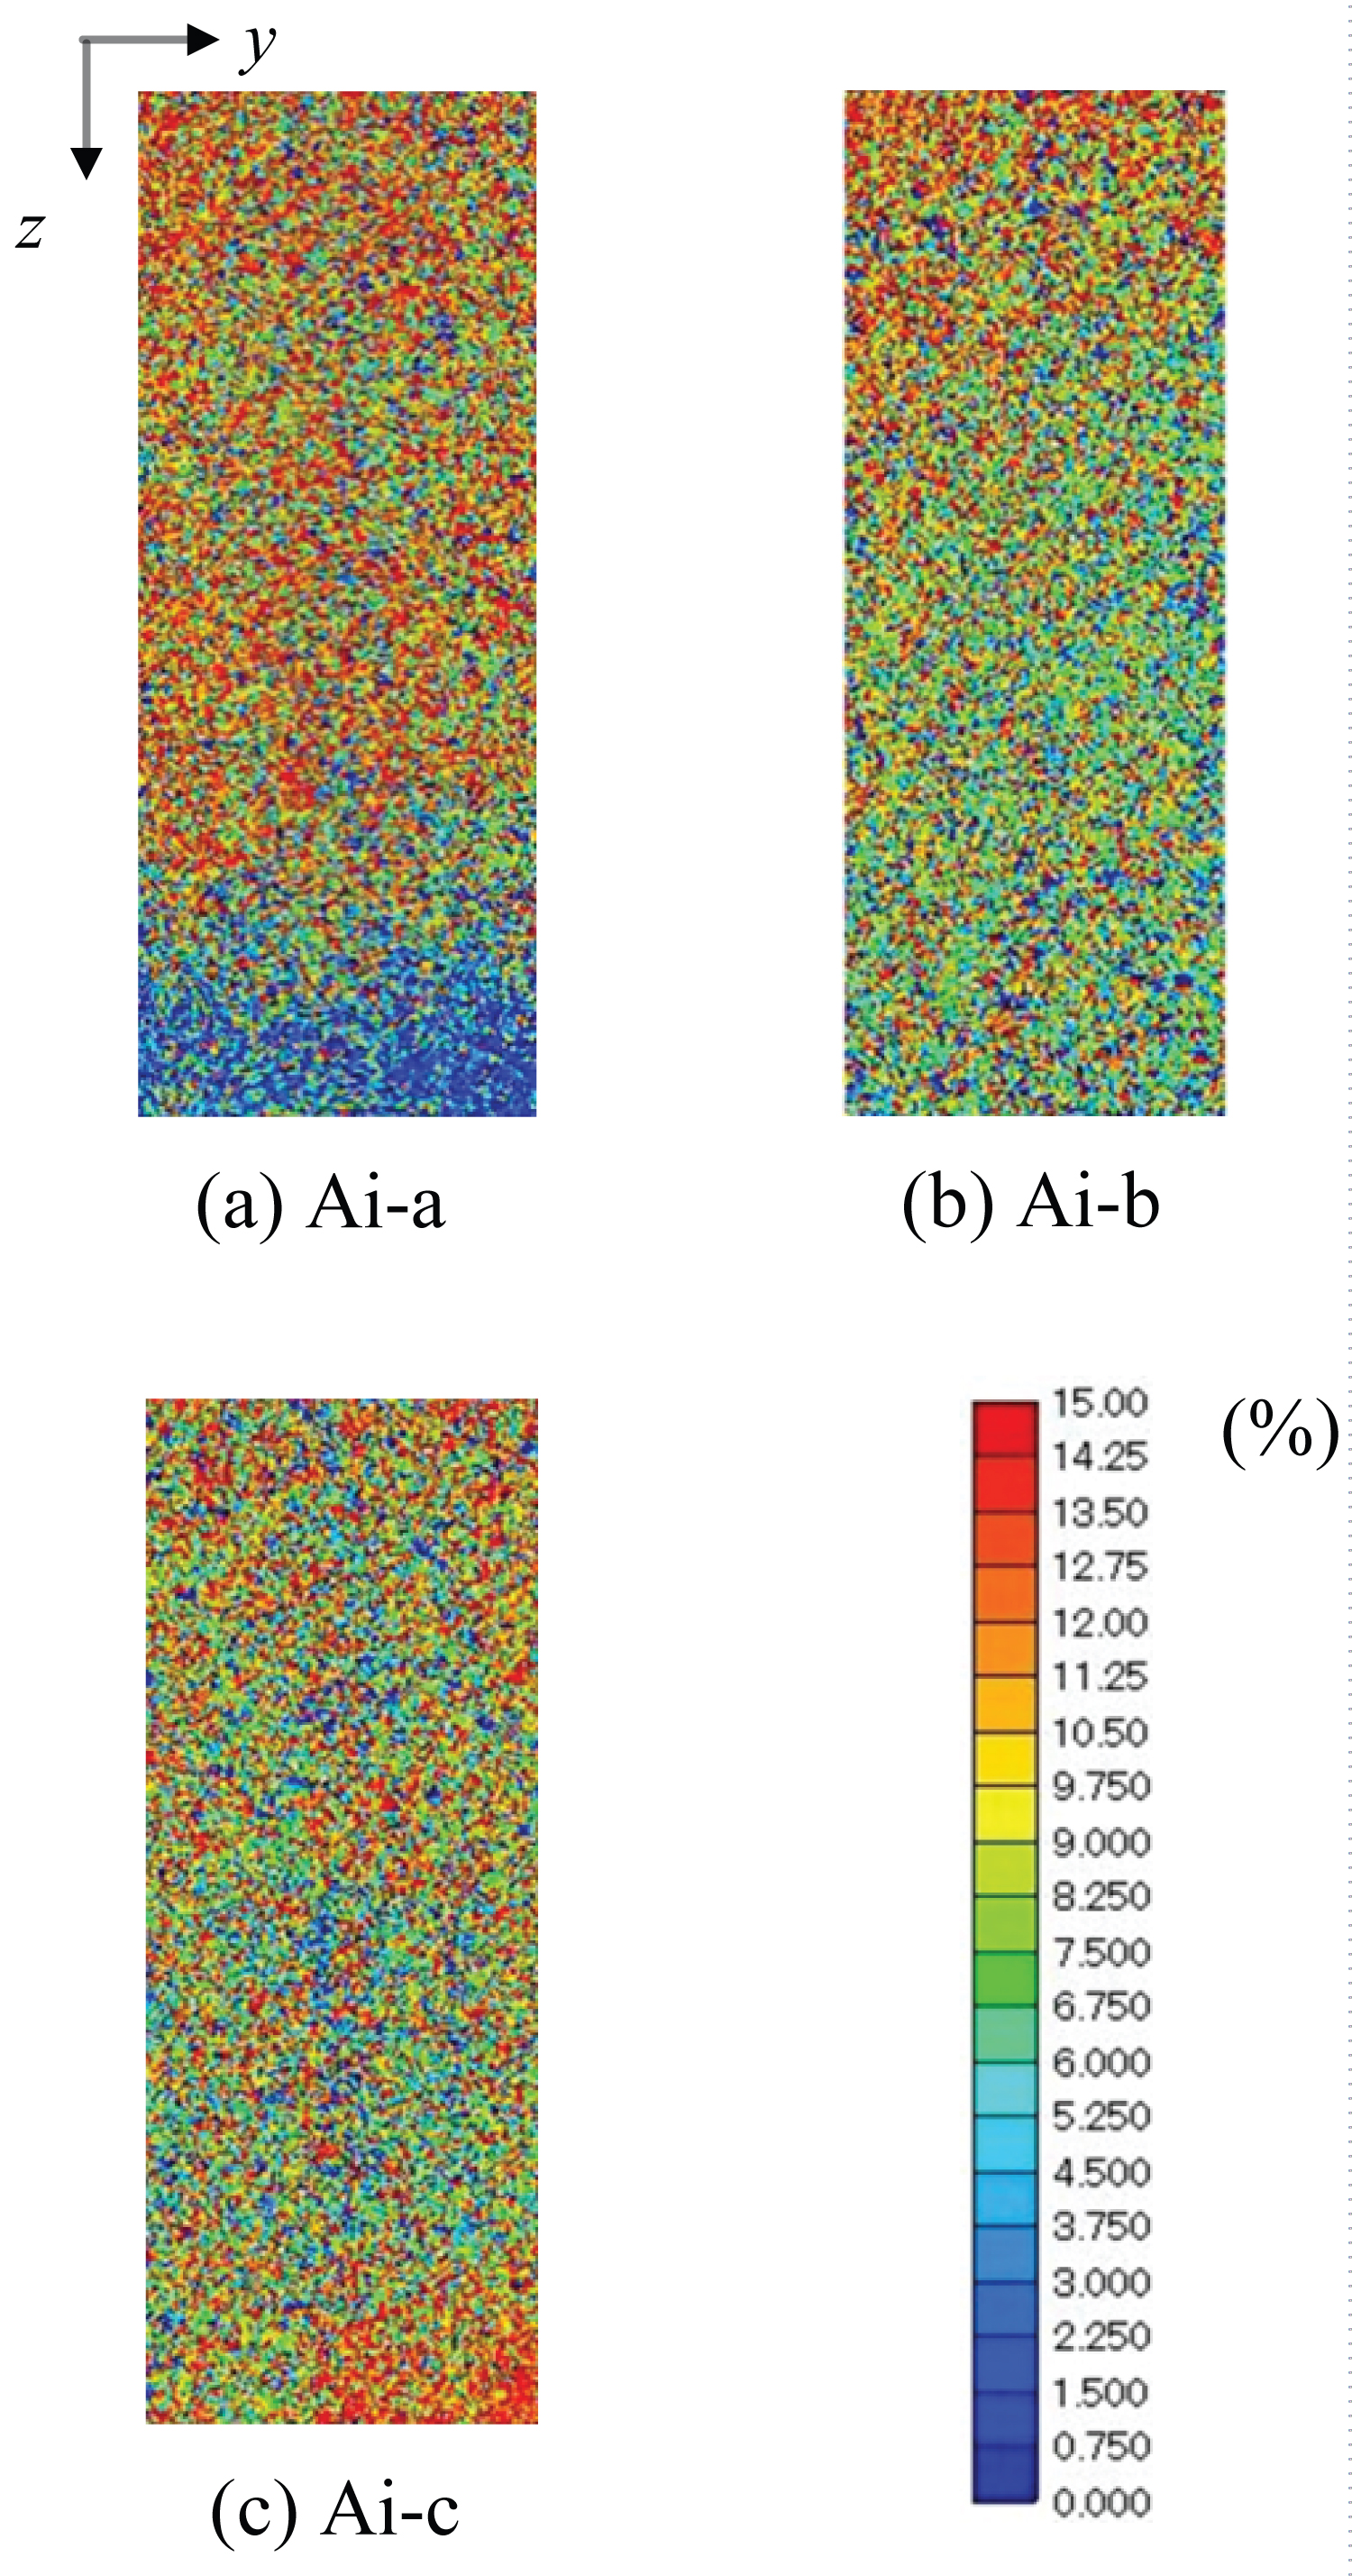
Figure 6: Porosity distribution obtained by the CT image.....
Porosity distribution obtained by the CT image subtraction method.
Figure 7: Pressure vessel used to visualize fluid flow in pores...
Pressure vessel used to visualize fluid flow in pores by μ-focus X-ray CT.
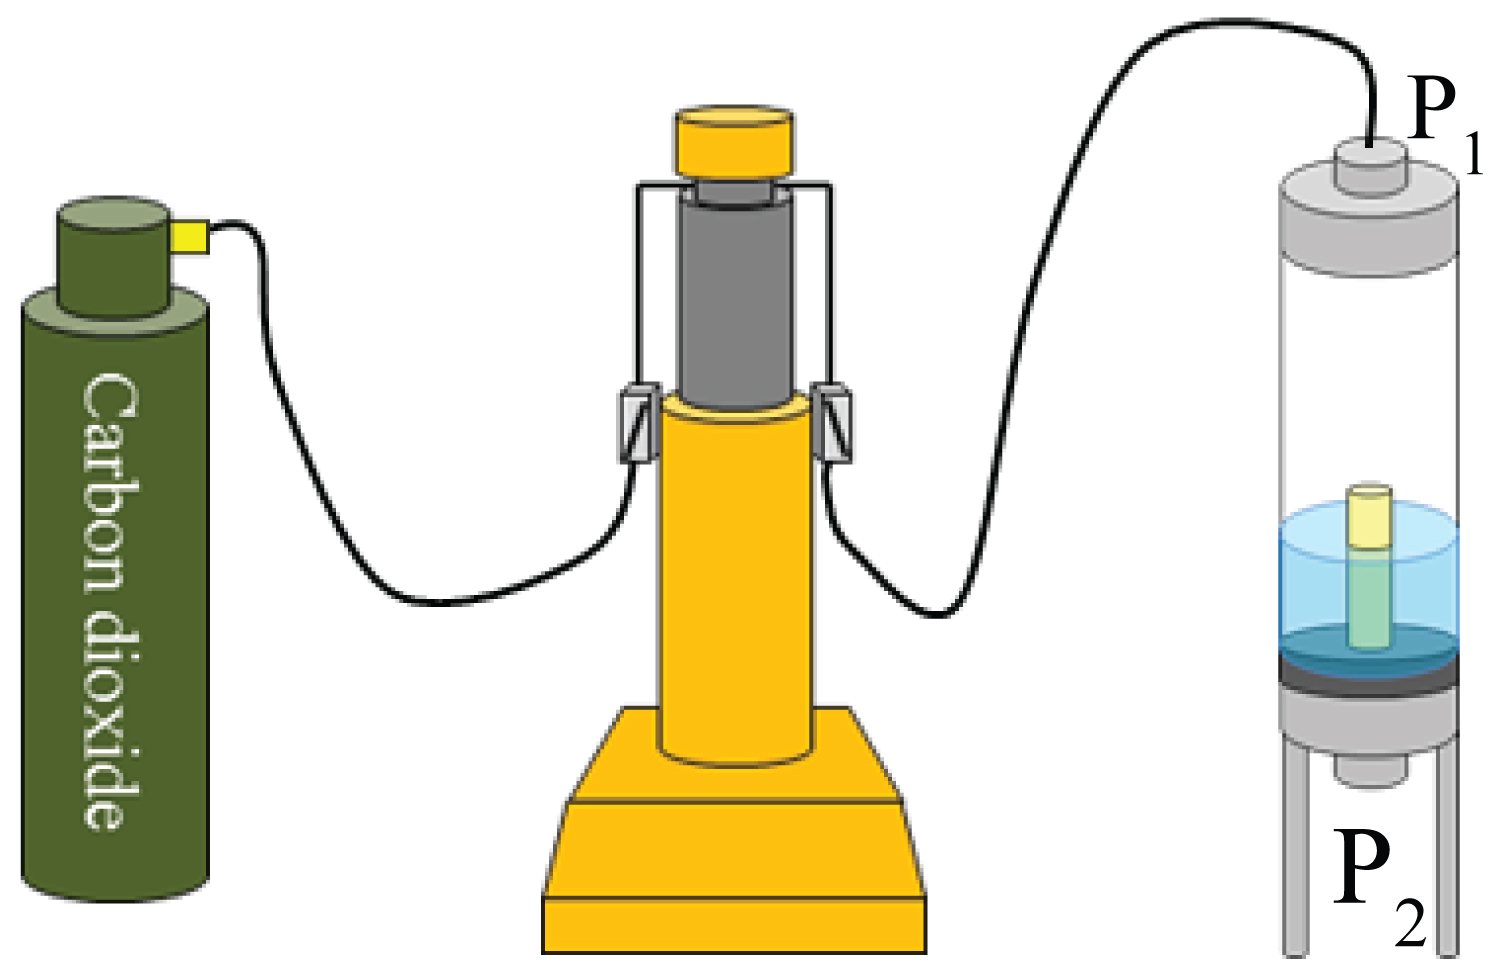
Figure 8: Pressurizing and flow system, including...
Pressurizing and flow system, including the syringe pump.
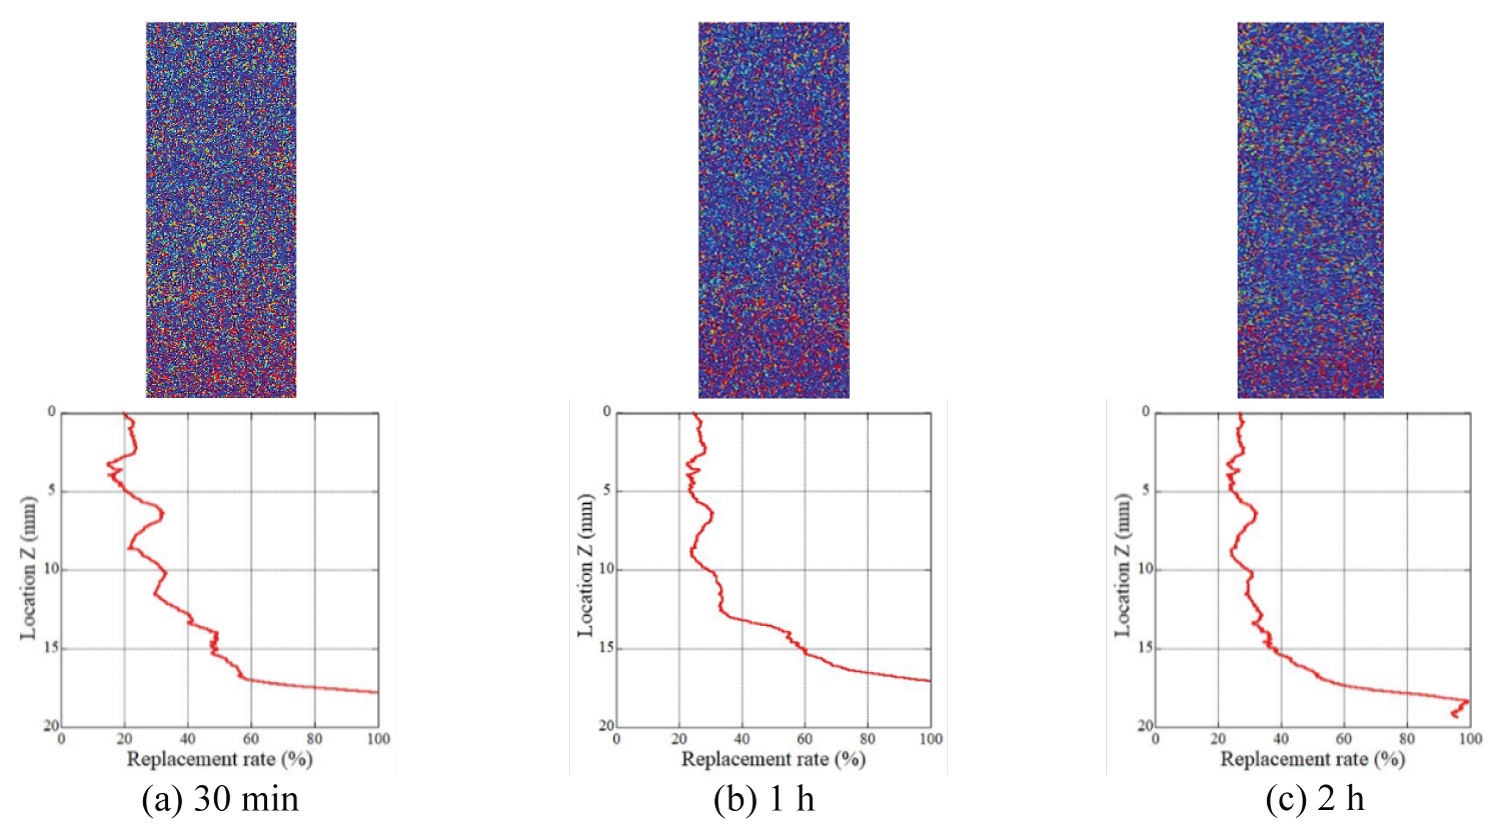
Figure 9: Distribution of the replacement ratio...
Distribution of the replacement ratio after the injection of CO2 gas (Sample Ai-a).
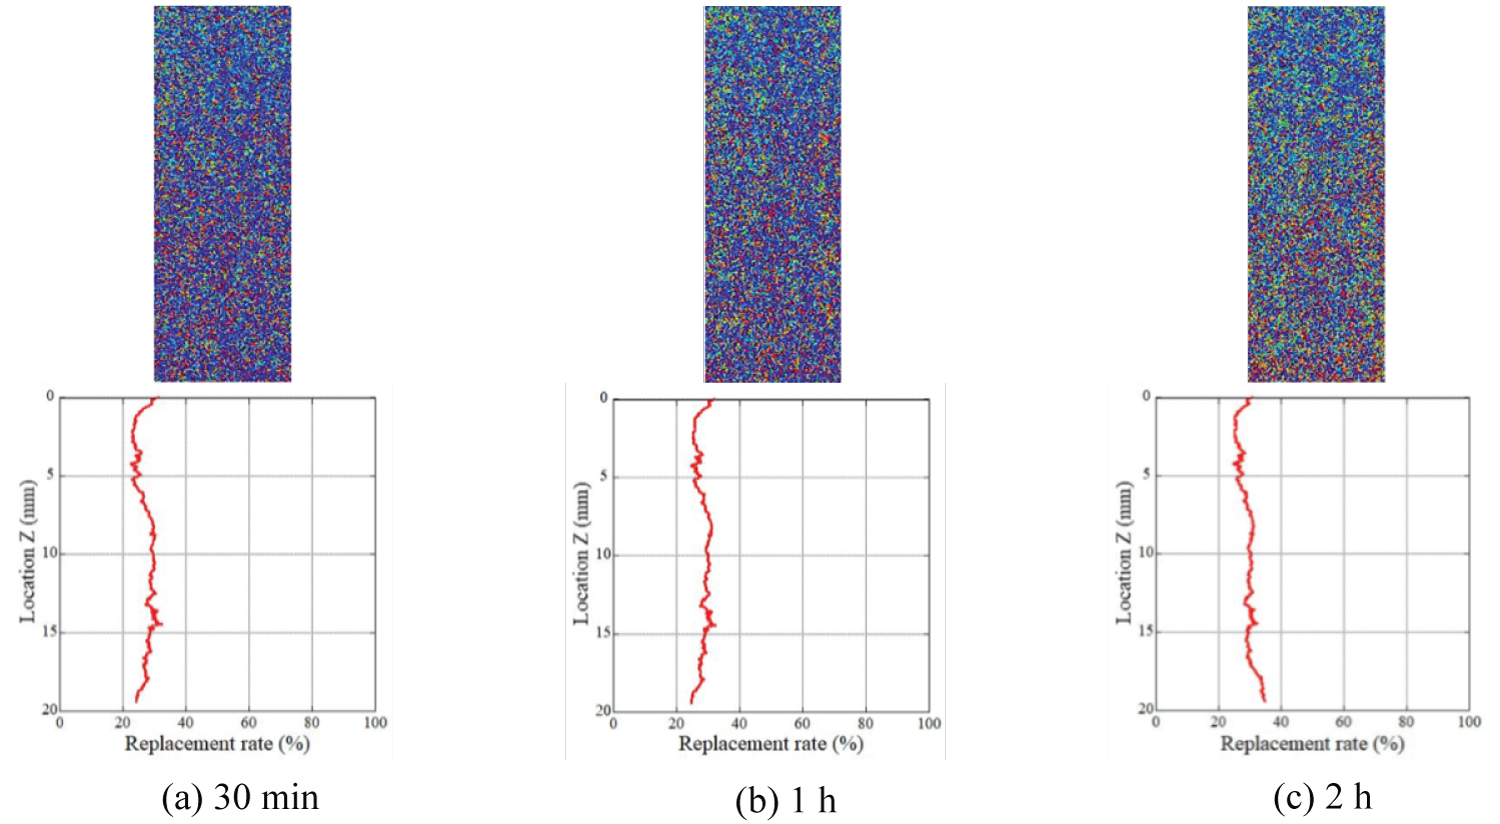
Figure 10: Distribution of the replacement ratio after...
Distribution of the replacement ratio after the injection of CO2 gas (Sample Ai-b).

Figure 11: Replacement ratio after the injection...
Replacement ratio after the injection of 2.0 PV CO2 at a pressure of 8 MPa (Sample Ai-a).
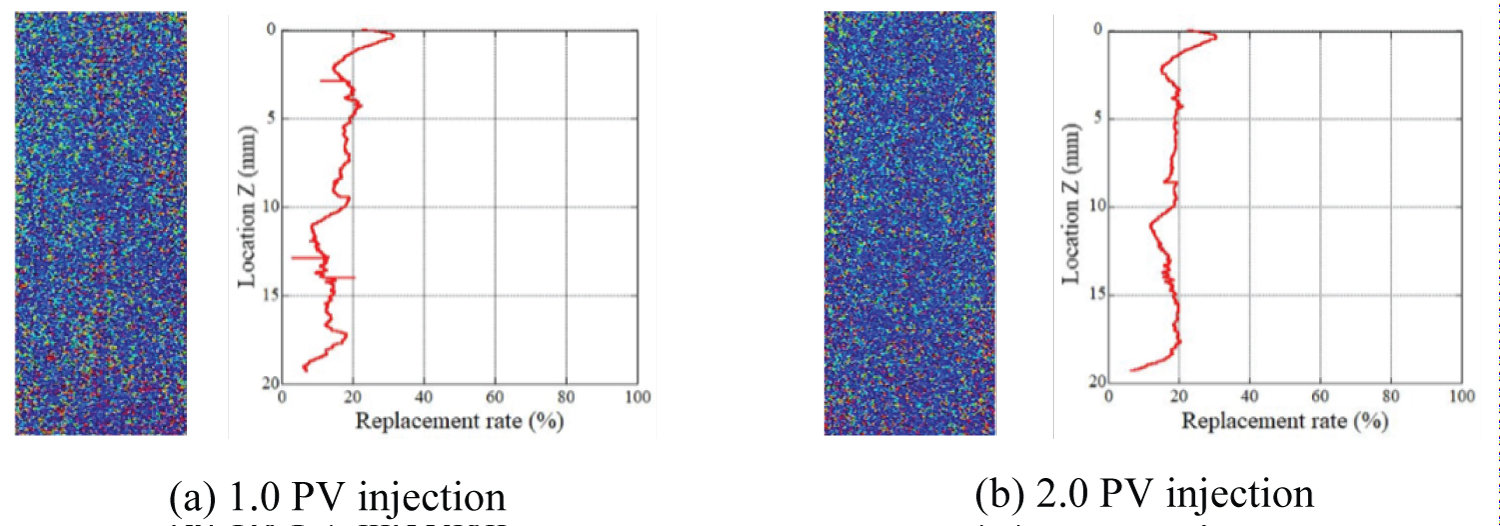
Figure 12: Replacement ratio after CO2 injection at...
Replacement ratio after CO2 injection at a pressure of 8 MPa (Sample Ai-b).
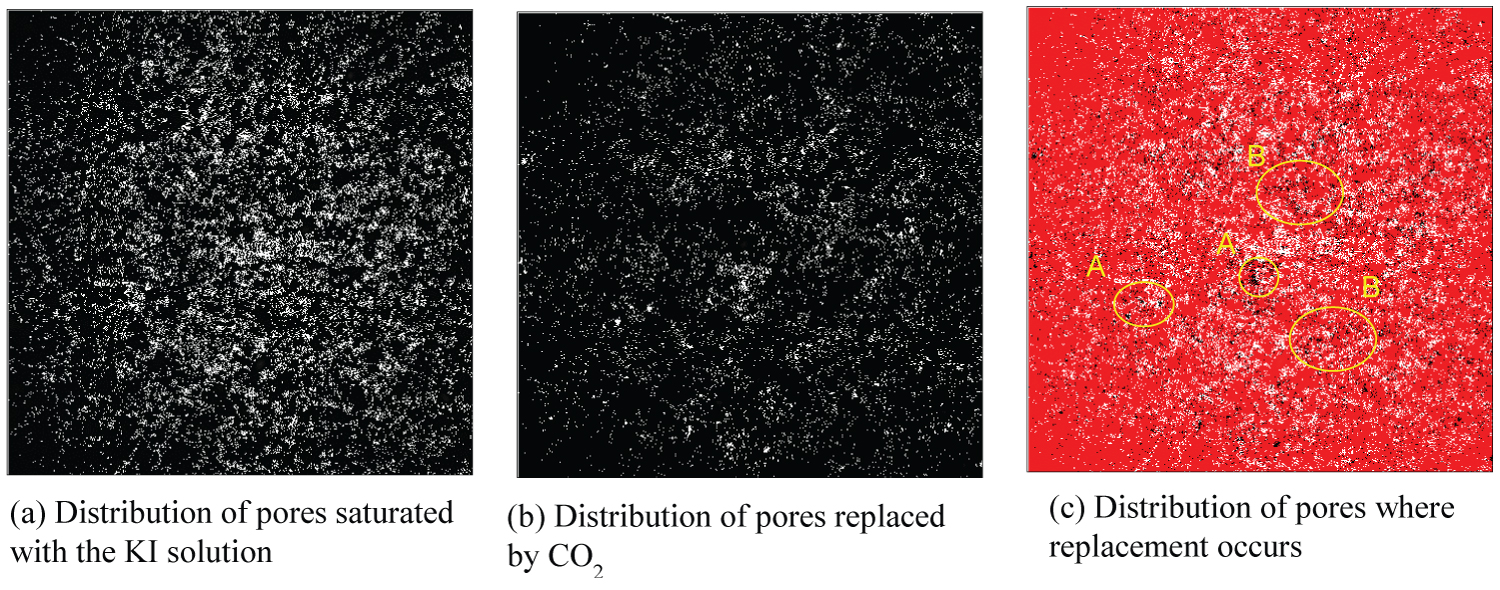
Figure 13: Binary CT images after CO2 injection...
Binary CT images after CO2 injection at 400 kPa (Sample Ai-a).
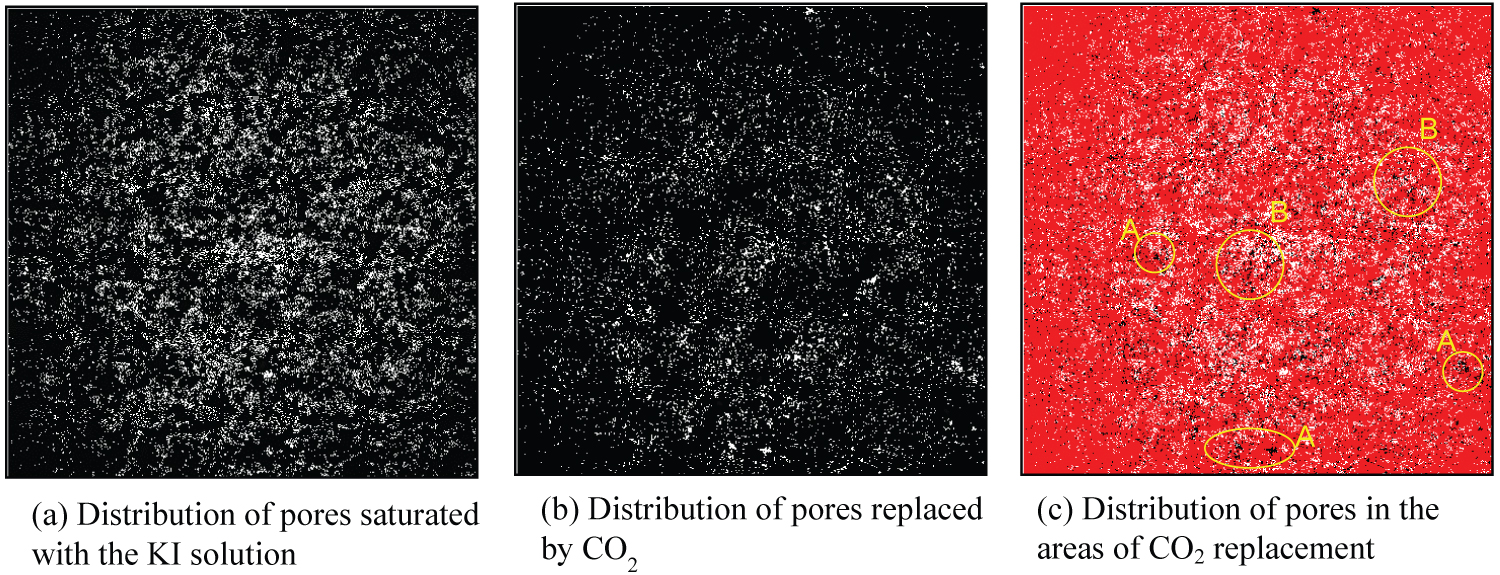
Figure 14: Binary CT images after CO2 injection...
Binary CT images after CO2 injection at 8.0 MPa (Sample Ai-a).
Tables
Table 1: Tomography conditions.
Table 2: Replacement ratio after CO2 injection under 400 kPa.
Table 3: Replacement ratio after CO2 injection under 8.0 MPa.
References
- (2007) Climate change 2007: The physical science basis, contribution of working group I to the fourth assessment report of the intergovernmental panel on climate change. World Meteorological Organization, United Nations Environment Program, Geneva, USA.
- Baklid A, Korbol R, Owren G (1996) Sleipner Vest CO2 disposal, CO2 injection into a shallow underground acquifer. SPE Annual Technical Conference and Exhibition, Denver, Colorado, US, 269-277.
- Zweigel P, Arts R, Lothe AE, Lindeberg E (2004) Reservoir geology of the Utsira formation at the first industrial-scale underground CO2 storage site (Sleipner area, North Sea). Geological Society, London, 223: 165-180.
- Furrea AK, Eiken O, Alnesa H, Vevatnea JN, Kiæra AF (2017) 20 years of monitoring CO2-injection at Sleipner. Energy Procedia 114: 3916-3926.
- Wilson M, Monea M (2004) IEA GHG Weyburn CO2 monitoring & storage project.
- Wildgust N, Gilboy C, Tontiwachwuthikul P (2013) Introduction to a decade of research by the IEAGHG Weyburne Midale CO2 monitoring and storage project. Int J Greenh Gas Control 16: S1-S4.
- Brown K, Whittaker S, Wilson M, Srisang W, Smithson H, et al. (2017) The history and development of the IEA GHG Weyburn-Midale CO2 monitoring and storage project in Saskatchewan, Canada (the world largest CO2 for EOR and CCS program). Petroleum 3: 3-9.
- Tanase D, Xue Z, Kano K (2008) Pilot CO2 injection into an onshore deep saline aquifer in Nagaoka, Japan. Journal of MMIJ 124: 50-60.
- Xue Z, Matsuoka T (2008) Lessons from the first Japanese pilot project on saline aquifer CO2 Journal of Geography 117: 734-752.
- Sawada Y, Tanaka J, Suzuki C, Tanase D, Tanaka Y (2018) Tomakomai CCS demonstration project of Japan, CO2 injection in progress. Energy Procedia 154: 3-8.
- Kitamura K, Honda H, Matsuo K, Ikemi H, Mitani Y (2018) Impact of CO2 injection speed on CO2 behaviour in two types of sandstone. 14th Greenhouse Gas Control Technologies Conference.
- Honda H, Kitamura K, Ikemi H, Mitani Y (2018) Experimental study on CO2 saturation of low-permeability sandstone under supercritical CO2 Int J Earth Sci Geophys 4: 016.
- Zhanga Y, Nishizawa O, Parka H, Kiyama T, Xue Z (2017) Relative permeability of CO2 in a low-permeability rock: implications for CO2 flow behavior in reservoirs with tight Interlayers. Energy Procedia 114: 4822-4831.
- Sato A, Ikeda K (2014) μ-focus CT Observation of Stored CO2 in Porous Media by the Histogram Subtraction Method. ISRM International Symposium - 8th Asian Rock Mechanics Symposium, Sapporo, Japan.
- Sato A, Yatsunami T, Ikeda K, Tsuda K, Fukumitsu T, et al. (2016) Pore scale analysis of diffusion phenomena in rocks by means of μ-focus X-ray CT. Journal of the Society of Materials Science Japan 65: 451-456.
- Sato A, Nishizono J, Fujita K, Obata M (2018) Verification of the inhibitory effect of the aquo-siloxane method on material migration in porous rock using the μ-focus X-ray computed tomography method. Materials Transactions 59: 1731-1738.
- Sato A, Arimizu T, Yonemura, Sawada A (2009) Visualization and analysis of the tracer migration process in the crack by means of X-ray CT. Journal of MMIJ 125: 146-155.
- Sato A, Ikeda K (2015) Visualization of diffusion phenomena in the porous media by means of X-ray CT. Canadian Geotechnical Journal 52: 1448-1456.
- Suekane T, Ishii T, Tsushima S, Hirai S (2006) Migration of CO2 in porous media filled with water. Journal of Thermal Science and Technology 1: 1-11.
- Sato A, Tanaka K, Shiote T (2010) Analysis of residual CO2 trapping in the porous media by means of X-ray CT. Journal of MMIJ 126: 640-646.
- Perrin JC, Benson S (2010) An Experimental study on the influence of sub-core scale heterogeneities on CO2 distribution in reservoir rocks. Transport in Porous Media 82: 93-109.
Author Details
Akira SATO1* and Eldan ARKIN2
1Graduate School of Advanced Science and Technology, Kumamoto University, Japan
2Graduate School of Science and Technology, Kumamoto University, Japan
Corresponding author
Akira SATO, Graduate School of Advanced Science and Technology, Kumamoto University, 860-8555, Japan
Accepted: August 12, 2021 | Published Online: August 14, 2021
Citation: SATO A, ARKIN E (2021) Analysis of the CO2 Storage and Migration Characteristics of a Low-Permeable Sandstone using the μ-Focus X-Ray CT Method. Int J Earth Sci Geophys 7:053
Copyright: © 2021 SATO A, et al. This is an open-access article distributed under the terms of the Creative Commons Attribution License, which permits unrestricted use, distribution, and reproduction in any medium, provided the original author and source are credited.
Abstract
Carbon dioxide capture and storage (CCS) is expected to be a promising method for reducing the amount of CO2 emitted into the air. In the CCS method, CO2 is pushed into the porous aquifer deep underground. Large-scale CCS sites have been operating in European countries, Canada, etc. Large and uniform aquifers are needed to achieve a large-scale CCS. However, it is difficult to determine the type of aquifer near the Japanese islands. Instead, porous rock layers, such as sandstones, which are suitable for reservoirs, are scattered in various places.
The purpose of this study was to analyze the storage and migration characteristics of CO2 in porous rocks. Here, Ainoura sandstone, which has a relatively high porosity and low permeability, was used as the rock sample. Gas and liquid and CO2 were injected into the rock samples saturated with a solution of potassium iodide, and the flow process and storage states were analyzed using a μ-focus X-ray CT scanner. The histogram difference method and image subtraction method were also employed to evaluate the replacement ratio obtained in the gas and liquid CO2 injection tests. Of note, these techniques can be used to extract density changes due to gas and CO2 injection into the pores. The replacement process was found to depend on the rock samples, even though the outlook of the rock samples was very similar. The replacement processes and the amount of replacement differed between gas and liquid and CO2. However, the mean value of the replacement ratio was not significantly different among the samples. Approximately 20%-40% of the pore volume was replaced by the gas and CO2.
Keywords
CCS, CO2, Replacement ratio, X-Ray CT, Low-permeable rock, Porous rock
Introduction
The reduction of CO2 exhaust in the atmosphere is a common global goal to avoid global warming [1]. In fact, this common goal was discussed at the Leaders' Summit on Climate in 2021. The Japanese government also revealed the goal of reducing emissions to 46% below the levels obtained in 2013 by 2030. Carbon dioxide capture and storage (CCS) is a well-known technology and is expected to be a promising method for reducing the amount of CO2 emitted into the air. CCS is a method in which CO2 is pushed into a porous aquifer deep underground. Large-scale CCS sites have been operating in the world. The CCS in the Sleipner area in Norway is the first industrial-scale underground CO2 storage site [2-4]. Operation at this site began in 1996, and approximately one million tons of CO2 is stored at this site every year. The CCS at Wyburn in Canada is another famous CCS site [5-7]. Here, the CCS site is combined with coal gasification power generation. The CO2 produced at the power station is carried to the CCS site, and approximately one million tons of CO2 is stored. A remarkable characteristic of this site is the additional role played by CCS in enhanced oil recovery (EOR). Several CCS projects have been conducted in Japan. The first demonstration experiment began in 2000 at Nagaoka [8,9], and approximately 10,400 tons of CO2 was injected into the saline aquifer for 18 months. Here, various types of activities to monitor CO2 movement were conducted, and their practicality was verified. The knowledge obtained at this site was passed down to the CCS demonstration project in Tomakomai, Japan [10]. The magnitude of these CCS sites is smaller than that of site in other countries, proving the possibility of domestic CCS under the complex geological structure in Japan.
Large and uniform aquifers are necessary for achieving large-scale CCS in the future. However, it is difficult to find large-scale aquifers near the Japanese islands. Currently, various types of porous sandstones exist near the coast. Therefore, the purpose of this study was to analyze the storage and migration characteristics of CO2 in porous rocks that spread widely near the Kyushu area in Japan. Here, Ainoura sandstone, which has a relatively high porosity and low permeability, was used as a rock sample. Kitamura, et al. [11] and Honda, et al. [12] conducted CO2 injection tests and found that the Ainoura sandstone has a high CO2 saturation ratio. Yi, et al. [13] also measured the relative permeability of low-permeability rock and found that CO2 was stored in 15% to 35% of pores in the rock. These results imply that CCS can be applied to various types of porous sandstone, despite the low permeability feature of the rock.
In this study, gas and liquid CO2 were injected into low-permeability rock samples saturated with a solution of potassium iodide (KI). The flow process and storage states were then analyzed using a μ-focus X-ray CT scanner. The researchers employed high-power industrial X-ray CT and μ-focus X-ray CT to visualize the existence of CO2 in the porous sandstone, Berea sandstone [14,15]. The replacement ratio during the CO2 injection process was evaluated using X-ray image analysis. As is well known, Berea sandstone is one of the representative porous rock types and has a relatively high permeability [15]. Generally, this type of rock formation is selected as a CCS site because it is easy to inject CO2 into rock formation. In this study, the target rock was Ainoura sandstone, which has relatively high porosity and low permeability. Herein, the applicability of this type of rock type was discussed to expand the possibilities of CCS in Japan. In this study, the histogram difference method and image subtraction method were employed to evaluate the replacement ratio obtained in the gas and liquid CO2 injection tests. These techniques can be used to extract density changes from CT image data owing to the injection of gas and CO2 into the pores. Moreover, the KI solution was applied to enhance the density change caused by CO2 injection. Here, the CO2 replacement processes were visualized, and the distribution of the replacement ratio during the injection process was evaluated. The existing form of CO2 in the pores was also visualized and discussed.
μ-Focus X-Ray CT Scanner System
When an X-ray is emitted to an object, the energy of the X-rays is attenuated according to the density of the distribution of objects. X-ray CT scanners utilize these characteristics and are well known as one of the most efficient non-destructive inspection techniques that can visualize the inside of materials. The X-ray CT scanner system detects the distribution of the X-ray attenuation coefficient, which is fundamentally proportional to the density.
The rock mechanics group of Kumamoto University has been operating a μ-focus X-ray CT system since 2010 (Figure 1) [14-16]. The maximum output of the system is 230 kV/600 μA, and this system is equipped with a flat-panel detector (FPD), which consists of 2000 × 2000 detection elements. In a 2D image, the maximum number of pixels is 2048 × 2048 while in a 3D image, the maximum available voxels is 1024 × 1024 × 1024. The most important aspect of the μ-focus X-ray CT system is its spatial resolution. In the case of our system, a minimum voxel size of 4 μm was available. When the target sample has a relatively high density, such as rocks, it is necessary to determine the optimum X-ray tube voltage, tube currency, sample size, distance from the X-ray source (FCD: focus-to-center distance), and other parameters. The values used in this study are presented in Table 1.
As mentioned, a CT image consists of a certain number of voxels, and each voxel has one value, called the grayscale value, G. For images captured via μ-focus X-ray CT, the relation between the density ρ and grayscale value G is generally given by
Where c is the "shift" value and is the constant value determined by the tomography condition. The value S is the "slope" value and represents the gradient of the grayscale value toward the density. The value of S also depends on the tomographic conditions. Thus, the density distribution in a CT image is expressed as the distribution of the grayscale values. When density values are necessary, the exact values of c and S are required. The procedure for determining the values, especially S, will be introduced later.
Evaluation of the Rock Sample
Rock sample
The sandstone, Ainoura sandstone, which is produced in the Nagasaki area in Japan, was used as a representative porous sandstone, and gas and CO2 injection tests were conducted on samples of this rock. Many different types of sandstones exit around Japan coast, this type of sandstone spreads large area of Japan. Moreover, the depth the rock exits is also suitable as a SSC site. Ainoura sandstone has a porosity of approximately 10% and a relatively low permeability. One-dimensional permeation tests were conducted on the rock samples before the CO2 injection tests. The intrinsic permeability was found to range from 10-17 m2 and 10-18 m2. Generally, the intrinsic permeability of the water shielding materials used in the landfill site was approximately 10-18 m2, which reveals the lower permeability of Ainoura sandstone and its sufficient capacity to store CO2.
The rock samples were initially drilled from blocks and processed to a diameter of 10 mm and a length of 30 mm. The sides of the rock samples were sealed with epoxy resin, and both ends were left free. The rock samples were fixed on a fixture made of aluminum, as shown in Figure 2. When gas or CO2 was injected from the top of the samples, the gas or CO2 passed through the rock samples and was discharged at the bottom. In the fixture, a hole was drilled at the center to discharge gas or liquid from the rock sample.
Initial CT images of the rock samples
To extract the fundamental characteristics of rock samples, the researchers usually conducted X-ray CT under two different conditions: Dry and fully water-saturated conditions. In this study, the purpose was to extract information regarding CO2, which was injected into the samples, under liquid/supercritical conditions in pore spaces. The density differences between water and CO2 in liquid/supercritical conditions were approximately 0.1-0.2 × 10³ kg/m3, and these liquids existed in the pores of rocks with a porosity of approximately 10%. As a result, the density change due to CO2 injection was minimal, and identifying this density change using the X-ray CT scanner system was difficult. A potassium iodate (KI) solution was used as a contrast agent to provide sufficient density contrast between the liquid in the pores and CO2. Sato, et al. [17,18] used the KI solution as a contrast agent, and revealed its suitability for visualizing the material flow and diffusion phenomena using an X-ray CT scanner. The KI solution contains a high atomic number of ion I-, and X-rays are significantly attenuated by the presence of this ion. Using the KI solution, the density difference between the KI solution and CO2 was more significant than that between water and CO2, and the density change due to CO2 migration was easily detected by the X-ray CT scanner system. Moreover, the viscosity of the KI solution was almost the same as that of water. Here, the rock samples were initially fully saturated by the KI solution. Thereafter, CO2 was injected into the samples.
In the saturation process, rock samples were placed in the KI solution under vacuum conditions and saturation was confirmed until the mass change converged. For the Ainoura sandstone used in this study, it took approximately 1 to 2 weeks for the samples to become saturated. Examples of CT images under dry and KI saturated conditions are shown in Figure 3. The CT images consisted of 1024 × 1024 voxels, and each voxel had one grayscale value. Generally, the brighter part of the images represents a higher-density region in the CT images. As shown in Figure 3b, the image is saturated by a high-density KI solution, and the image is brighter than that in Figure 3a.
Problems with the KI solution and translation of the grayscale value to density
As stated previously, the X-ray CT scanner system was used to detect the distribution of the density, and the density distributions are represented by grayscale values at each voxel in the CT images. For the KI solution used in this study, the grayscale value was proportional to the density. However, the absolute values of the grayscale indicate different values from those of other materials. The absolute value of grayscale depends on the tomography conditions, such as the X-ray tube voltage, current, sample size, and device-specific scan mode. To avoid this problem, Sato, et al. [16] evaluated the relationship between the mean grayscale values and mean density of different materials, such as air, water, and rocks, from 10% to 30% KI solution. The slope of the KI solution (see Equation (1)) was found to be markedly larger than the slope evaluated among air, water, and rocks. Here, the slopes of the KI solution and other materials are denoted by SKI and Sg, respectively. Because the grayscale values are influenced by the tomography conditions, X-ray tomography was conducted using the same size of samples under the same tomography conditions. In this study, all CT images were captured using the sample size and the same tomography conditions indicated by Sato, et al. [16]. The value of SKI = 5.12 m3/kg was used in this study; this value also indicates the density resolution of the μ-focus X-ray CT scanner used in this study under the tomography conditions stated above.
Evaluation of the Porosity and Replacement Ratio
Histogram subtraction method for the 3D CT data
As a method to evaluate porosity from the 3-D CT image data, the histogram subtraction method was introduced in this study. The researchers introduced an image subtraction method to extract the density change from the 2-D CT image data [17-19]. However, the amount of data becomes massive in the 3D image data; thus, the histogram of grayscale in the 3D image data is utilized [14]. The fundamental idea of this method is illustrated in Figure 4. As stated previously, CT tomography was conducted under dry and KI-saturated conditions. For each case, a histogram of the grayscale was obtained, and subtraction between these two histograms was performed; the histogram under the KI saturated condition (Figure 4a) was subtracted from the histogram under dry conditions (Figure 4b). By performing the subtraction, information that is not related to the density change, such as the existence of minerals, is eliminated, and information regarding the density change between the air and KI solution in pores can be extracted. For the CT image under the KI saturated condition, the frequency of higher grayscale values becomes larger than that under the dry condition as the high-density liquid occupies pores. When the subtraction is conducted between the two histograms, the frequency of lower grayscale values in the histogram, which indicates the region containing pores with air, has negative values as the air in the pores is replaced by the KI solution, and the frequency of the lower grayscale part is decreased. However, the frequency of higher grayscale values has positive values as the frequency of the higher grayscale part is increased. Regions A and B in Figure 4 represent the number of voxels where the replacement between air and KI solution occurred, and the ratio of the voxel number in regions A or B against the total voxel number indicates the porosity of the sample.
Image subtraction method for the KI-saturated rock sample
For precise observation of the CT images, including the location of pores and the state of replacement, 2D images are preferred in many cases. Further, it is easy to extract a slice image from 3D image data. Therefore, the image subtraction method was also applied to 2D image analysis in this study. The researchers applied this method to extract the information related to density change for the 2D CT images, and the porosity distributions and movement of tracer in pores were evaluated using the technique described previously [17-19]. This method subtracts images under different conditions, such as dry and KI saturated conditions. By conducting the subtraction, only the necessary information related to the density change can be extracted. Here, the porosity distribution in the 2D image was evaluated using this method.
A CT image consists of n × n pixels in a 2D image. Here, address (i, j) is given to each pixel. The grayscale value under the dry condition at address (i, j) is denoted by Gd(i, j), and that under the KI saturated condition is denoted by GKI(i, j). The increment of the grayscale value ΔG(i, j) obtained by conduction image subtraction is:
Using the slope of the KI solution, SKI, discussed in Section 3.3, the porosity of the pixel at (i, j), φ(i, j) is given by the following equation:
The results of the evaluated porosity distribution on the plane along the cylindrical axis of the rock sample (Figure 5) are shown in Figure 6. The color represents the distribution of porosity in the range of 0%-15%. The warm color represents the region where porosity is higher while the cold color represents the region where porosity is lower. From visual inspection, the rock sample, Ainoura sandstone, appeared relatively homogeneous. However, the porosity values differed from part to part in the rock sample, and the distribution of porosity was not uniform. For example, the porosity distributions of samples Ai-a and Ai-b were relatively uniform. However, the region where porosity was approximately several percent was concentrated at the bottom of sample Ai-a.
Evaluation of the replacement ratio
In this study, the gas-phase or liquid-phase of CO2 was injected into the KI-saturated rock samples. Thereafter, the replacement process between the gas/liquid phase of CO2 and KI solution was visualized using a μ-focus X-ray CT system. To evaluate the amount of replaced spaces in a rock sample, the replacement ratio was calculated. The replacement ratio is the ratio of the pore spaces in which the KI solution is replaced by the gas/liquid phase of CO2. For example, when half of the pore spaces were replaced, the replacement ratio was 50%. The ratio was also evaluated from the grayscale values obtained during the injection processes. As described in the previous section, the grayscale values under the dry and KI saturated conditions are denoted by Gd(i, j) and GKI(i, j), respectively. The grayscale values during the gas and liquid phases of the CO2 injection process are denoted by Ggas(i, j) and Gliq(i, j), respectively. The replacement ratio during the gas injection process Rgas(i, j) is given by:
The replacement ratio during the liquid injection process Rliq(i, j) is given by:
Procedures for the Injection Tests
Experimental apparatus
The pressure vessel designed for the injection tests is shown in Figure 7. The main part of the pressure vessel is made from aluminum to avoid X-ray attenuation; however, the vessel can be pressurized up to 25 MPa. This part of the vessel has a cylindrical shape with an inner diameter of 20 mm. Basically, a rock sample with a diameter of 10 mm and length of 100 mm was installed inside the vessel. In this case, a sample with a diameter of 10 mm and length of 30 mm was used. This pressure vessel was fixed in the X-ray CT scanner by the shafts, as shown in Figure 7. As stated previously, the rock samples were initially saturated with the KI solution. Based on the experiences of the researchers, the rock samples were saturated with 30% KI solution. Thereafter, the rock samples were installed in the vessel with a fixing jig, as shown in Figure 2.
At both ends of the vessels, pressure valves (valves P1 and P2 in Figure 8) were installed to inject and exhaust the gas/liquid. Usually, these valves are connected to syringe pumps, and the flow rate and pressure are controlled. In this study, a Teledyne ISCO 500D syringe pump was used. This pump can control pressure ranging from 0 to 25 MPa and flow rate between 0.001 ml/min and 204 ml/min.
Injection procedures
After the rock sample was installed in the pressure vessels, valve P2 was closed, and the gas or liquid CO2 was injected from valve P1 and pressurized until the initial condition. In the gas injection tests, the injection pressure was maintained at 400 kPa. CCS is assumed to be conducted at a relatively shallower depth. X-ray CT tomography was conducted 30 min, 1 h, and 2 h after the start of the injection test.
In the liquid CO2 injection tests, liquid CO2 was injected at a flow rate of 0.01 ml/min. Here, the pressure was maintained at 8 MPa by another syringe pump connected to valve P2. X-ray CT was conducted after several pore volumes (PVs) of CO2 were injected. After the certain pore volume injection of CO2, X-ray tomography was conducted at each time. Because of the limitation of X-ray tomography, the temperature was kept at 25 °C in this study.
Both gas and liquid CO2 injection tests were conducted for each rock sample. Thus, gas injection tests were conducted on the prepared rock samples. After the gas injection tests, the samples were fully saturated with the KI solution. These samples were also used in the liquid CO2 injection tests. As each rock sample experiences two types of replacement processes, the difference between the two processes was visualized and analyzed using X-ray CT image data.
Results
Visualization of the replacement process
Evaluation of the gas CO2 replacement process: The distribution of the mean replacement ratio, Rg, along the cylindrical axis of the rock samples is shown in Figure 9 and Figure 10, in addition to the plane distribution of the replacement ratio. These results were obtained when gas CO2 was injected into the rock sample. In the figures of the plane distribution ratio, the warm color represents the region where the value of the replacement ratio is close to 100% while the cold color represents the region where the value of the replacement ratio is close to 0%. The injected gas migrated from the top to the bottom of the sample. As depicted in these figures, the distribution of the replacement ratio was not uniform and was dependent on the samples. In Figure 9 (sample Ai-a), the replacement ratio had larger values in the region near the bottom of the rock sample. As Figure 6a shows, the porosity of the bottom part of sample Ai-a is obviously lower than the other part. This low porosity region was easily replaced by CO2, however, the amount of the stored CO2 is very small. Once the gas penetrated through the samples, and the replacement process was terminated 30 min after initiating the injection test; this is because the distribution of the replacement ratio after 1 h and 2 h was almost the same as that after 30 min. The same tendency was observed in the other samples; the replacement process was terminated within 30 min. The distribution of the replacement ratios was almost uniform. In Figure 10 (sample Ai-b), the replacement process is depicted to progress gradually compared with that of the other samples, and the mean value was approximately 30%. These samples were drilled from the same block, and the rock block itself was homogeneous. Owing to the limiting spatial resolution of our μ-focus X-ray CT scanner, the exact pore networks in the rock sample could not be detected, and the connectivity of pores was assumed to differ from place to place in the rock sample.
Evaluation of the liquid CO2 replacement process: The distribution of the mean replacement ratio, Rliq, along the cylindrical axis of the rock samples is shown in Figure 11 and Figure 12, in addition to the plane distribution of the replacement ratio. These results were obtained when liquid CO2 was injected into the rock sample. More than 2.0 PV of CO2 was injected into sample Ai-a in the first cycle. As displayed in these figures, the replacement ratio was lower than that obtained when gas was injected in all cases. Moreover, the mean value was approximately 20% to 30%, despite the injection of more than 1.0 PV and 2.0 PV of CO2 into sample Ai-b. The distribution slightly differed from sample to sample, and the total replacement ratio increased as the volume of injected CO2 slightly increased. However, the increment in the replacement ratio due to injection was minimal. Such finding indicates that once the CO2 penetrates the samples, almost all CO2 continues to flow along the same path, and only a small amount of CO2 is stored in the rocks.
In both the gas and liquid CO2 injection tests, the proximate replacement ratio was approximately 20% to 40%, with no significant differences found between the gas and liquid injection cases. Such finding indicates that the total pore volume occupied by gas or liquid CO2 is almost the same, even under different pressure conditions.
Evaluation of the mean replacement ratio using the histogram subtraction method
The mean replacement ratio in a specific volume was evaluated by the histogram subtraction method in both the gas and liquid CO2 injection cases. A target region of 6 mm × 6 mm × 15 mm was extracted from the rock sample, and the histogram of the grayscale value in the area was compared. As the length of each side of the voxel was 13 mm, more than 245 million voxels were included in the target region. The mean values of the replacement ratios following the injection of gas and liquid CO2 are summarized in Table 2 and Table 3, respectively.
In the case of gas injection, CT was carried out after 30 min, 1 h, and 2 h. Thus, the gas was injected for at least 2 h. The mean replacement ratio was approximately 20% to 40%. For liquid injection, the results were very similar to those obtained for gas injection. In fact, the mean replacement ratio ranged from 20% to 40%, indicating that only 20% to 40% of pore spaces were replaced, and the KI solution continued to occupy the remaining spaces after 2 h of gas injection and 1.0 PV injection of the liquid. Once the gas penetrated the sample, the replacement process was terminated. The same type of injection tests for artificial porous materials and various types of rock samples was conducted, and the amount of stored CO2 in the rock samples was estimated [11-13,20,21]. In almost all cases, the evaluated saturation ratio of CO2 existed in the range of 30% to 40%, implying that the replacement occurred in 30%-40% of the pore spaces. In contrast to this study, these results were obtained using high-permeability rocks. Moreover, the materials and pore size distributions used in these studies differed from each other, and the total amount of stored CO2 in the samples was almost the same. Moreover, the percentage of stored CO2 relative to the total pore volume did not differ from each other despite the use of low-permeability rock samples.
Visualization of CO2 in pores
Using the mean replacement ratio determined using the grayscale subtraction method, information obtained between the gas and KI solution in the pores, and between the liquid and KI solution in the pores could be separated as described below.
The porosity of sample Ai-a was 10.9% based on histogram subtraction between the dry and KI saturated conditions. Therefore, in the histogram of the grayscale values in the dry condition, 10.9% of voxels with grayscale values in the lower region of the histogram represent the pore parts. The distribution of pores occupied by the KI solution is shown in Figure 13a. The brighter region represents the pores. Because the voxel size of the CT image was 12 μm × 12 μm × 12 μm, the pores, which were larger, could be visualized in this study. The same procedure was applied to the images between the KI-saturated condition and the one after the gas injection. The gas was found to replace 3.9% of regions toward total volume; 3.9% of voxels whose grayscale values are listed in the lower region of the histogram represents the pore parts where the replacements occurred. This region is shown in Figure 13b. Here, the brighter region represents the region in which replacement occurred. By pilling Figure 13a and Figure 13b, the relationship between pore distribution and the region where the replacement occurred could be visualized. Here, the red part represents the rock mineral part, the white part represents the pore distribution, and the black plots represent the areas where the replacement occurred. The same procedure was also applied to the CT image data when liquid CO2 was injected into the samples; the results are shown in Figure 14. As shown in these figures, the replacement does not occur uniformly and the gas or liquid flows selectively. The replacements had a tendency to occur in the relatively larger pores (region A in Figure 13 and Figure 14) or in the region where small pores were concentrated (region B in Figure 13 and Figure 14). However, all large pores were not always replaced by gases or liquids. Once the gas or liquid migrated through the rock sample, the replacement process was terminated. When the gas or liquid migrated through the rock samples, the gas or liquid smoothly passed through the same path as the flow resistance becomes less than the resistance that caused the replacement.
Conclusions
Gas and liquid CO2 were injected into the low-permeability rock samples saturated with a solution of KI. Thereafter, the flow process and storage states were analyzed using a μ-focus X-ray CT scanner. To enhance the contrast of CO2 in the CT images, the rock samples were initially filled with KI solutions and the shift of the grayscale values in the CT images was corrected in advance.
The porosity distributions were estimated from the CT image data. As a result, the Ainoura sandstone was found to be relatively homogeneous. However, the porosity values differed from part to part in the rock sample, and the distribution of the porosity was not uniform.
The distribution of the injected gas and liquid CO2 was visualized as CT images by applying the image subtraction method. Although the mean replacement ratio was approximately 30%-40%, the distribution of the replacement ratio was not uniform, and was dependent on the samples. Owing to the limited spatial resolution of the m-focus X-ray CT employed herein, the detailed pore networks of the Ainoura sandstone could not be detected. Further, the connectivity of the pores was assumed to differ from place to place in the rock sample. In both the gas and liquid CO2 injection cases, the replacement ratio did not increase with further injections once CO2 penetrated the rock samples.
The histogram difference method and image subtraction method were employed to evaluate the replacement ratio obtained in the gas and CO2 injection tests. Based on the results, the mean value of the replacement ratio was less than 50%. Such findings align with those obtained using artificial porous materials and different rock types.
The presence of CO2 in the pores was determined. As suggested previously, the replacement does not occur uniformly. Instead, the gas or liquid flows selectively. The replacements tended to occur in relatively larger pores or regions where small pores were concentrated. However, all large pores were not always replaced by gases or liquids. Once the gas or liquid migrated through the rock sample, the replacement process was terminated.