
International Journal of Earth Science and Geophysics
(ISSN: 2631-5033)
Volume 7, Issue 2
Research Article
DOI: 10.35840/2631-5033/1854

Article Formats
Structural Interpretation and Depth to the Magnetic Basement, Using Aeromagnetic Data of Nkalagu and Abakaliki Areas, Southeastern, Nigeria
Table of Content
Figures


References
- Onyewuchi RA, Opara AI, Ahiarakwem CA, Oko FU (2012) Geological interpretations inferred from airborne magnetic and Landsat Data: Case study of Nkalagu area, Southeastern Nigeria. International Journal of Science and Technology 2: 178-191.
- Goodhope A, Luke M (2013) Structural interpretation of Abakiliki- Ugep, using Airborne and Landsat Thematic Mapper (TM) Data. Journal of Natural Science Research 3.
- Opara AI, Onyekuru SO, Essien AG, Onyewuchi RA, Okonkwo AC, et al. (2015) Lineament and Tectonic Interpretation over Abakiliki Area: Evidences from Airborne Magnetic and Landsat ETM Data. International Journal of Research and Innovations in Earth Science 2: 111-121.
- Ofoha CC (2015) Geological interpretations inferred from a high resolution aeromagnetic (HRAM) data over parts of Mmaku and environs, South Eastern, Nigeria. International Journal of Applied Science and Mathematical Theory 1: 48-60.
- Burke KC (1996) The African plate. South African Journal of Geology 99: 341-409.
- Ofoegbu CO, Onuoha KM (1991) Analysis of magnetic data over the Abakaliki Anticlinorium of the Lower Benue Trough, Nigeria. Marine and Petr Geol 8: 174-183.
- Ofoegbu CO (1985) A review of the geology of the Benue Trough, Nigeria. J Afr Earth Sci 3: 283-291.
- Nwachukwu SO (1972) The tectonic evolution of the southern portion of the Benue Trough, Nigeria. Jour Min and Geol 11: 45-55.
- Ugwu GZ, Ezema PO, Ezeh CC (2013) Interpretation of Aeromagnetic data over Okigwe and Afikpo Areas of the Lower Benue Trough, Nigeria. International Research Journal of Geology and Mining 3: 1-8.
- Geosoft Inc (1996) OASIS Montaj Version 4.0 user guide. Geosoft Incorporated, Toronto.
- Core D, Buckingham A, Bel?eld S (2009) Detailed structural analysis of magnetic data - done quickly and objectively. SGEG Newsletter.
- Holden EJ, Dentith M, Kovesi P (2008) Towards the automatic analysis of regional aeromagnetic data to identify regions prospective for gold deposits. Comput Geosci 34: 1505-1513.
- Kovesi P (1991) Image features from phase congruency. Journal of Computer Vision Research 3: 55.
- Thurston JB, Smith RS (1997) Automatic conversion of magnetic data to depth, dip, and susceptibility contrast using the SPITM method. Geophysics 62: 807-813.
- El Dawi MG, Tianyou L, Hui S, Dapeng L (2004) Depth estimation of 2-D magnetic anomalous sources using Euler deconvolution method. American Journal of Applied Sciences 1: 209-214.
- Reid AB, Allsop JM, Grauser H, Millet AJ, Somerton IN (1990) Magnetic interpretation in three dimensions using Euler deconvolution. Geophysics 55: 80-91.
- Liu S, Mackey T (1998) Using images in a geological interpretation of magnetic data. AGSO Research Newsletter 28: 17-19.
Author Details
Ejike Kingsley Nnaemeka*, Daniel N Obiora and Johnson C Ibuot
Department of Physics and Astronomy, University of Nigeria, Nsukka, Enugu State, Nigeria
Corresponding author
Ejike Kingsley Nnaemeka, Department of Physics and Astronomy, University of Nigeria, Nsukka, Enugu State, Nigeria.
Accepted: August 14, 2021 | Published Online: August 16, 2021
Citation: Nnaemeka EK, Obiora DN, Ibuot JC (2021) Structural Interpretation and Depth to the Magnetic Basement, Using Aeromagnetic Data of Nkalagu and Abakaliki Areas, Southeastern, Nigeria. Int J Earth Sci Geophys 7:054
Copyright: © 2021 Nnaemeka EK, et al. This is an open-access article distributed under the terms of the Creative Commons Attribution License, which permits unrestricted use, distribution, and reproduction in any medium, provided the original author and source are credited.
Abstract
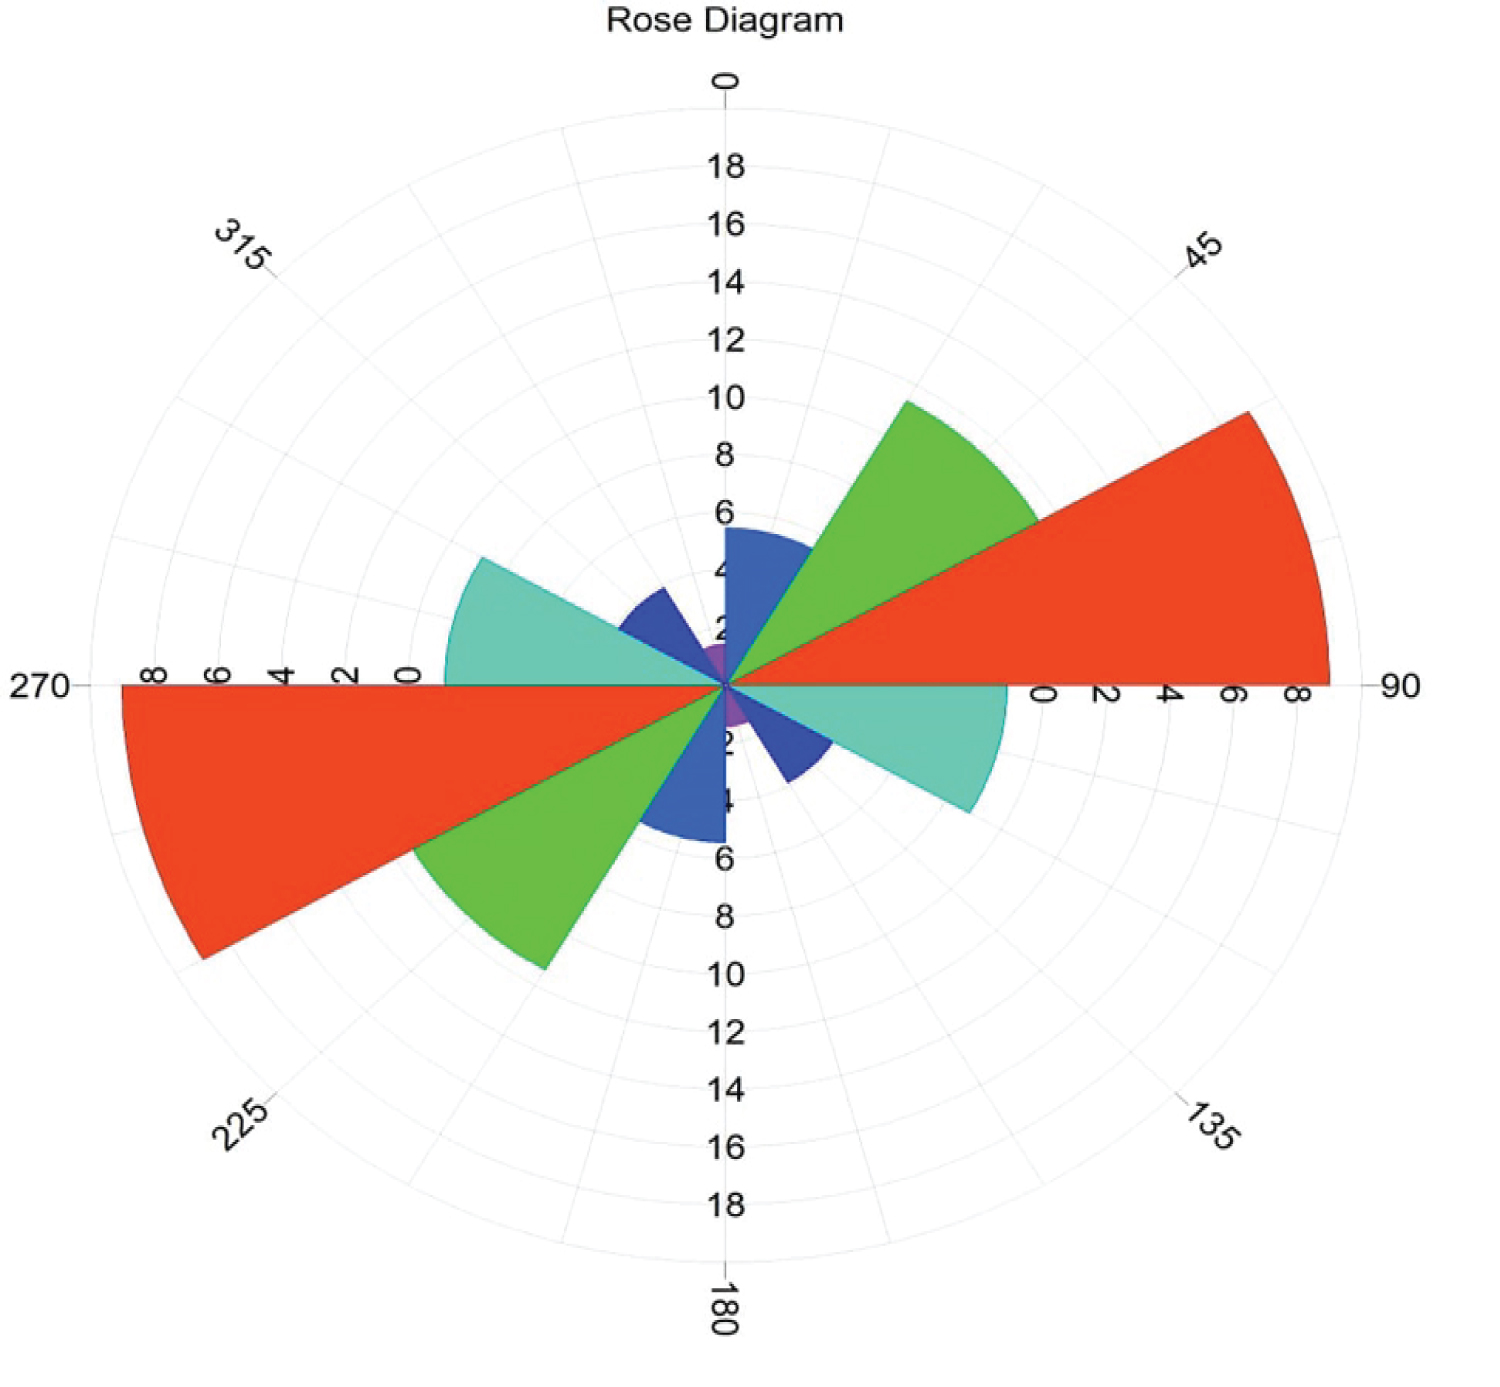
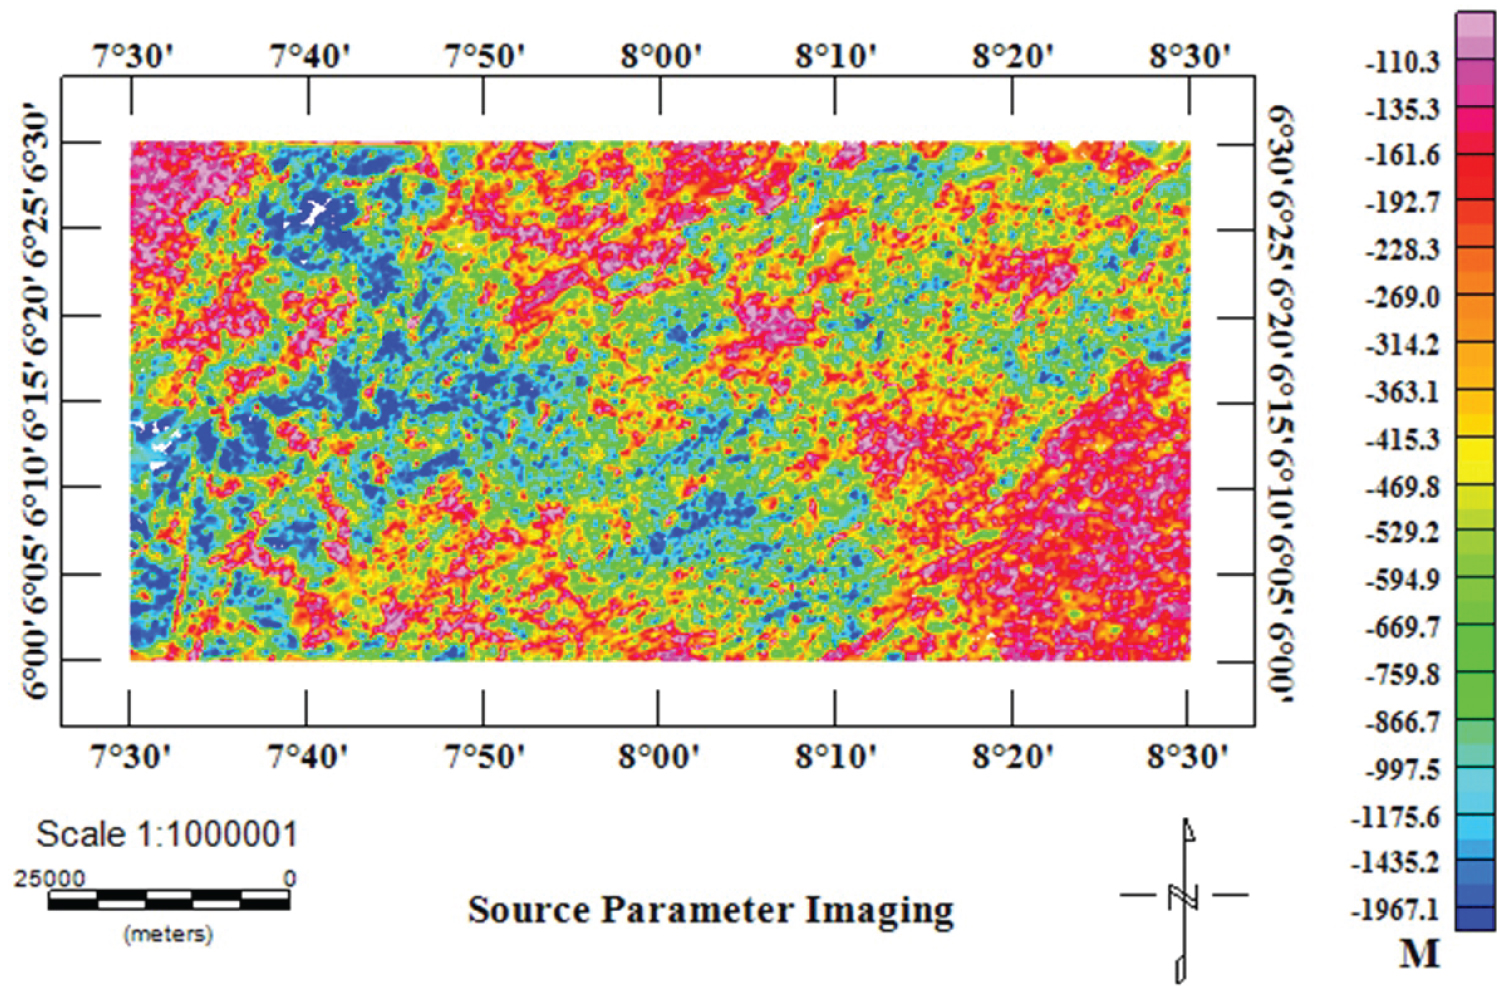
The aeromagnetic data of this region was interpreted to delineate its structural framework, as well as the depth to magnetic basement that could support accumulation of economic minerals. The acquired data was subjected to different enhancement techniques which include: Reduction to the equator (RTE) analytical signal, center for exploration targeting (CET) as well as two depth estimation methods of source parameter imaging (SPI) and located Euler deconvolution. Results from analytical signal and CET, delineated and enhanced the magnetic signatures that reflect the structural features of the area as suggested by the rose diagram which showed lineaments along NE-SW, ENE-WSW and WNW-ESE major trends and NW-SE, NNE-SSW, NNW-SSE minor trends, with evident of ENE-WSW and NE-SW trends as most dominant in the area. The result of the located Euler deconvolution estimate depth to basement and location of geological structures such as contact, faults while the result from SPI revealed a depth range between -110.3 m to 866.7 m (shallow magnetic source bodies) and 997.5 m to 1967.1 m (deep-seated magnetic source bodies). The depths obtained from these estimation methods are theoretically insufficient for hydrocarbon accumulation.
Keywords
Analytical signal, Structural trends, Euler deconvolution, CET, SPI
Introduction
The aeromagnetic methods have been employed in many geophysical investigations across the lower benue trough and Nigeria at large to map tectonic structures which serve as potential hosts for variety of mineral deposits, which could be guide for finding the requisite information on the mineral exploration campaign of the host rocks. Magnetic method play an important role in delineating structures like contacts, folds, faults, intrusions and shear zones for the detection of favourable areas of mineral deposits. The main objective of magnetic survey is to probe the internal structures of the earth based on the magnetic field variations that occur due to magnetic properties of rocks under the earth surface. It is of interest to know that, Structural interpretation and depth estimation have been carried out within the Trough; Onyewuchi, et al. [1] investigated Nkalagu area employing Landsat imagery and aeromagnetic in estimating basement morphology, depth to magnetic basement, relief and structural attributes associated with the area and to deduce the effects of such structures on the general tectonic history of the region. Their results revealed lineaments trending the NE-SW, NW-SE, N-S, and E-W directions and the dominant been the NE-SW trends. Their 2D spectral analysis obtained an average depth of 1.041 km for shallow sources and the deep sources with a mean depth of 3.574 km. Goodhope and Mamah [2] carried out structural interpretations of Abakaliki and Ugep using aeromagnetic and Landsat data to delineate tectonic lineaments areas, their result revealed NW-SE, NE-SW, N-S and E-W directions with dominant trends at the NE-SW directions.
Opara, et al. [3] Using qualitative methods on aeromagnetic data of Abakaliki, carried out the structural and tectonic features of the area and established lineaments trends aligned E-W, NE-SW, NW-SE, N-S directions and NE-SW been most dominant in the area. Their 2D spectral results obtained two depth sources of 2.46 km to 3.29 km, with mean depth of 2.9 km for deep sources and 0.35 km to 1.84 km with an average depth of 1.06 km for shallow sources.
Ofoha [4] carried out geological interpretations from high- resolution aeromagnetic data of Mmaku and Environs, South Eastern, Nigeria. They adopted qualitative methods and delineated structural trends at the NW-SE, E-W, N-S, NE-SW and NNE-SSW directions with NE-SW as most dominate trend. The purpose of this study is to investigate i) The structural framework, which are veins of minerals, that may or could aid exploration campaign within the study area (ii) depth of magnetic bodies and lastly, comparing the results obtained from the present study and that of previous research works within the area and parts of the Lower Benue Trough.
Geology and Location of Study Area
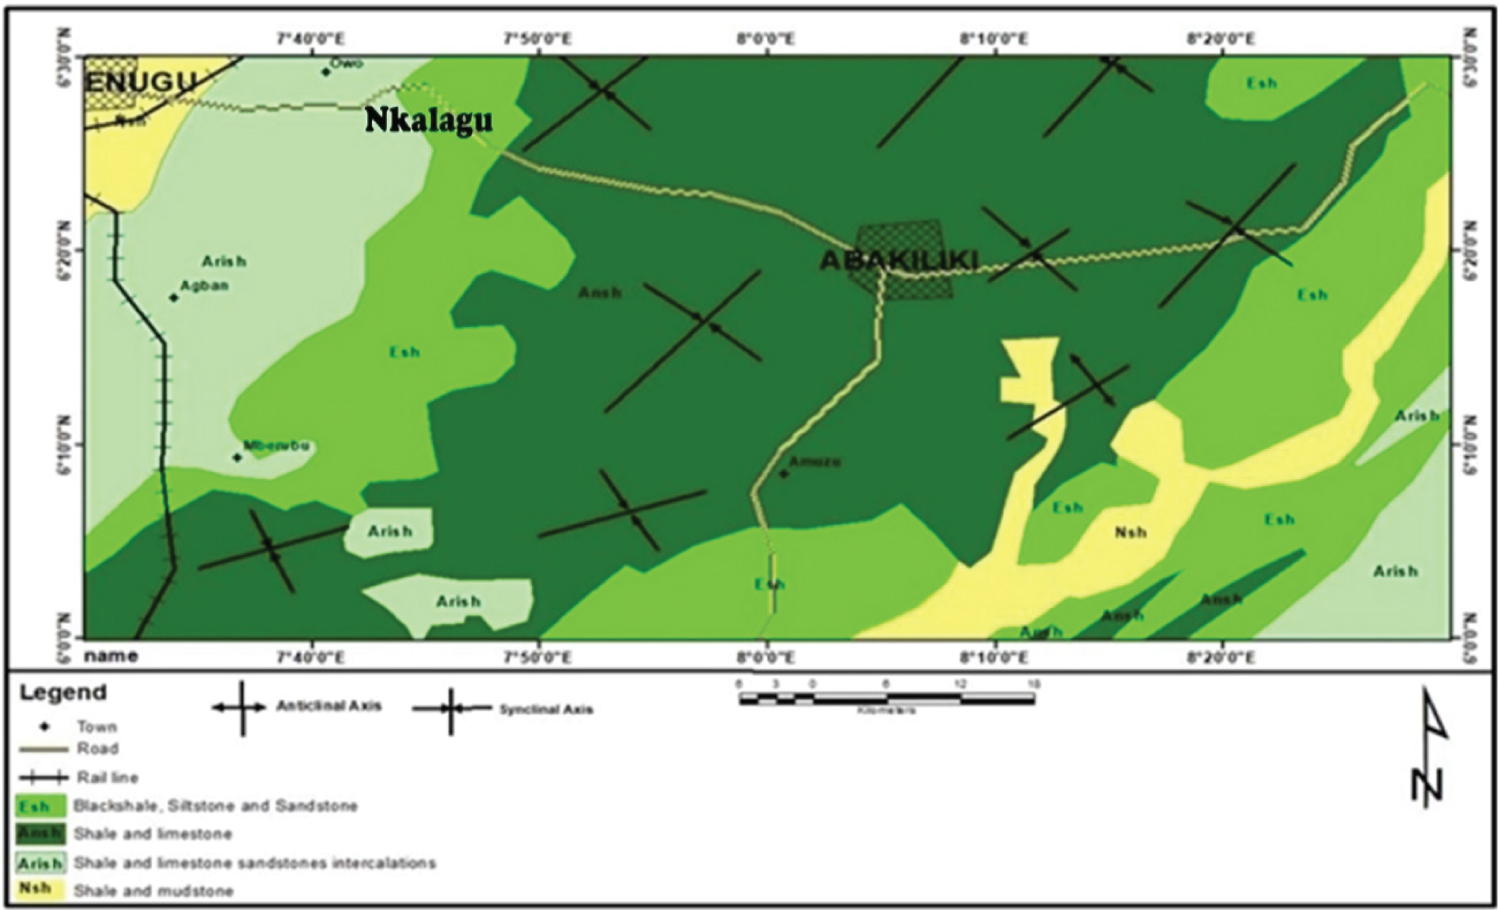
The study area is located between latitude 6° within the lower Benue Trough. It has a coverage area of around 6050 km2. The thick ssedimentary sequence that underpins the lower lower benue trough can be traced back to the tectonic processes that followed the separation of Africa and South America plates in the early crateceous (Burke 1996). The Anambra Basin, the Abakaliki Anticlinorium and the Afikpo Syncline are the main component units of the lower Benue Trough. The sequence's belongs to the oldest sediment from the Asu River Group, which sits unconformably on top of the Precambrian basement complex that is made up of granitic and magmatic rocks (Ofoegbu and Onuoha 1991). The Asu River Group whose type outcrops in Abakaliki is Albian in age and has an approximated thickness of about 2km (Ofoegbu, 1985). It is made up of argillaceous sandy shales, laminated sandstone units and small limestones with magnetic volcanics which interfingers (Nwachukwu, 1972). The geological map of the study area is shown in Figure 1.
Materials and Methods of Data Analysis
Materials
The materials adopted in this research work are aeromagnetic data of Nkalagu (302) and Abakaliki (303). carried out in Nigeria between the years 2005 and 2009 by Nigeria geological survey agency (NGSA). A flight altitude of 0.08 km, tie and flight line spacing of 2 km and 0.5 km was used in acquiring the data. This digital data acquired was made available on scale of 1:50000. The Software application employed to interpret and analyze the data, are the Oasis Montaj 8.4.2 and the ArcGis.
Methods of data analysis
The data processing started with producing the Total Magnetic Intensity (TMI) map adopting Bi-directional line gridding method, with further data enhancement method of separating the regional field from the total magnetic intensity field to obtain a residual data, using the polynomial fitting of the second order of least square method. The equation (1) below was adopted as the algorithm for the removal of regional data [9]. Thereafter, reduction to the magnetic equator (RTE) was carried out by filtering the residual data in accordance with the I.G.R.F reduction method using an amplitude correction of inclination 14.1 and declination -2.0 as basic inputs, since the study area is located in a low latitude region (area with geomagnetic inclination less than 15°) in order to return anomalies, back into line with the structures that produce them. The algorithm employed for this, was equation (2) below,
Where r is the regional field, and are the x and y coordinates of the geographic center of the data set respectively and , and are the regional polynomial coefficients.
If (/Ia/ < /I/), Ia = 1
Where,
L(θ) = Residual reduced to the equator, I = geomagnetic inclination, Ia = inclination for amplitude correction (never less than I), D = geomagnetic declination, Sin (I) = amplitude component and icos(I)cos(D-θ) = phase components.
Analytical signal
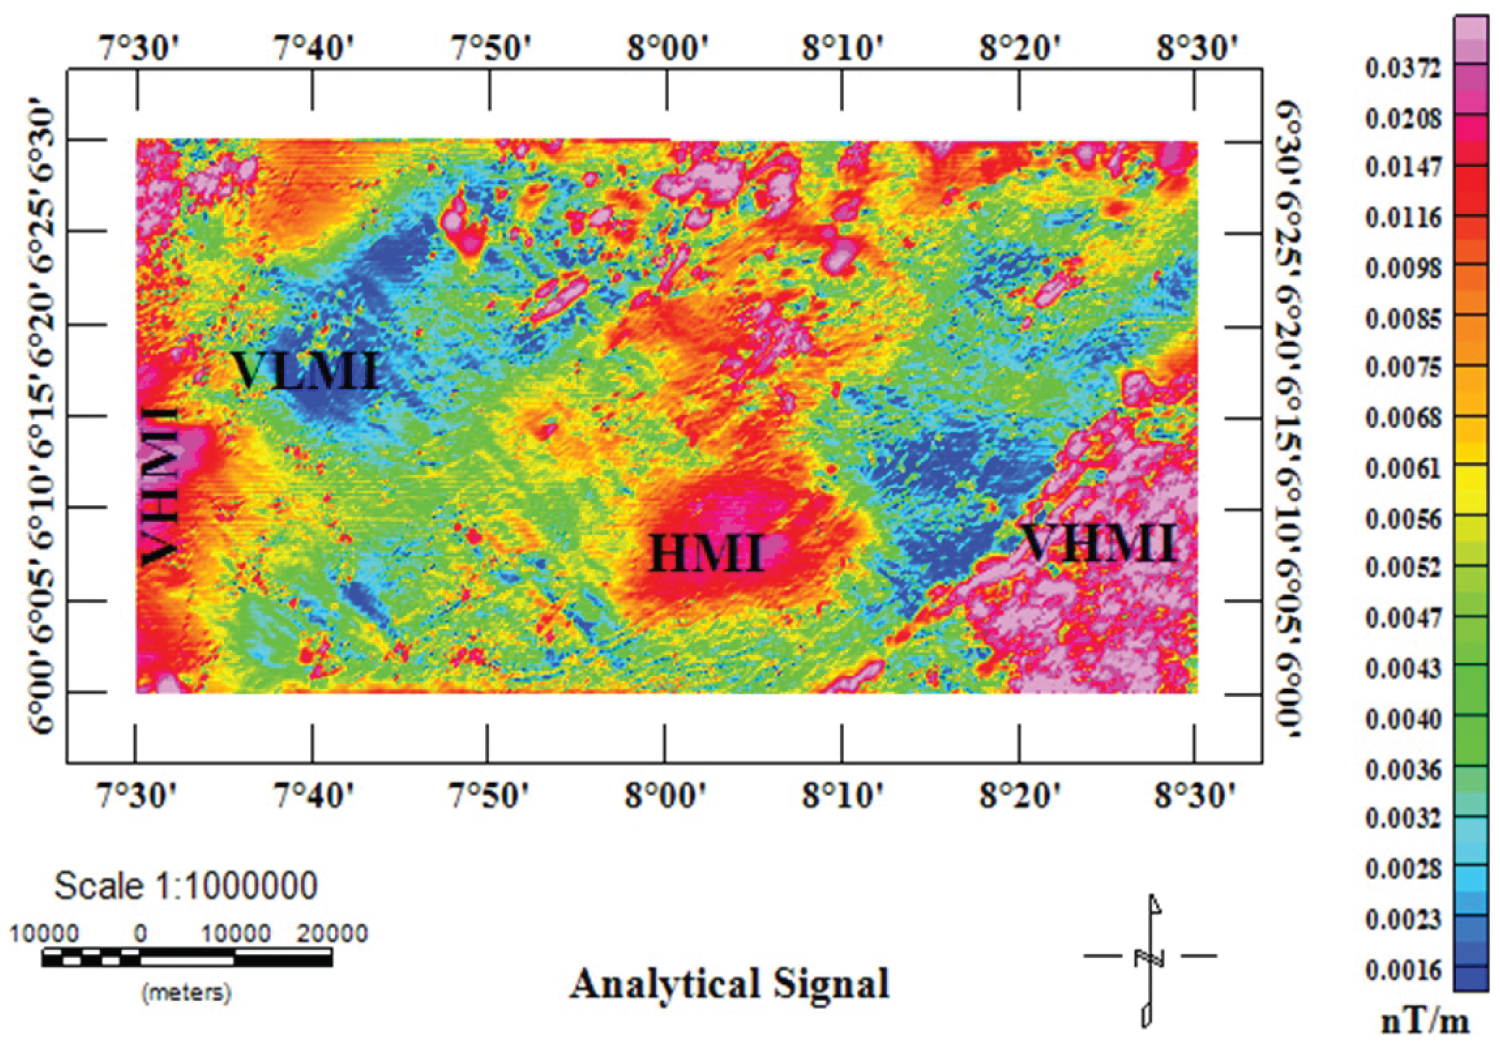
The analytic signal filter which generates a particular pattern of calculated magnetic anomaly improved map, that define edges (boundaries) of geological anomalous magnetization distribution, actually takes the magnitude of the square root of the vertical and horizontal components of the magnetic responses [10]. The equation (4) below was the algorithm developed in producing the analytical signal map.
Where F is the observed magnetic field at (x, y, z) directions.
Centre for Exploration Targeting (CET)
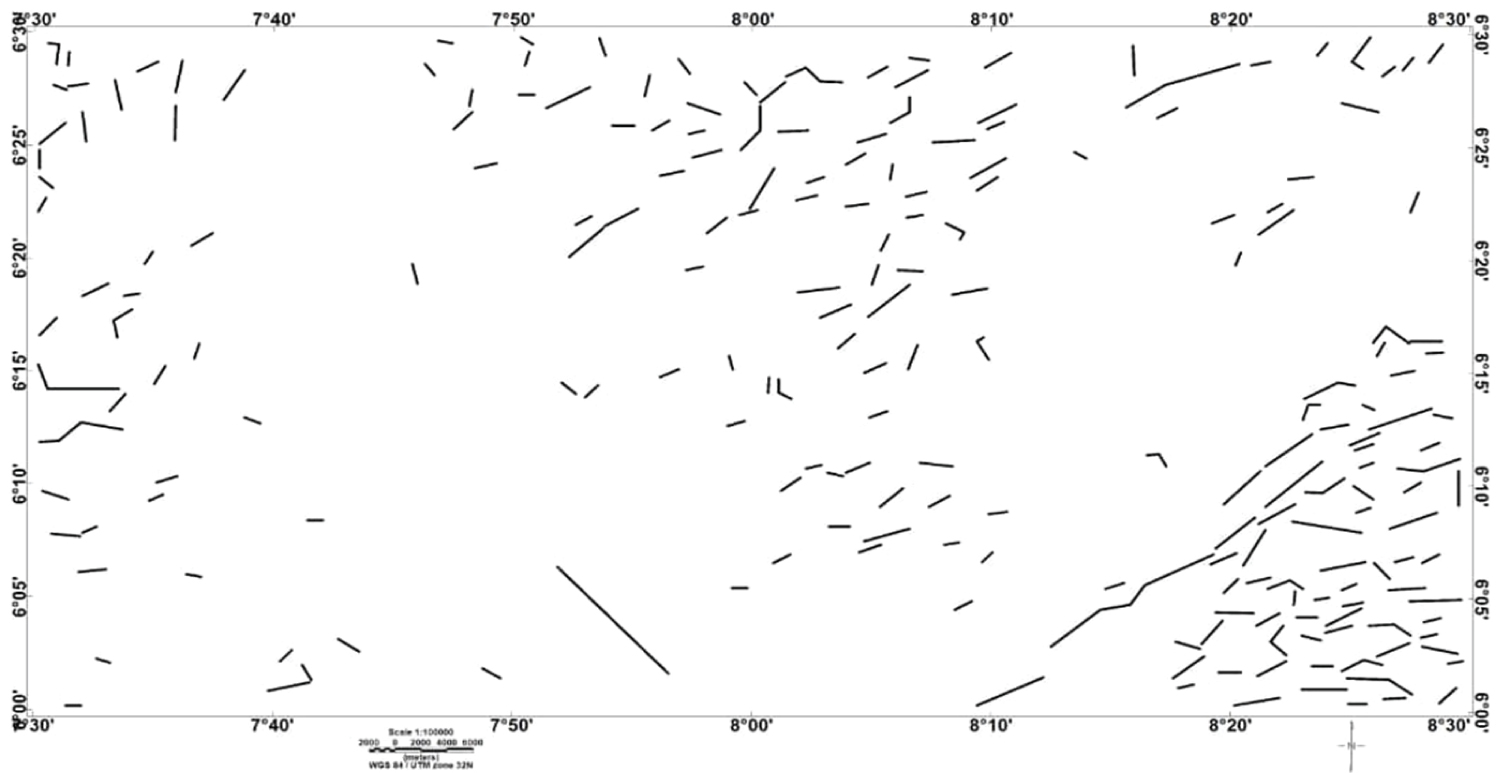
These are sets of algorithms which provides functionalities for enhancement, lineament detection and structural complexity analysis of the potential field data [11,12]. The process adopts the following method of identifing linear structures within an area through consecutive map byproduct forms of standard deviation which estimates magnetic variations. Equation (5) below was adopted as the algorithm [13].
This is followed by producing a structual map and rose diagram to identify several linear structures and directions of the orientation.
Source Parameter Imaging (SPI)
The technique developed by [14], which shows depths, edge locations, susceptibility contrasts and dips, utilizes the relationship between source depth and the local wave number (K) of the observed field and can be calculated for any point within a grid of data adopting vertical and horizontal gradients. The equation (6) below was the algorithm developed in producing the Source Parameter Imaging map [14].
Where the tilt is given as
Where HGRAD is horizontal gradient, T is total magnetic intensity (TMI) and , , are the first order partial derivates of the total magnetic intensity in x, y and z coordinates.
Euler deconvolution
Euler deconvolution is an inversion method that estimates the positions and corresponding depths of anomalous/geological sources, that relates the magnetic field and its gradient components to the anomalous sources with its degree of homogeneity expressed as a structural index [15]. The Euler 3D form of equation according to [16] is expressed mathematically as equation (7) below:
Where; x , y and z are the coordinates of a measuring point; , and are the coordinates of the source location whose total field is detected at x , y and z. b is a base level, is structural index and T is potential field. Structural indexes of 0 and 1 representing contact, fault and dyke was adopted for the present study and all the analysis each method was carried out using Oasis Montaj software.
Results and Discussion of the Study
Results
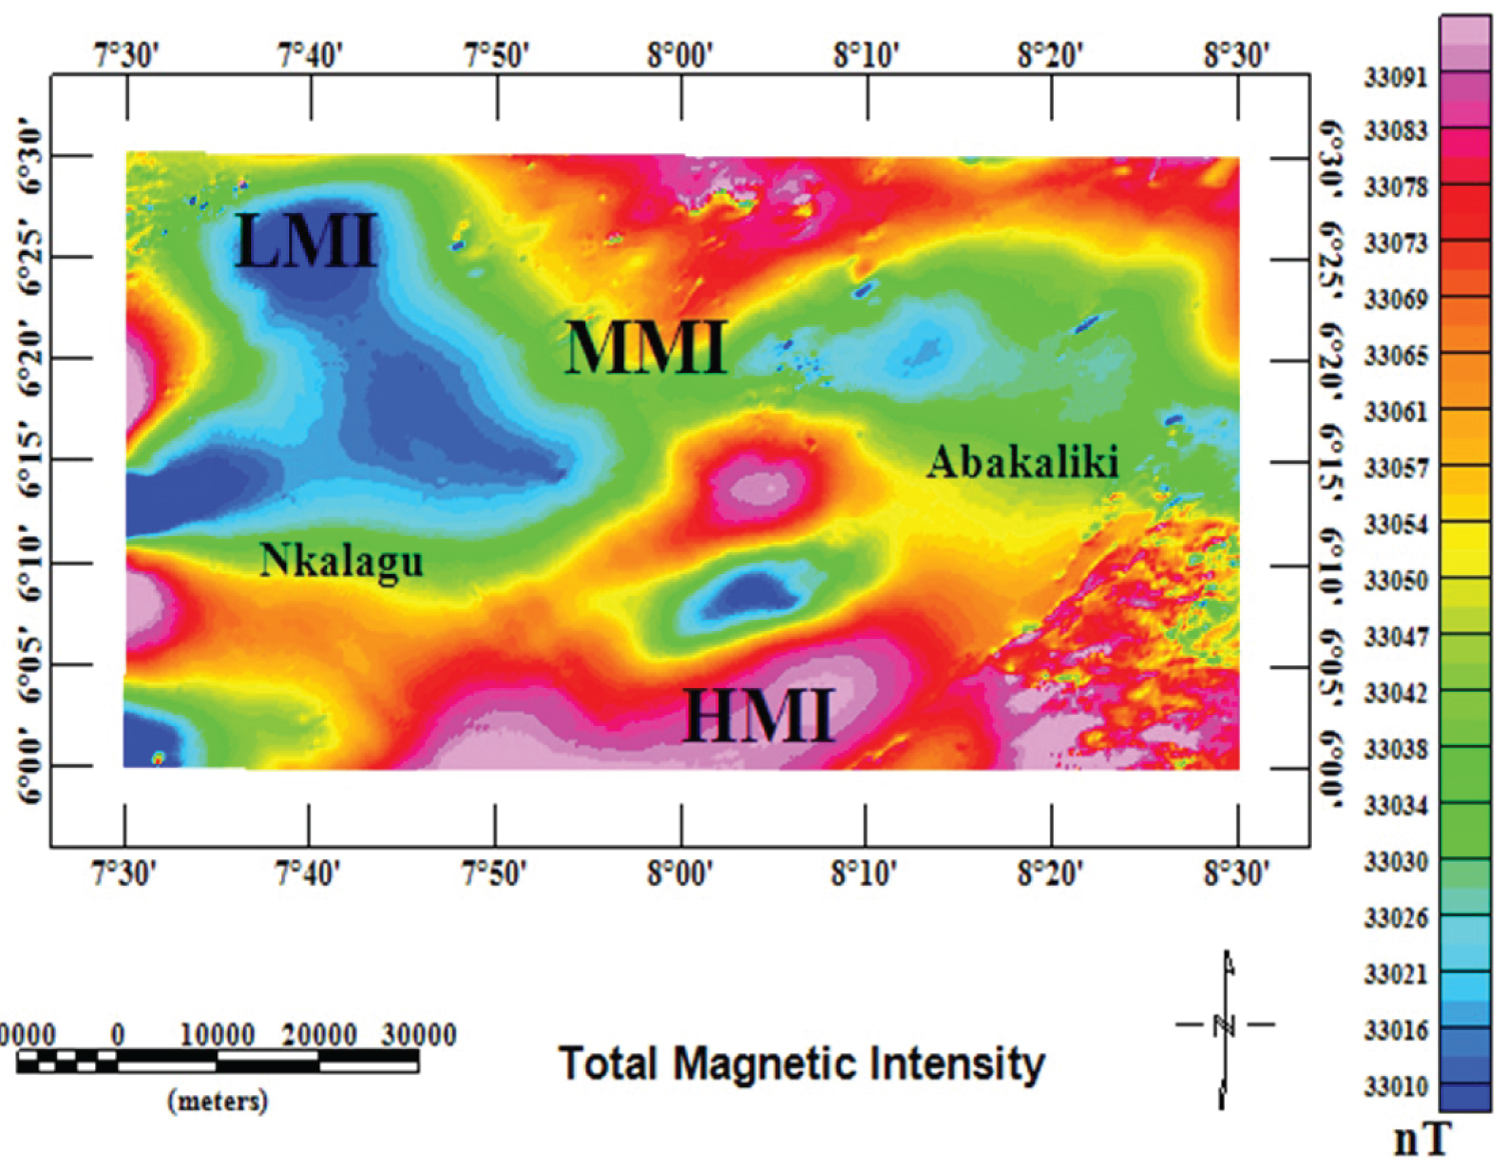
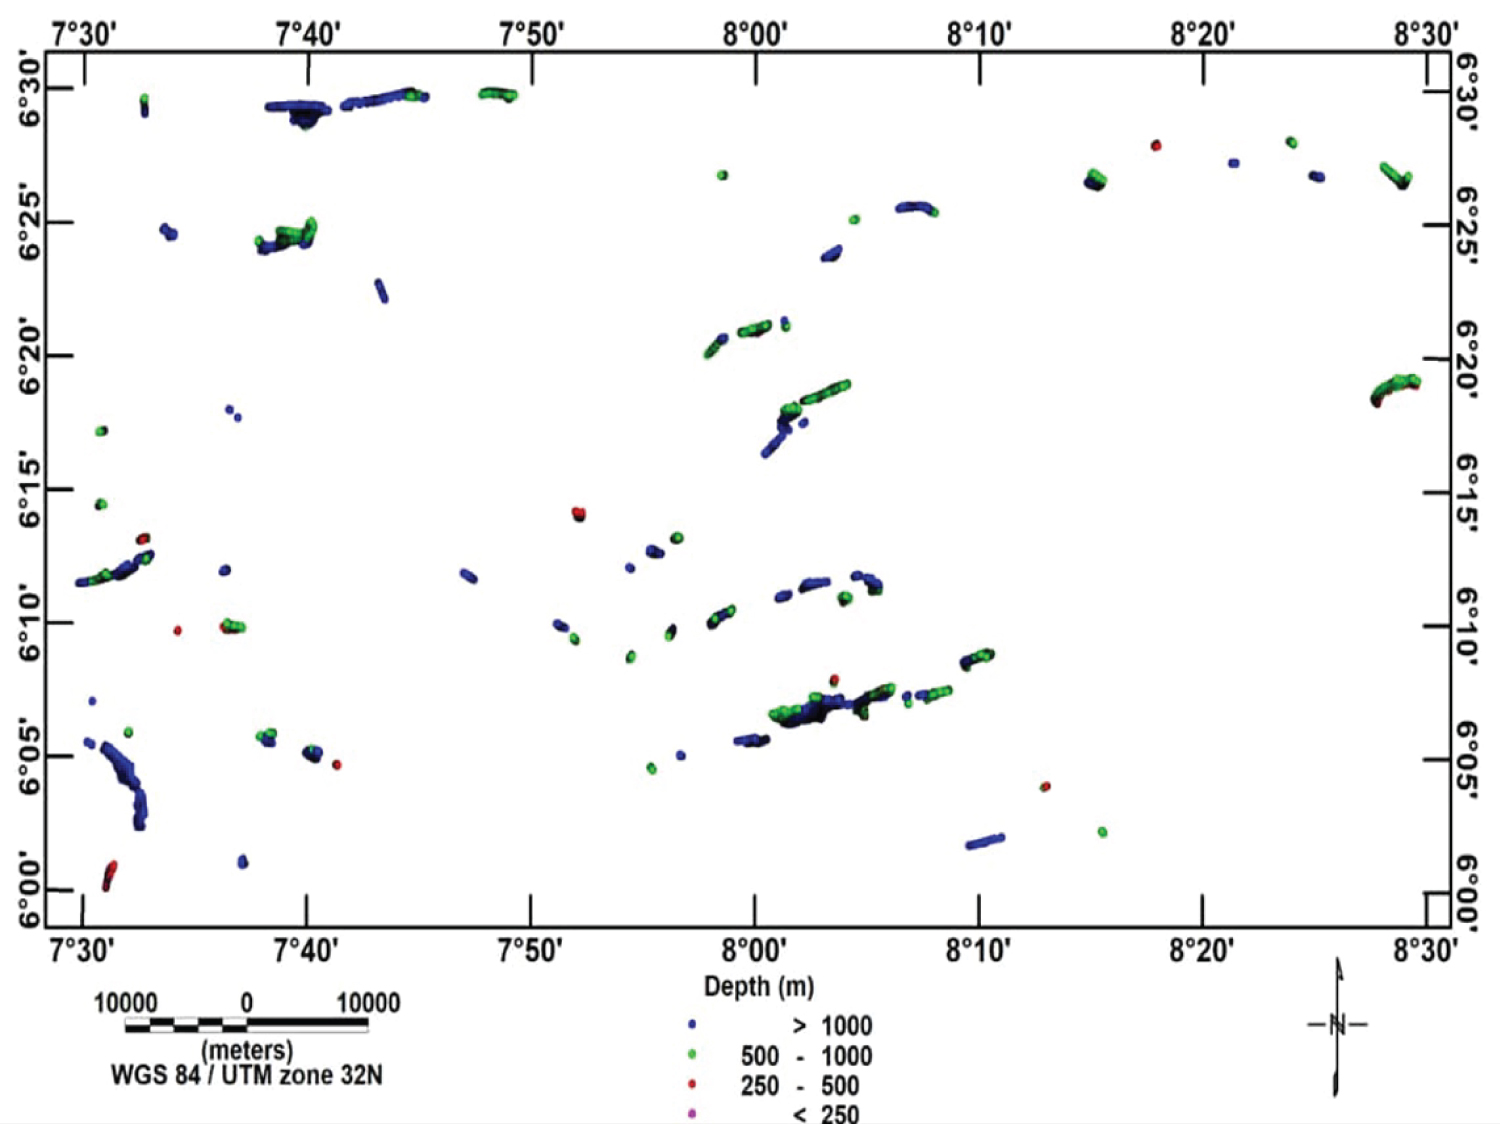
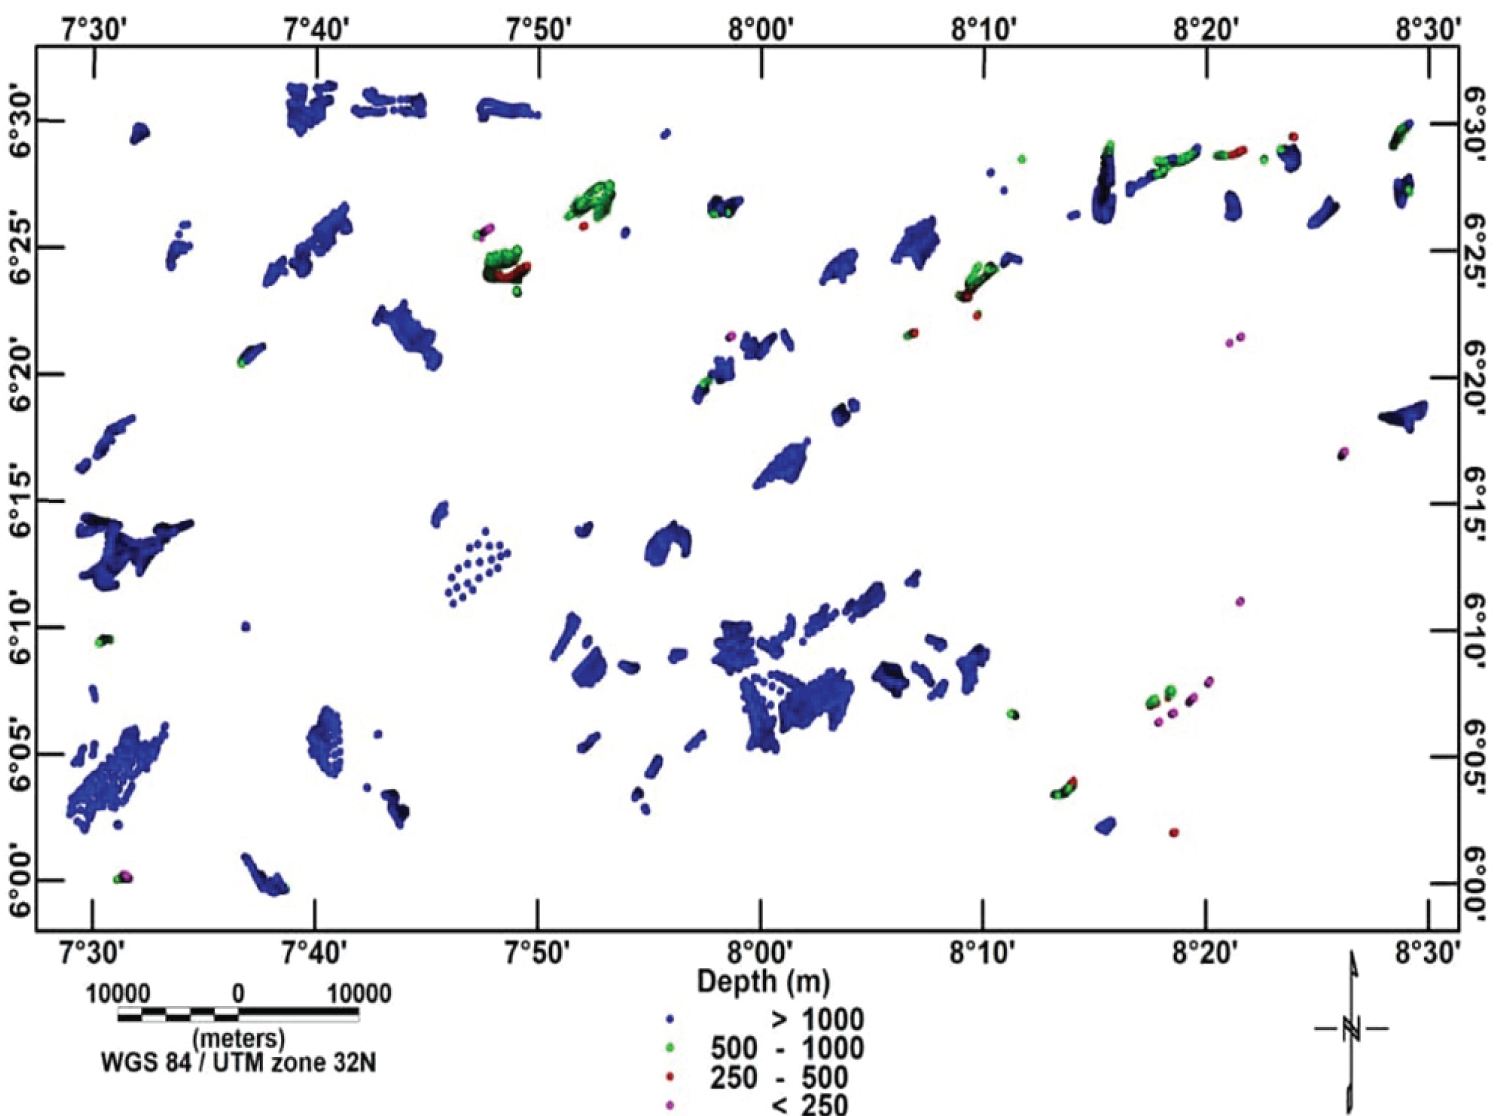
The TMI map (Figure 2) is characterized by intensities ranging between 3310 to 33091 nT with high, moderate and low magnitudes (magnetically heterogeneous). It is clearly represented by the colour variations, which enhances visibility of wide range of anomalies and their intensities. This variations inherent, may be associated with differences in depths and subsurface materials. A dislocation zone is noticed at the southeastern (SE) part representing structural features. The reduction to the magnetic equator (Figure 3) revealed similar feature of faulted zone at the southeastern part observed in the TMI map, but appeared smoother and defined the high and low centers better than the TMI map because the regional field have been separated from the TMI data. Its magnetic intensities ranges between 12.40 to 93.90 nT corresponding to lows and highs. Application of analytical signal filter on the aeromagnetic data (Figure 4) brought out distinctly the differences in edge extent of geological anomalous magnetization sources, showing prominent features of high analytical signal amplitude at the southeastern, northwestern, southwestern, central portions and spots trending northeastern borders of the area, which coincides closely well with the structural deformation of the area because areas of high analytical signal amplitudes are recorded around large areas of large mineral deposits [17]. The center for exploration targeting (CET), identified the presence of structures (lineament) within the area, through the standard deviation map (Figure 5a), which measures magnetic variations and thereafter, the structural map (Figure 5b) was produced to extract the lineaments, this was also followed by producing a rose diagram (Figure 5c) to reveal the frequency and orientation of the extracted lineaments, which reflect younger, older and deeper tectonic trends in the area. This extracted structures are aligned ENE- WSW, NE-SW, WNW-ESE, NNE-SSW, NW-SE and NNW-SSE directions. with ENE-WSW and NE-SW been the most dominant trends in the area. Depth estimation solotions of Euler 3D depth analysis using two different structural indexes (SI = 0 and 1), produced two 3D Euler maps as shown in (Figure 6a and Figure 6b). The Euler solution (depth) of structural index used presented a geological reasonable solution with structural index 0, representing (contact) while structural index 1 represents fault and dyke. The both structural index of 0 and 1 obtained depth values ranging from less than 250 to above 1000 respectively but less the 2000 m while the SPI depth weighting solutions (Figure 7) revealed depth results ranging between 110.3 m to 1967.1 m depicting shallow and deep magnetic sources.
Discussion
Results from analytical signal and CET revealed clear images of the geologic features by delineating and enhancing the magnetic signatures that reflect the structural features of the study area which trends ENE- WSW, NE-SW, WNW-ESE, NNE-SSW, NW-SE and NNW-SSE directions of the study portion which is in close agreement with ealier studies of [1-4]. These lineament directions are veins of mineral accumulation spots since magnetic minerals are structurally controlled. The depth estimated from 3D Euler and SPI reflected a similar result of depth below 2000m and correlates well with the shallow depths obtained from the spectral analysis of [1,3]. More so, it evident that both methods adopted for the research work didn't obtain good depths for hydrocarbon accumulation but could be depths for water extraction, environmental studies and mineral explorations. Finally, the result of the present study closely agrees with the previous research works investigated around the area and some areas of the Trough especially with that of the structural orientation and depth of shallow sources.
Conclusion
The aeromagnetic data proved very useful in delineating the structural architecture as well as the depth to the basement of this area, by presenting mineral exploration areas at ENE- WSW, NE-SW, WNW-ESE, NNE-SSW, NW-SE and NNW-SSE directions and the depths good for water exploration, environmental studies and mineral exploration depending on the depth been sort for.
Competing Interests
The authors declared no competing interest exists.