
International Journal of Experimental Spectroscopic Techniques
(ISSN: 2631-505X)
Volume 3, Issue 2
Research Article
DOI: 10.35840/2631-505X/8518

Article Formats
Stability of Polytetrafluoroethylene, Polyethylene, and Polystyrene Pellets as a Matrix for Analytical Terahertz Spectroscopy
Table of Content
Figures
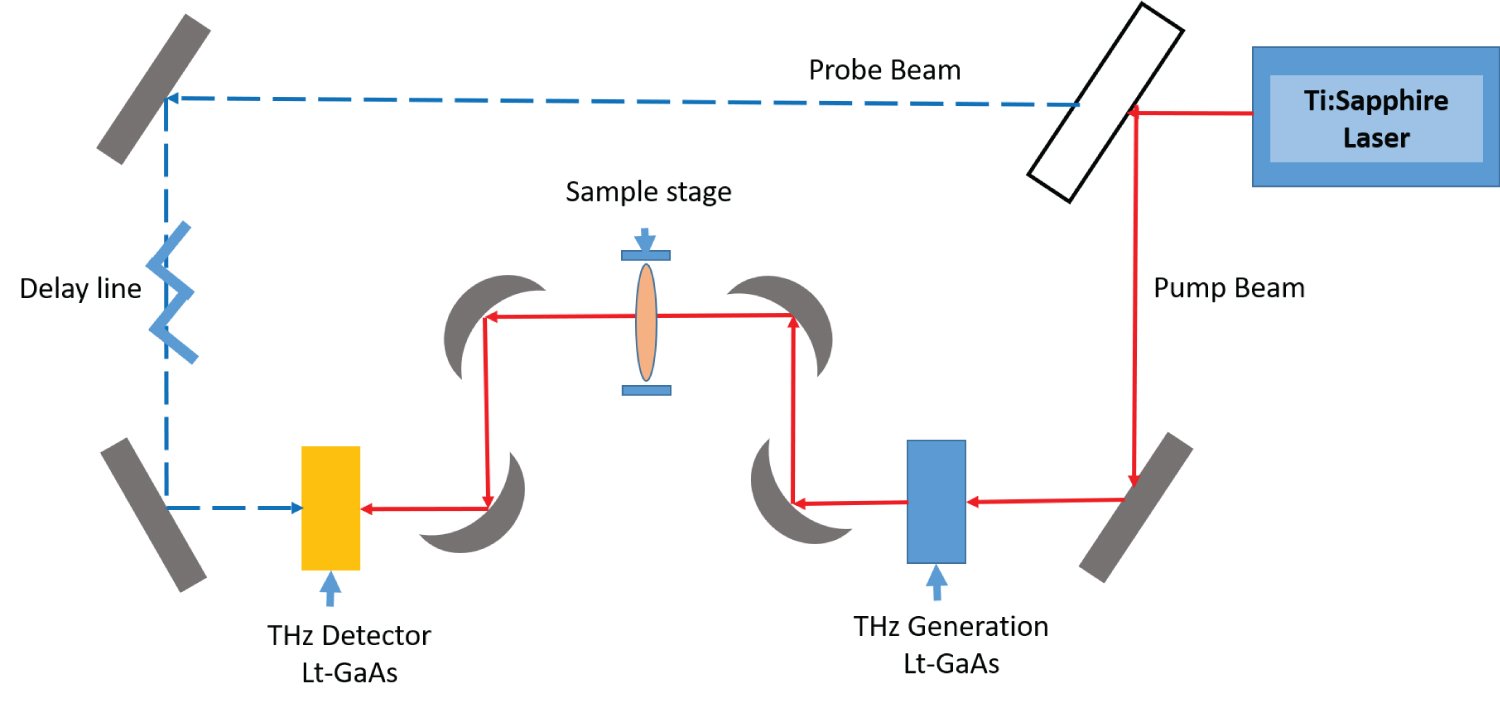
Figure 1: Schematic representation of...
Schematic representation of a time-domain THz spectrometer. The white box denotes a beam splitter, which splits the 800 nm incident radiation into individual pump (red, solid) and probe (blue, dashed) beams. The pump beam is directed to the THz emitter and subsequently the sample, while the probe beam is directed to an optical delay line using both parabolic and standard mirrors. When the pump and probe beams are co-incident on the detector (yellow box), the magnitude of the THz electric field is recorded.
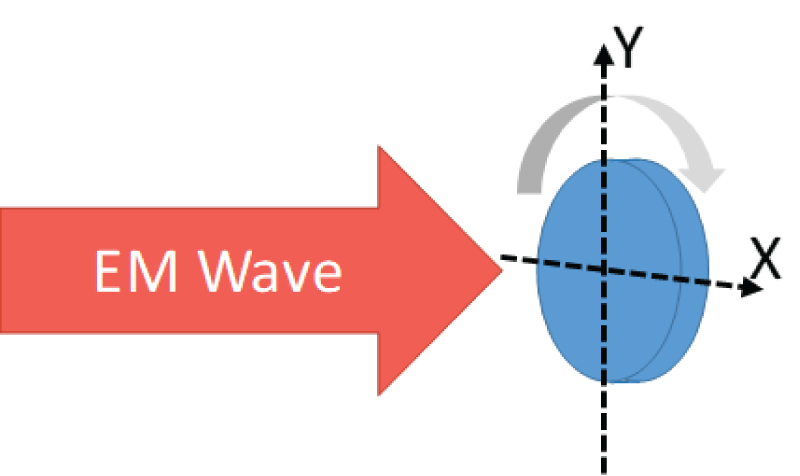
Figure 2: Schematic diagram showing...
Schematic diagram showing the direction of rotation and orientation of the sample pellet positioned relative to the optical axis of the transmission measurement. The pellet rotates in the XY plane, perpendicular to the axis of propagation of the electromagnetic wave along the z axis.

Figure 3: Absorptivity coefficient spectra...
Absorptivity coefficient spectra of PTFE (blue, solid), PE (red, dotted) pellets, and PS (black, dashed) collected on Day 1. Horizontal line provided to denote zero absorption coefficient.
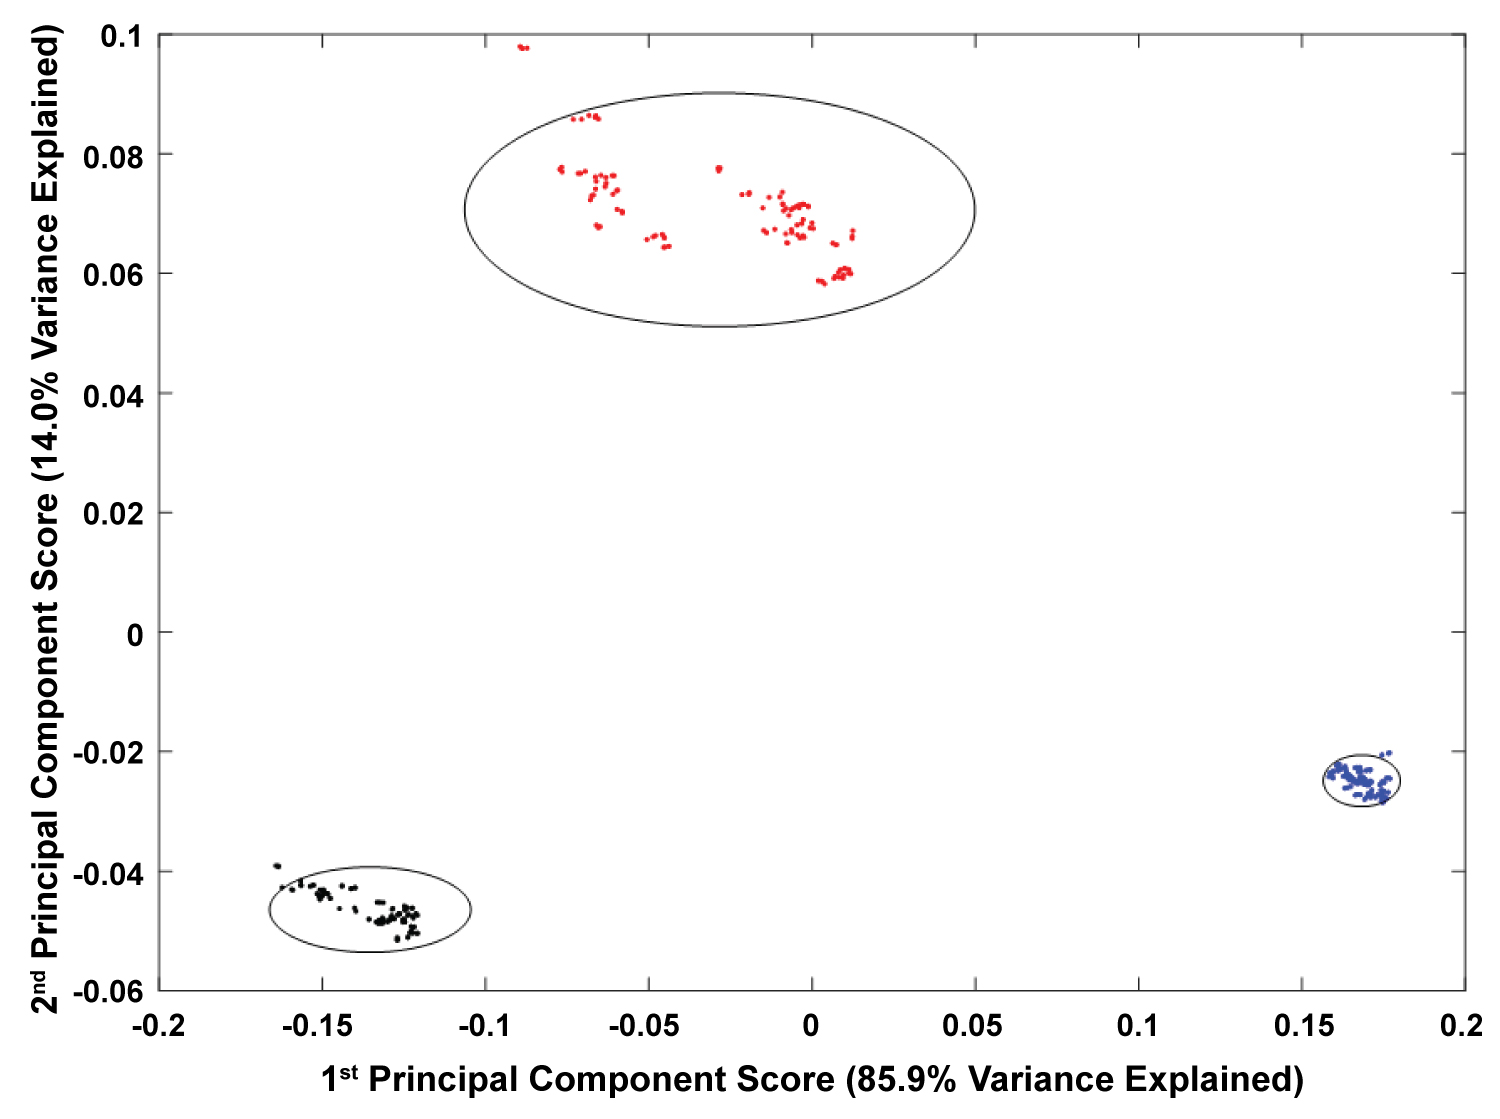
Figure 4: Principle component score plot...
Principle component score plot (PC1 vs. PC2) for mean-centered absorptivity coefficient spectra collected during Days 1-4 covering the 10-100 cm-1 THz spectral range for PTFE (blue), PE (red), and PS (black). Eclipses represent the 95% confidence area for the clusters associated with the indicated polymer.
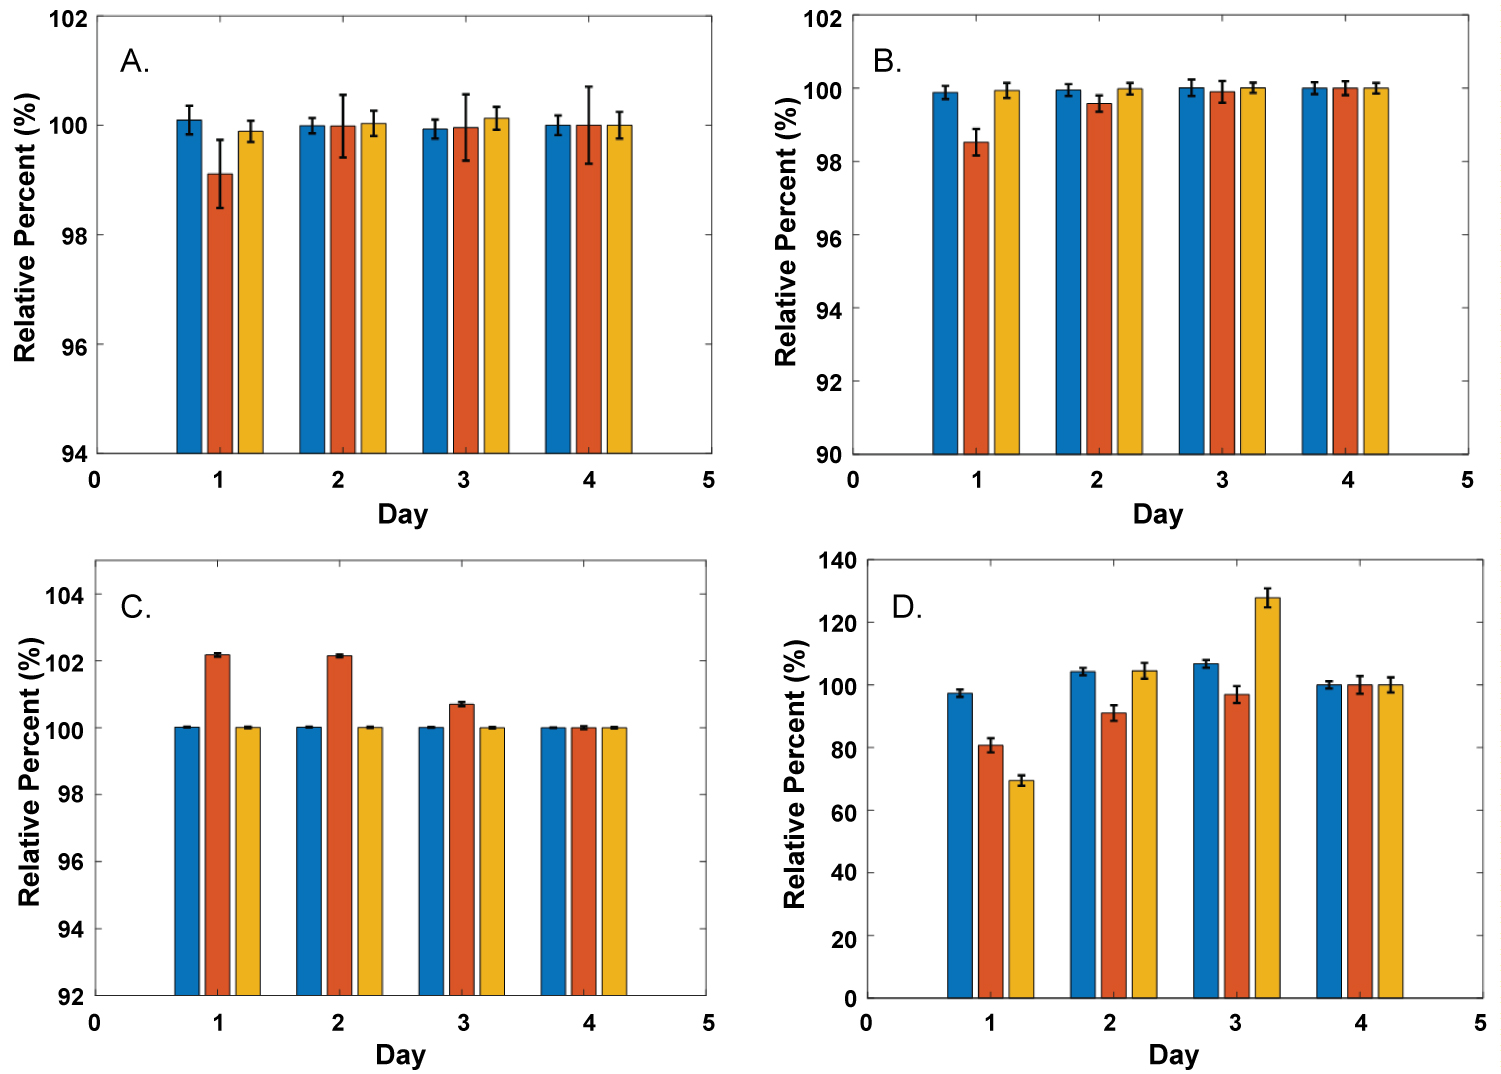
Figure 5: Relative percent of the final...
Relative percent of the final value (Day 4 value) for diameter (A), thickness (B), mass (C), and porosity (D) for each polymer: PTFE (blue), PE (red), and PS (yellow). Error bars represent propagated uncertainties for the given relative percent.
References
- Larkin PJ, Wasylyk J, Raglione M (2015) Application of low- and mid-frequency raman spectroscopy to characterize the amorphous-crystalline transformation of indomethacin. Appl Spectrosc 69: 1217-1228.
- SL Dexheimer (2008) Terahertz spectroscopy principles and applications. Boca Raton, FL: CRC Press.
- Smith RM, Arnold MA (2011) Terahertz time-domain spectroscopy of solid samples: Principles, applications, and challenges. Applied Spectroscopy Reviews 46: 636-679.
- Druzbicki K, Mikuli E, Palka N, Zalewski S, Ossowska-Chrusciel MD (2015) Polymorphism of resorcinol explored by complementary vibrational spectroscopy (ft-rs, thz-tds, ins) and first-principles solid-state computations (plane-wave dft). Journal of Physical Chemistry B 119: 1681-1695.
- Takahashi M (2014) Terahertz vibrations and hydrogen-bonded networks in crystals. Crystals 4: 74-103.
- Delaney SP, Korter TM (2015) Terahertz spectroscopy and computational investigation of the flufenamic acid/nicotinamide cocrystal. Journal of Physical Chemistry A 119: 3269-3276.
- Dash J, Ray S, Nallappan K, Kaware V, Basutkar N, et al. (2015) Terahertz spectroscopy and solid-state density functional theory calculations of cyanobenzaldehyde isomers. Journal of Physical Chemistry A 119: 7991-7999.
- Ruggiero MT, Bardon T, Strlic M, Taday PF, Korter TM (2014) Assignment of the terahertz spectra of crystalline copper sulfate and its hydrates via solid-state density functional theory. J Phys Chem A 118: 10101-10108.
- King MD, Korter TM (2011) Noncovalent interactions between modified cytosine and guanine DNA base pair mimics investigated by terahertz spectroscopy and solid-state density functional theory. J Phys Chem A 115: 14391-14396.
- Smith RM, Arnold MA (2015) Selectivity of terahertz gas-phase spectroscopy. Anal Chem 87: 10679-10683.
- Kasap SO (2002) Principles of electronic materials and devices. (2nd edn), NY: McGraw-Hill, New York.
- Namkung H, Kim J, Chung H, Arnold MA (2013) Impact of pellet thickness on quantitative terahertz spectroscopy of solid samples in a polyethylene matrix. Anal Chem 85: 3674-3681.
- Scheller M, Jansen C, Koch M (2009) Analyzing sub-100-mu m samples with transmission terahertz time domain spectroscopy. Optics Communications 282: 1304-1306.
- Sun JY, Lucyszyn S (2018) Extracting complex dielectric properties from reflection-transmission mode spectroscopy. IEEE Access 6: 8302-8321.
- Pastorelli G, Trafela T, Taday PF, Portieri A, Lowe D, et al. (2012) Characterisation of historic plastics using terahertz time-domain spectroscopy and pulsed imaging. Analytical and Bioanalytical Chemistry 403: 1405-1414.
- Jollife I (1986) Principal component analysis. New York: Springer-Verlag.
- Johansson B, Alderborn G (2001) The effect of shape and porosity on the compression behaviour and tablet forming ability of granular materials formed from microcrystalline cellulose. European Journal of Pharmaceutics and Biopharmaceutics 52: 347-357.
- Moynihan RE (1959) The molecular structure of perfluorocarbon polymers - infrared studies on polytetrafluoroethylene. J Am Chem Soc 81: 1045-1050.
- Lebedev YA, Korolev YM, Polikarpov VM, Ignat'eva LN, Antipov EM (2010) X-ray powder diffraction study of polytetrafluoroethylene. Crystallogr Rep 55: 609-614.
- Rae PJ, Dattelbaum DM (2004) The properties of poly (tetrafluoroethylene) (ptfe) in compression. Polymer 45: 7615-7625.
Author Details
Michaella E Raglione1, Tianyao Zhang1,2 and Mark A Arnold1*
1Department of Chemistry and Optical Science and Technology Center, University of Iowa, USA
2Department of Instrumentation Science, University of Science & Technology Beijing, China
Corresponding author
Mark A Arnold, Department of Chemistry and Optical Science and Technology Center, University of Iowa, Iowa City, 52242, USA.
Accepted: October 10, 2018 | Published Online: October 12, 2018
Citation: Raglione ME, Zhang T, Arnold MA (2018) Stability of Polytetrafluoroethylene, Polyethylene, and Polystyrene Pellets as a Matrix for Analytical Terahertz Spectroscopy. Int J Exp Spectroscopic Tech 3:018.
Copyright: © 2018 Raglione ME, et al. This is an open-access article distributed under the terms of the Creative Commons Attribution License, which permits unrestricted use, distribution, and reproduction in any medium, provided the original author and source are credited.
Abstract
Results are reported for a detailed examination of polytetrafluoroethylene (PTFE), polyethylene (PE) and polystyrene (PS) as polymeric matrixes for preparing sample pellets for analytical terahertz (THz) spectroscopy. Individual pellets were prepared from each material by compression at five tons of pressure under ambient temperatures. Mass, diameter, thickness, porosity and THz spectra were measured daily for each pellet over a period of four days. Pellets were stored in a desiccator under ambient temperatures between measurements. The thickness of each pellet was determined in a non-contact manner by analysis of each time-domain THz spectrum. No time-dependent differences were observed in the THz absorption coefficient spectra (10-100 cm-1) measured for any of these polymers, thereby demonstrating the chemical stability of each polymer. Time correlated changes in mass, diameter, thickness, and porosity were observed for PE, corresponding to mass losses associated with handling these brittle pellets and changes in pellet dimensions associated with relaxation processes. In contrast, PTFE and PS pellets were stable over the four-day period of the investigation. Porosities of 22.4 ± 0.4, 0.95 ± 0.02, and -2.05 ± 0.02% were determined for PE, PS and PTFE pellets, respectively. The negative porosity observed for the PTFE pellets corresponds to an increase in the density of the pressed pellets in comparison to the density of the PTFE powder used to form the pellet. This increase in density suggests an increase in the degree of crystallinity upon compression. Overall, caution is recommended when using PE for sample preparation owing to relaxation processes that require at least one day to complete. For the first time, PS is characterized as a possible pellet matrix and is found to be well suited for analytical THz spectroscopic measurements as it offers low absorptivities over THz frequencies while providing stable and durable pellets with porosities less than 1% and minimal physical distortions in response to compression.
Introduction
Terahertz (THz) spectroscopy offers a label-free and nondestructive analytical method for exploring and characterizing intra- and inter-molecular interactions within crystalline materials [1-3]. Sandwiched between the microwave and mid-infrared regions of the electromagnetic spectrum, THz spectroscopy is sensitive to crystalline lattice vibrations, or phonons, associated with hydrogen bonding, π-π, and van der Waals forces established between intra- and inter-molecular assemblies [2-6]. Absorption features associated with such long-range, low energy distortions are observed below 3 THz (100 cm-1) [2,7]. Density functional theory calculations performed by others describe these transitions as rotational, translational, and torsional lattice motions [8,9]. The molecular information embedded within THz spectra is complementary to that commonly attained from the more conventional Raman scattering and infrared absorption spectroscopies. THz spectra are sensitive to transitions related to the entire molecular assembly whereas Raman and infrared spectral features are derived from specific vibrational modes associated with bonding within defined functional groups [1]. The uniqueness of THz analytical information compared to infrared spectroscopy has been demonstrated for selectivity of quantitative gas-phase measurements [10].
Transmission THz spectroscopy of crystals is typically performed by suspending a representative sample of the crystals within an inert polymer matrix. Most commonly, either polyethylene (PE) or polytetrafluoroethylene (PTFE) serves as the inert matrix and pellets are formed by pressing a defined quantity of a mixture composed of the crystal sample and the selected polymer. Analytical measurements demand that the crystalline sample be uniformly dispersed within the pressed pellet and the dimensions of the pellet are both well-defined and stable. Changes in the physical dimensions of the sample pellets can impact its volume or porosity, thereby altering accuracy of the associated analytical measurements derived from the collected spectra [11,12].
This study examines the stability of polymer pellets used in transmission THz spectroscopy. As noted above, these pellets are formed by placing a known mass of the polymer-sample mixture into a die-press and applying a known pressure for a set period. When the pressure is released, and the pellet is removed from the die, the newly formed pellet is subject to relaxation processes that can result in changes in its physical dimensions or porosity. In this investigation, mass, diameter, and thickness are measured over time for pure pellets composed of PE, PTFE, and polystyrene (PS). From these measured values, stability of the volume and porosity is reported for each type of polymer pellet and the relative merits of each polymer are discussed as a matrix for analytical THz spectroscopy.
Experimental
Pellet preparation
Materials used to prepare pure polymer pellets were obtained as follows: PTFE (FLUO 625 CTX2, Micro Powders, INC., NY, USA), ultra-high molecular weight PE (Sigma, MO, USA) and PS (polystyrene atactic, Alfa Aeser, Tewksbury, MA, USA). The PTFE and PE materials were purchased as particles with a range of particle sizes provided by the supplier. The PTFE particles were within a range of 9 - 13 µm and those for PE were within a range of 40 - 48 µm. In contrast, the PS was purchased as beads (ca., 5 mm in diameter) that required manual grinding to achieve a course particle size on the order of 100 µm. Each preparation of polymer particles was dried in an oven at 60 ℃ for 24 hours to remove residual moisture and then stored in a desiccator until use.
Each pellet was prepared by weighing 400 to 450 mg of PTFE, 100 to 150 mg of PE, or 150 to 160 mg of PS into a Specac 13 mm diameter stainless steel die. The powders were leveled within the die by gently rotating the die bolt on top of the powder, without compressing it, before setting the filled die into the Specac hydraulic press (model number 15011, Kent, England). Pellets were compressed by applying a 5-ton load (0.34 GPa) for 5 minutes. Triplicate pellets were prepared for each polymer.
Dust-free nitrile gloves were used at all times when handling pellets to minimize contamination from skin oil and debris.
THz spectra
THz transmission spectra were collected for the purposes of determining pellet thickness and observing spectral features for each pellet over time. THz time-domain spectra were collected with a Teraview TPS 1000D terahertz spectrometer (TeraView Limited, Cambridge, UK). A schematic diagram of the time-domain spectrometer is provided in Figure 1. Here a Ti:Sapphire laser is used to generate a femtosecond pulse, which is then split into separate pump and probe beams. Mirrors are used to direct the probe beam to a delay line, which functions much like an interferometer. The pump beam is incident on a GaAs semiconductor emitter. A coherent THz pulse is generated by acceleration of electrons within the semiconductor. This THz pulse is then directed through the sample and onto the detector. Co-incident pump and probe beams onto the GaAs detector produces an electric signal that is recorded as a function of time or position of the delay line. More detail of the operation of this instrumentation can be found elsewhere [2]. Pellets were mounted in a rotating sample holder designed to rotate the pellet at a rate of one completed rotation each minute. As shown schematically in Figure 2, the axis of rotation was perpendicular to the optical axis with the center of the incident beam nominally positioned at the center of the pellet. Each spectrum was collected as 1800 co-added scans attained over one minute. Purging the sample compartment with dried air avoided the presence of confounding water vapor lines in the collected spectra.
Time-domain spectra were processed in the following manner to achieve frequency-domain absorption spectra. Each time-domain spectrum was truncated just before the first etalon and the truncated time-domain spectrum data was zero-filled to 8192 (213) points. A boxcar apodization function was applied prior to the fast Fourier transform to yield the corresponding frequency-domain electric field spectrum. Absorbance spectra were then calculated as twice the negative base ten logarithm of the ratio of the sample to air electric field spectra. The resolution of the resulting spectra was 1.2 cm-1 over a spectral range of 10 - 100 cm-1.
Each day, nine THz time-domain spectra were collected from each pellet in the following manner. For a given pellet, the pellet was positioned in the rotating sample holder and three spectra were collected consecutively without handling the pellet. The pellet was then removed from the sample compartment, a fresh air spectrum was collected and then one of the three pellets was selected arbitrarily for the next measurement of consecutive triplet spectra. Overall, triplicate consecutive spectra were collected three times for each of three pellets resulting in a total of 27 THz spectra collected each day for each polymer (3 pellets × 3 arbitrary repeats × 3 consecutive spectra).
Pellet characterization
The mass, diameter, and THz time-domain spectra were obtained for each pellet on each of four consecutive days. Mass and diameter measurements were performed with an analytical balance (AE 163, Mettler, Columbus, OH, USA) and a set of calipers (CD-4 CSX, Mitutoyo, Aurora, IL, USA), respectively.
Pellet thickness was obtained in a non-contact manner by extraction from the corresponding THz time-domain spectrum using an algorithm reported by Scheller and co-workers [13]. Scheller's algorithm takes advantage of Fabry-Perot echo features, or etalons, within the time-domain spectrum caused by internal reflections of the THz wave within the sample. Location of the etalon along the time axis depends on the frequency dependent refractive index and extinction coefficient of the sample, as well as its thickness. Scheller derived an expression that permits optimization of both refractive index and extinction coefficient for a set thickness of the sample. These thickness-dependent values were optimized at each frequency by minimizing differences between the calculated and actual THz signals. The optimized refractive index values were plotted as a function of frequency. Ideally, the perfect combination of sample thickness and frequency-dependent refractive index results in a trace void of Fabry-Perot oscillations. In practice, the Scheller optimization process for refractive index and extinction coefficient at each frequency is repeated for a series of sample thicknesses and the thickness that gives a minimum in the magnitude of the Fabry-Perot oscillations is taken as the best estimate of the sample thickness.
The initial data (mass, diameter, and THz time-domain spectrum) were determined within three hours after releasing pellets from the die. The results for these initial measurements and the corresponding calculated values (thickness, volume and porosity) were designated as Day 1. Each measurement was repeated in the same manner for three subsequent consecutive days, corresponding to Days 2 - 4. Between days, pellets were stored dry in a desiccator at ambient temperatures.
Comparisons between days were judged on the basis of relative percentage of the values obtained for Day 4 (final values). Statistical differences were characterized by Student's t-tests performed at the 95% confidence level.
Spectral analysis and thickness calculations were performed in Matlab R2017b.
Results and Discussion
The results presented below summarize our findings for a series of stability studies for pellets composed of the three examined polymers: PTFE, PE, and PS. Of these, PTFE and PE are commonly used in THz spectral analyses owing to favorable transparency over the THz spectral range. PS, on the other hand, has not been reported as a polymer matrix for THz sample pellets, which makes this the first evaluation of PS for this purpose.
Polymer spectral properties
Ideally, the polymer used to form sample pellets for transmission THz spectroscopy is available in high purity and is compressible into robust pellets under moderate pressures. In addition, the ideal polymer must be transparent over the THz frequency range of interest. THz absorption spectra are presented in Figure 3 for PTFE, PE and PS. To aid comparisons, these spectra are presented in absorptivity coefficient (α) units in order to normalize absorption values by the thickness of each pellet at a given frequency (). Accordingly, absorptivity coefficients are given by Equation 1:
Where and correspond to the magnitude of the frequency dependent electric field vector of the detected THz radiation for the sample and reference measurements, respectively, and d represents the thickness of each pellet in units of cm [14]. THz time-domain spectroscopy is distinguished from other optical spectroscopic methods in that the amplitude of the electric field vector can be measured directly by gated detection methods [2]. The factor of two denoted in Equation 1 fulfills the need to square the electric field amplitudes in order to realize intensity values, as is commonly used in optical spectroscopy.
As illustrated in Figure 3, absorptivity coefficients are less than 4% throughout the 10-100 cm-1 THz spectral range for all three polymers. PTFE possesses the lowest values throughout this spectral range with a maximum of only 0.4%. Nevertheless, a few absorption features are evident. As reported by others, and confirmed here, the spectrum of PTFE includes a single broad feature centered at 51 cm-1, PE possesses two distinct absorbance bands centered at 72 and 76 cm-1, and PS displays a broad absorption feature centered at 65 cm-1 [15]. Small Fabry-Perot oscillations are evident in these frequency-domain spectra owing to incomplete removal of etalon features by truncation of the corresponding time-domain spectra. Interesting, the absorptivity coefficient drops slight below zero for PTFE between 80-100 cm-1. This observation corresponds to a slight mismatch between the reference and sample spectra owing to the single-beam measurement. In addition, the radiant powers of the incident radiation drop sharply over this spectral range where the incident intensity is sharply falling in magnitude, as noted before [2].
Stability was characterized for these spectra by performing a principal component analysis (PCA) on the full set of THz absorptivity coefficient spectra collect throughout this four-day study. PCA characterizes the degree of spectral variance within the input data set [16]. Given the differences in the shapes of the pure component spectra for each polymer, the major source of spectral variance is the absorption spectra of the polymers themselves. A score plot displays the degree of variation across all spectra, as shown in Figure 4. In this plot, each spectrum is projected onto the first two principle component axes (PC1 and PC2) and the magnitude of this projection is plotted as a score along the appropriate axis. The resulting score plot, as shown in Figure 4, displays patterns associated with the fraction of spectral variance captured by each principal component.
The score plot in Figure 4 clearly illustrates how each polymer occupies a different region within the two-dimensional space defined by PC1 and PC2. Combined, PC1 and PC2 describe 99.9% of the total spectral variance associated with this spectral database. An eclipse encircles the 95% confidence area based on the distribution of points within the individual spectral clusters representing a different polymer. This analysis shows that 96.2, 97.2, and 96.3% of the polymer-specific spectra fall within the 95% confidence areas for PTFE, PE, and PS, respectively.
A correlation between spectral variance as a function of time would imply a spectral instability with respect ageing of the polymer pellets. To investigate this possibility, the degree of correlation was determined between the Euclidian distance of the points in Figure 4 versus pellet age. The resulting coefficients of determination (R2) for each individual polymer cluster were determined to be 0.007, 0.02, and 0.07 for PTFE, PE, and PS, respectively. These small R2 values indicate no meaningful correlation exists between spectral variance and pellet age. These findings confirm the chemical stability of these polymers.
Pellet dimensions
Diameter and thickness of the pellets were examined to evaluate the impact of relaxation processes upon removal of freshly pressed pellets from the confines of the die-press. Table 1 presents the final values measured for both diameter and thickness for each of the three pellets examined for each polymer. Figure 5 illustrates changes in diameter, thickness, volume and porosity in comparison to the values measured on Day 4. Relative percent errors are presented to facilitate comparisons across time and polymers.
Final measured diameters are presented in Table 1 for each pellet. The average diameters across these pellets are 12.93 ± 0.02, 13.12 ± 0.07, and 13.00 ± 0.02 mm for PTFE, PE, and PS, respectively. Interestingly, diameters for PTFE pellets were slightly less than the diameter of the die in which the pellets were created, those for PE pellets are slightly larger than the die diameter, and those for PS are essentially the same as the die diameter. These findings demonstrate a 0.56% contraction of the PTFE polymer during pellet formation as well as, a 0.89% expansion of the pellet diameter for PE.
The relative percent change in diameter presented in Figure 5A reveals minimal changes for PE or PTFE, but a significant increase in diameter is observed for PE between Days 1 and 2. Student's t-values corroborate that there is a significant change in diameter between Days 1 and 2 for PE. Relative standard deviations (RSD's) enable a comparison of the relative uncertainties in these diameter measurements. The average RSD values for the final Day 4 measurements are 0.13, 0.50, 0.17% for PTFE, PE, and PS, respectively. This ranking of RSDPE > RSDPTFE ≈ RSDPS is consistent with the magnitude of the error bars in Figure 5A, indicating larger relative uncertainties in the diameter measurements for PE, relative to both PTFE and PS. In general, diameter measurements were challenging, because the pellets of all three polymers tended to bend under the pressure applied by the caliper faces during these measurements.
PE pellets were noticeably more fragile, and brittle compared to the others. As a result, chipping was unavoidable while handling the PE pellets over the four-day study. In addition, a white residue was observed on both the calipers and gloves after each PE measurement. Both the PS and PTFE proved to be more durable with little damage from handling, however the PTFE was a bit more pliable compared to PS pellets, which made the PTFE pellets slightly more difficult to handle during diameter measurements.
The non-contact measurement of pellet thickness, described above, provided an excellent method for determining changes over time, while avoiding possible damage to pellets with the calipers. As reported in Table 1, the final pellet thicknesses ranged from 1 to 1.7 mm depending on the type and mass of polymer used to form the pellet. Changes in the thickness of each type of polymer are highlighted in Figure 5B. Consistent with our findings for diameter, pellets of PTFE and PS showed no significant change in thickness over the four days, while PE pellets displayed a significant increase in thickness between Days 1 and 2. The small differences shown in Figure 5B between Days 2 and 3 for PE were deemed not statistically different at the 95% confidence level on the basis of the Student's t-test. The changes in pellet thickness observed between Days 1 and 2 for PE will impact calculations based on the Beer-Lambert relationship if a constant optical path is assumed.
Pellet mass
Masses of the individual PTFE and PS pellets were constant over the four-day study, as shown in Figure 5C. As mentioned above, PTFE and PS pellets were resistant to losses associated with handling; whereas, PE pellets were susceptible to chipping, flaking and abrasions during handling, thereby resulting in mass losses over the course of the experiment, as illustrated in Figure 5C. Accordingly, Student's t-tests showed no statistical differences in mass for PTFE or PS over the four days, while masses for the PE pellets displayed statistically significant differences. Average masses of the three PE pellets was 0.103 ± 0.003 grams on Day 1 and 0.101 ± 0.002 grams on Day 4, corresponding to a 2% decrease.
Pellet porosity
Porosity is defined as the volume fraction of the pellet occupied by air [17]. The percent porosity can be determined by comparing the density of the pellet with the nominal density of the pure polymer. In the simplest case with no trapped air within the pellet, the porosity is zero and the density of the pellet matches that of the pure polymer. Entrapped air within the pellet structure will lower the density of the pellet relative to that of the pure polymer. In practice, the volume occupied by the entrapped air will add to the volume occupied by the polymer. For a pellet composed of only polymer and air, the relative volumes of polymer and air sum to one and Equation 2 gives the porosity for the pellet:
where is the relative volume of air in the pellet, Vpolymer is the volume of the polymer, and Vpellet is the measured volume of the pellet. In the present study, Vpellet was calculated from the diameter and thickness values measured for each disk-shaped pellet on each day and Vpolymer was calculated by dividing the mass of each pellet on a given day by the appropriate density for PTFE, PE, and PS. The densities used in these calculations were those reported on the corresponding MSDS sheet supplied by the supplier. Specific density values used in these calculations were 2.21, 0.94, and 1.05 g/cm3 for PTFE, PE, and PS, respectively. In each case, an uncertainty of ± 0.01 was assumed for each density based on the number of significant-figures provided for the reported values.
The final day pellet volumes and corresponding porosities are summarized in Table 1 for the three polymers. The PE pellets possess the largest porosities followed by PS and then PTFE. For PE, porosities range from 21.0 to 24.6% on the final day of this study. For PS, the final day average was only 0.9542 ± 0.0002%, indicating little difference between the volume of the pellet and the volume of the polymer and a porosity less than 1%.
The most interesting case is PTFE where the observed porosities are negative. A negative porosity means the volume of the pellet is less than that expected for the mass of PTFE and its density of 2.21 g/cm3, making the ratio in Equation 1 greater than 1. This finding suggests an increase in the density of the PTFE matrix upon compression, thereby resulting in a smaller volume of the pellet for a given mass of PTFE. The density of amorphous PTFE is 2.19 g/cm3 whereas crystalline forms of PTFE have higher densities, closer to 2.23 g/cm3 [18]. The purchased PTFE particles represent a mixture of both crystalline and amorphous states with a density of 2.21 g/cm3. Apparently, compression into a pellet increases the crystalline component, thereby increasing its density. Others have reported a density of 2.30 g/cm3 for 100% crystalline PTFE thin films [18]. Four PTFE crystalline phases are known, and all possess higher densities compared to the less densely packed amorphous state [19,20].
Assuming PTFE pellets are void of air, pellet density can be determined from the mass and volume measurements. Accordingly, the average PTFE density for pellets characterized on Days 1-4 are 2.254 ± 0.003, 2.226 ± 0.001, 2.258 ± 0.002, and 2.255 ± 0.002 g/cm3, respectively. Statistical analysis indicates no significant differences across these four days and the overall average density for the pooled observations is 2.256 ± 0.003 g/cm3. This pooled result is consistent with other reports of densities for mixtures of amorphous and crystalline PTFE preparations.
Stability of the measured porosity values is presented in Figure 5D for these three polymers. Systematic increases in porosity were observed only for the PE pellets. Relative porosities averaged only 81.7 ± 2% of the final value on Day 1 and then increased to 91 ± 3 and 97 ± 3% on Days 2 and 3, respectively. Although variations in porosity were also observed for PTFE and PS, these variations do not trend with time and, therefore, are not considered representative of pellet instability. Instead, the observed variations in porosity of PTFE and PS pellets are reflective of the relative uncertainties in the diameter and thickness measurements in comparison to the small values of porosity for these two polymers (-2% for PTFE and 1% for PS).
Relative merits
Although PE is a commonly used polymeric matrix for preparing pellet-samples for THz spectroscopic measurements, changes in the dimensions of PE pellets are largest for the examined polymers. Changes in the mass, diameter, thickness, and porosity were observed between the first and second days following compression into pellets, as shown in Figure 5. Changes in mass were associated with the brittleness of the PE pellets, which resulted in loss of material caused by chipping, flaking and abrasions during handling. Over the four-day period of this study, a 2% change in mass was documented. Changes in thickness of PE pellets are particularly noteworthy. As indicated in Equation 1, absorptivity coefficient, a parameter often used to reflect the dielectric properties of a material, will change over time owing to changes in the thickness of the PE pellets. Changes in volume (diameter and thickness) were also observed between Days 1 and 2 for the PE pellets. In addition, slight differences were noted between Days 2 and 3, but these differences were deemed insignificant on a statistical basis. The change in volume stems from slow relaxation processes following compression.
In comparison to PE, no significant differences in mass, diameter, or thickness were observed for either the PTFE or PS pellets, relative to the first time-point (three hours following pellet formation). Pellet relaxation processes occurring prior to this initial time-point were not trackable. For all three materials, no time-dependent differences were observed in the path length normalized absorption spectra, as determined from an analysis of the PCA score plot presented in Figure 4. This finding attests to the known chemical stability of these polymeric materials.
Likewise, time-dependent increases in porosity were observed for PE pellets while no such time-dependent variations were observed for either PTFE or PS. The average porosity determined across the three pellets on Day 4 are 22.4 ± 0.4, 0.95 ± 0.02, and -2.05 ± 0.02% for PE, PS and PTFE pellets, respectively. The relative standard deviation for these values is 1.8, 1.6, and 0.8%, respectively, indicating similar degrees of relative precision in these measurements. As discussed above, the negative percent porosity for PTFE is consistent with an increase in the percent crystallinity of the polymer matrix upon compression.
Conclusions
Each of the tested polymers is known to be chemically stable and robust, thereby providing pellets with stable THz spectra over the examined four-day period. For PTFE and PS, pellet dimensions and porosities were also stable over this period, indicating pellet relaxation processes were completed within three hours after pellet formation. These findings reveal sample pellets composed of PTFE or PS can be used three hours after fabrication. It is interesting to point out a major difference in the measured diameters for pellets prepared with PTFE and PS. For PS, the final pellet diameter was 13.00 ± 0.03 mm, which matches that of the die used to fabricate the pellets. In comparison, the measured final diameter for PTFE was 12.93 ± 0.02, slightly smaller than the diameter of the die. The smaller diameter for the PTFE pellets indicates a contraction, which can be attributed to an increase in the crystallinity of the PTFE matrix upon compression. The stability in the dimensions of the PTFE pellets demonstrates this contraction process is completed rapidly.
Pellets composed of PE, on the other hand, demonstrated changes in mass, diameter, and thickness over the course of this study. Changes on the order of 2% were recorded for each parameter, which may or may not be meaningful depending on the question. For most analytical questions with PE based sample pellets, it is advisable to minimize handling and to permit at least one day, preferably two days, for the completion of relaxation processes before preforming measurements.
PTFE and PE are common polymer matrixes used in the preparation of sample pellets for THz transmission spectroscopy. As documented here, PTFE possesses greater stability after pellet formation and lower porosity.
Our evaluation is the first to consider the suitability of PS as a polymer matrix for THz analytical spectroscopy. Overall, PS is determined to be well suited for this purpose. Pellets composed of PS are stable and durable over time with porosities less than 1% and minimal physical distortions in response to compression.
Acknowledgements
This work was supported by funds associated with the Edwin B. Green Chair Professorship in Laser Chemistry as administered by the College of Liberal Arts and Sciences at the University of Iowa. Maosong Ye's assistance with the principle component analysis of the THz spectra is greatly appreciated.