International Journal of Experimental Spectroscopic Techniques
(ISSN: 2631-505X)
Volume 3, Issue 2
Research Article
DOI: 10.35840/2631-505X/8522

Article Formats
Feasibility of Multidimensional Fluorescence at Low Temperature in Shpol'skii Matrices Combined with PARAFAC for the Quantitation of Polycyclic Aromatic Hydrocarbons
Table of Content
Figures
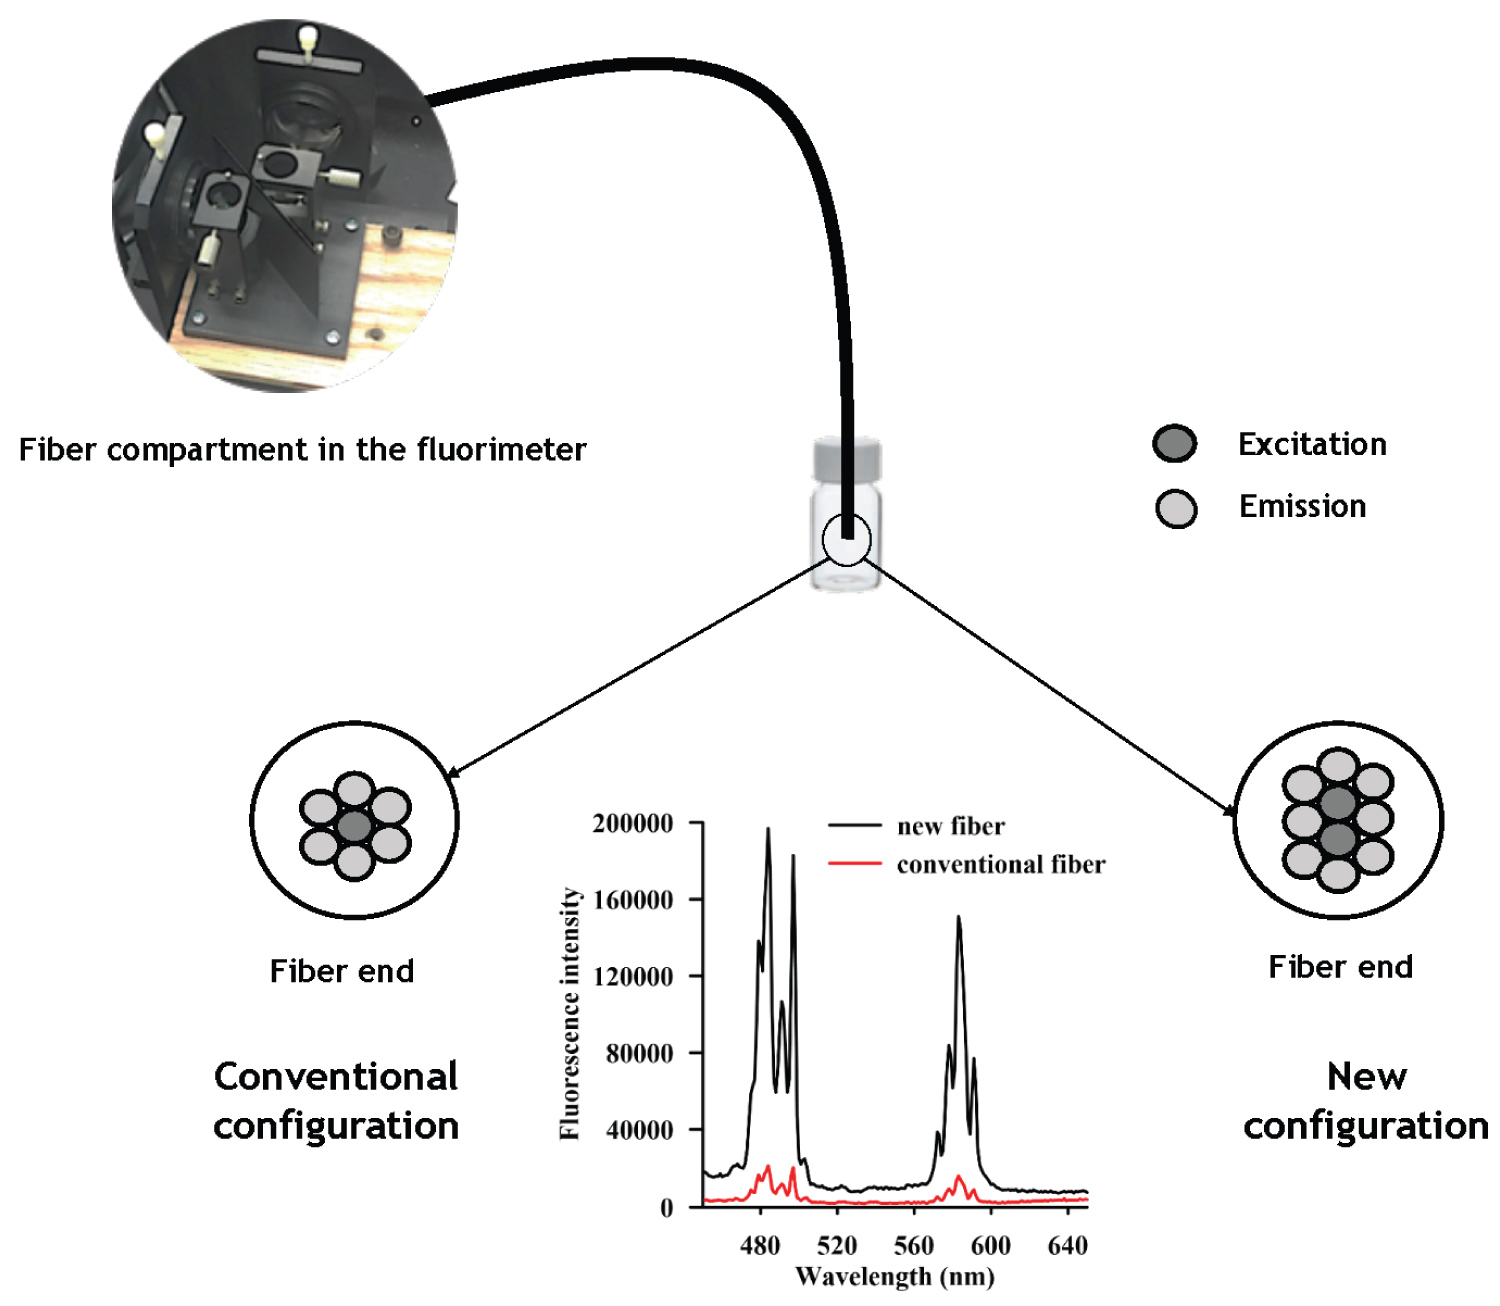
Figure 1: Scheme of the fiber configurations...
Scheme of the fiber configurations and the emission spectra of a reference standard obtained with the new fiber (8 emissions and 2 excitations) and the conventional fiber (6 emissions and 1 excitation).
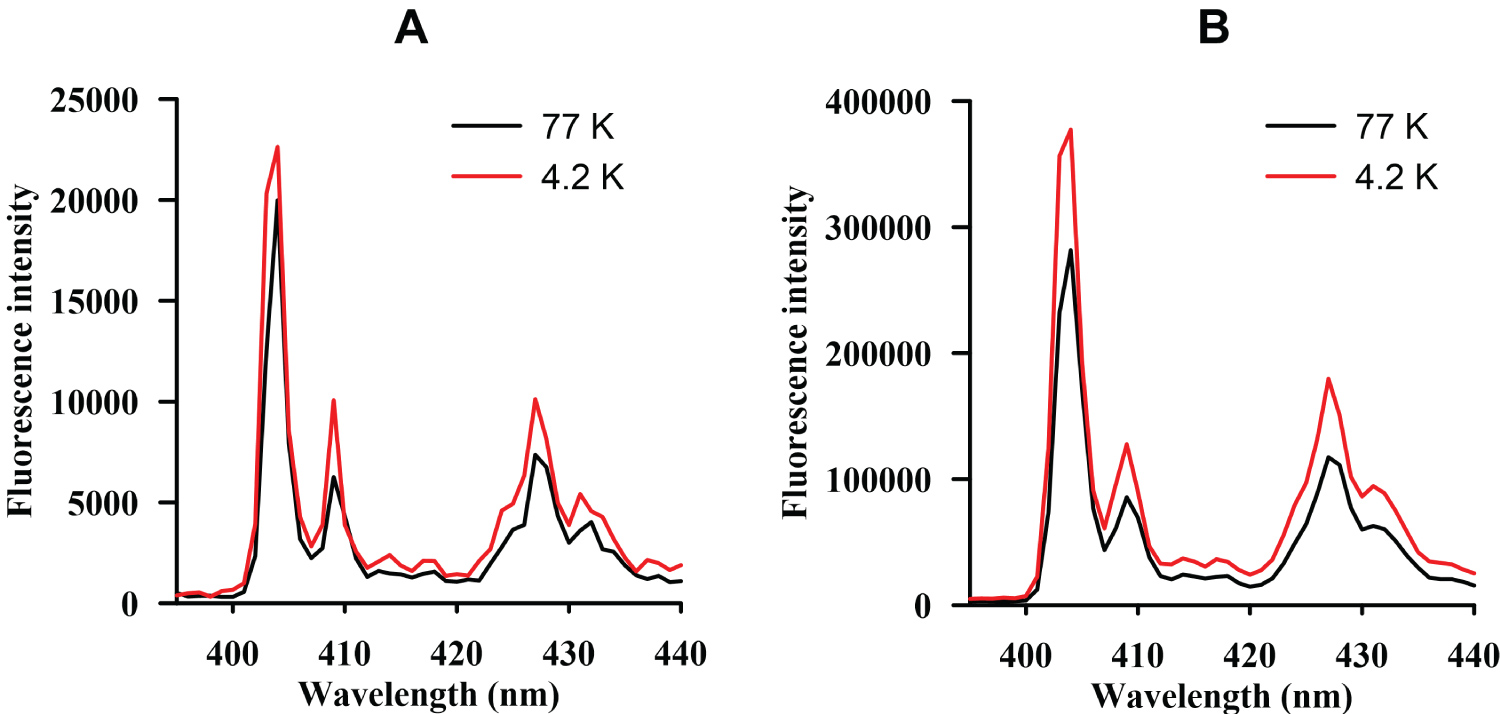
Figure 2: Emission spectra of benzo...
Emission spectra of benzo[a]pyrene (λ exc. = 298 nm) obtained for different band passes, 1 nm (A) and 2 nm (B).

Figure 3: Excitation-emission matrix...
Excitation-emission matrix of each PAH (B[b]F, 50 ng·mL-1 B[a]P, 5 ng·mL-1, B[a]A, 100 ng·mL-1, Chry, 100 ng·mL-1) obtained at 77 K.
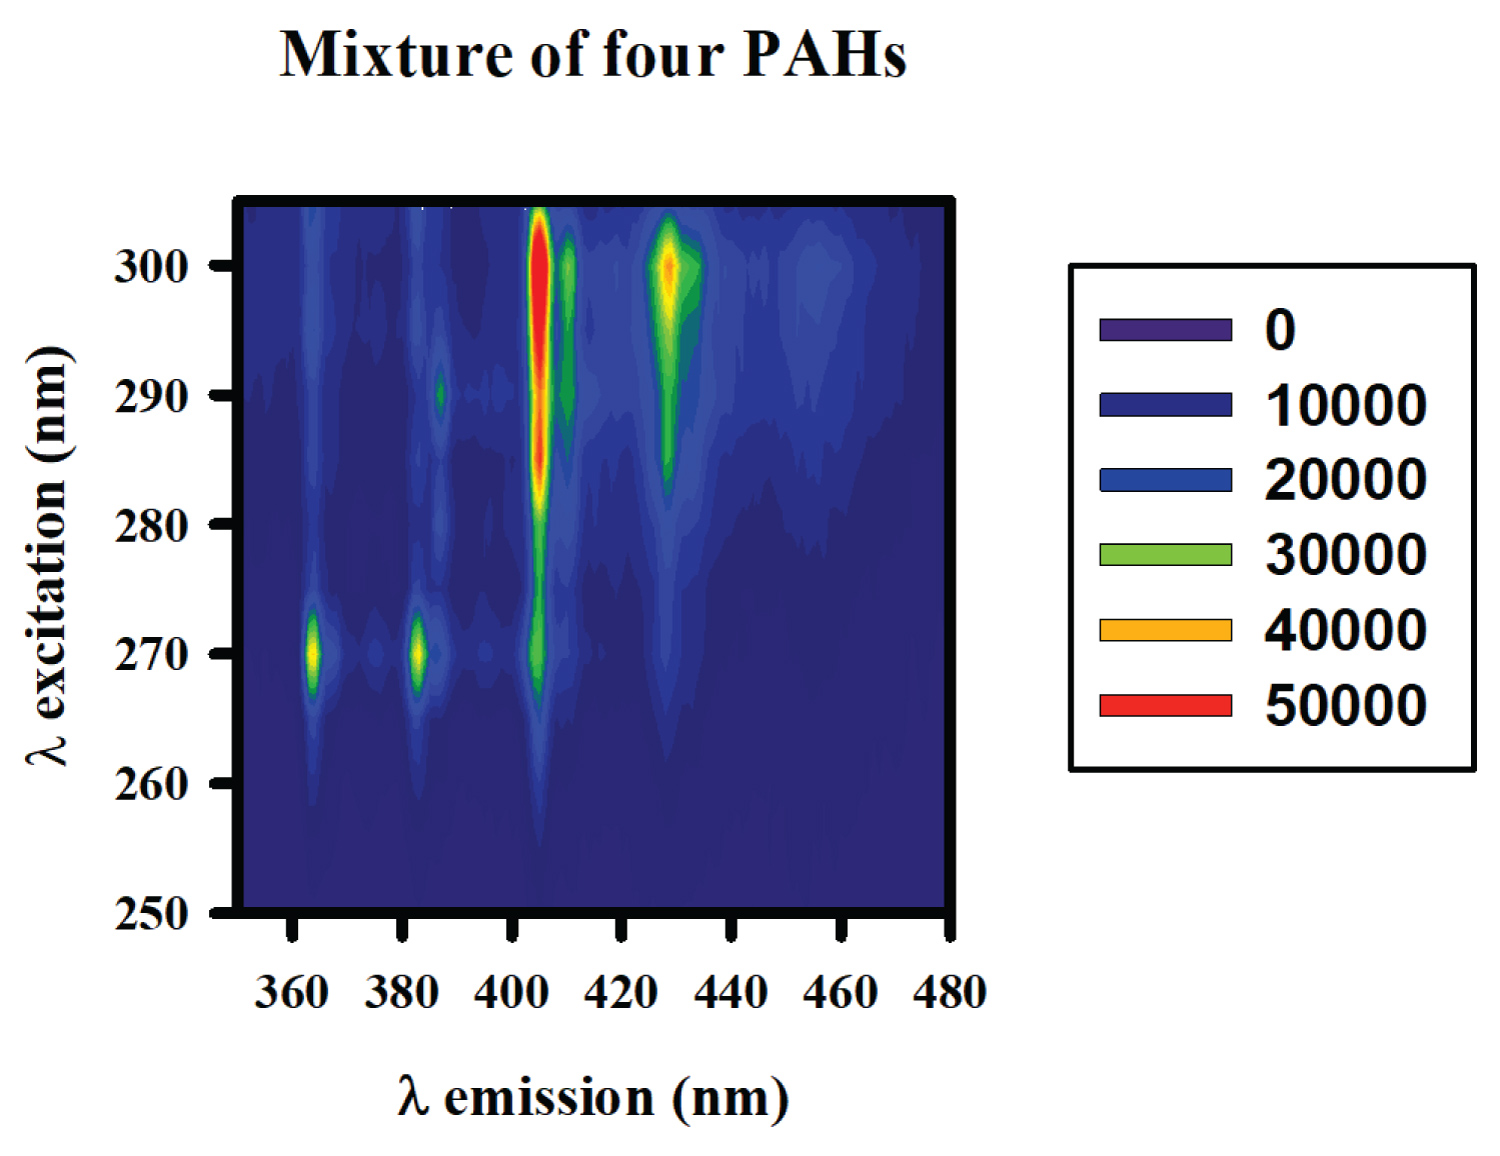
Figure 4: Excitation-emission matrix of...
Excitation-emission matrix of a mixture of PAHs (B[b]F, 40 ng·mL-1, B[a]P, 5 ng·mL-1, B[a]A, 15 ng·mL-1, Chry, 35 ng·mL-1) obtained at 77 K.
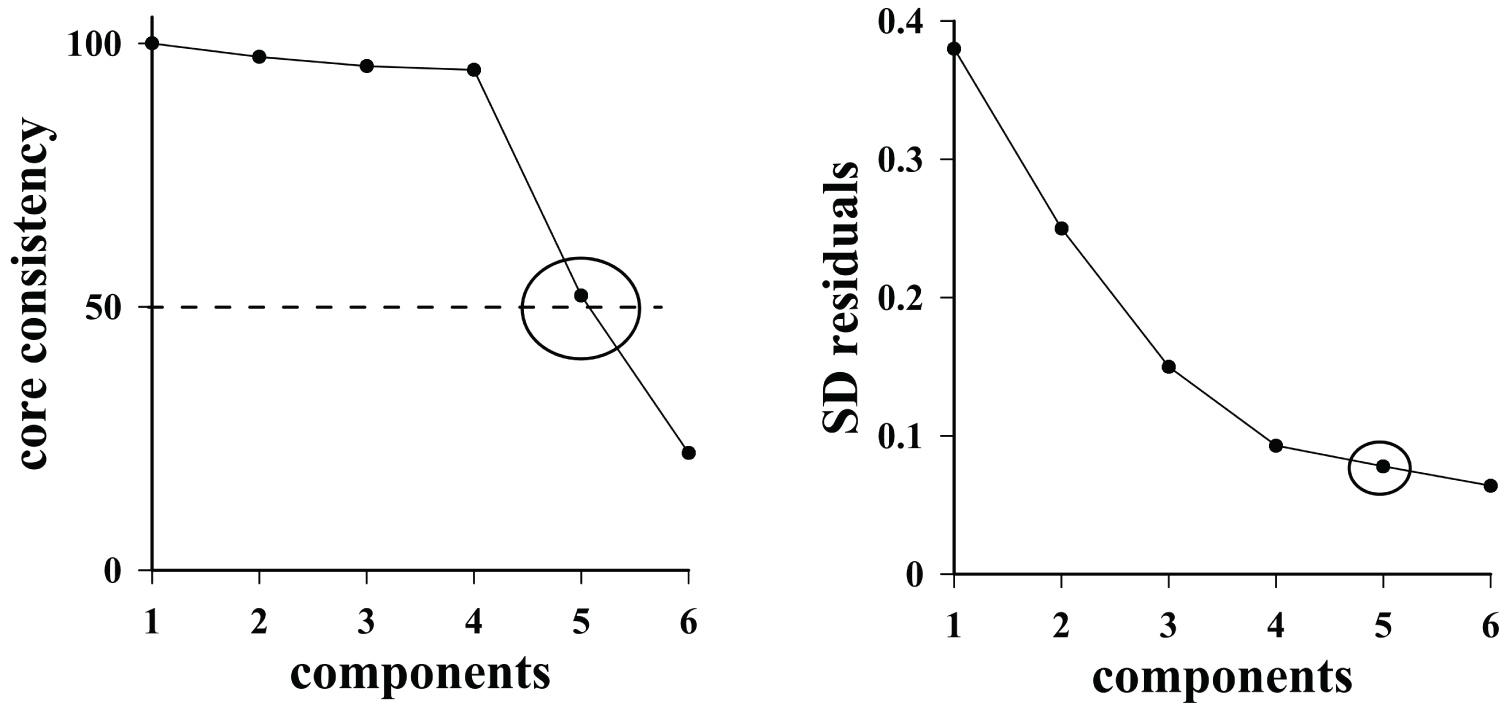
Figure 5: Plots of core consistency value...
Plots of core consistency value (left) and standard deviation of residuals (right) versus optimum number of components.
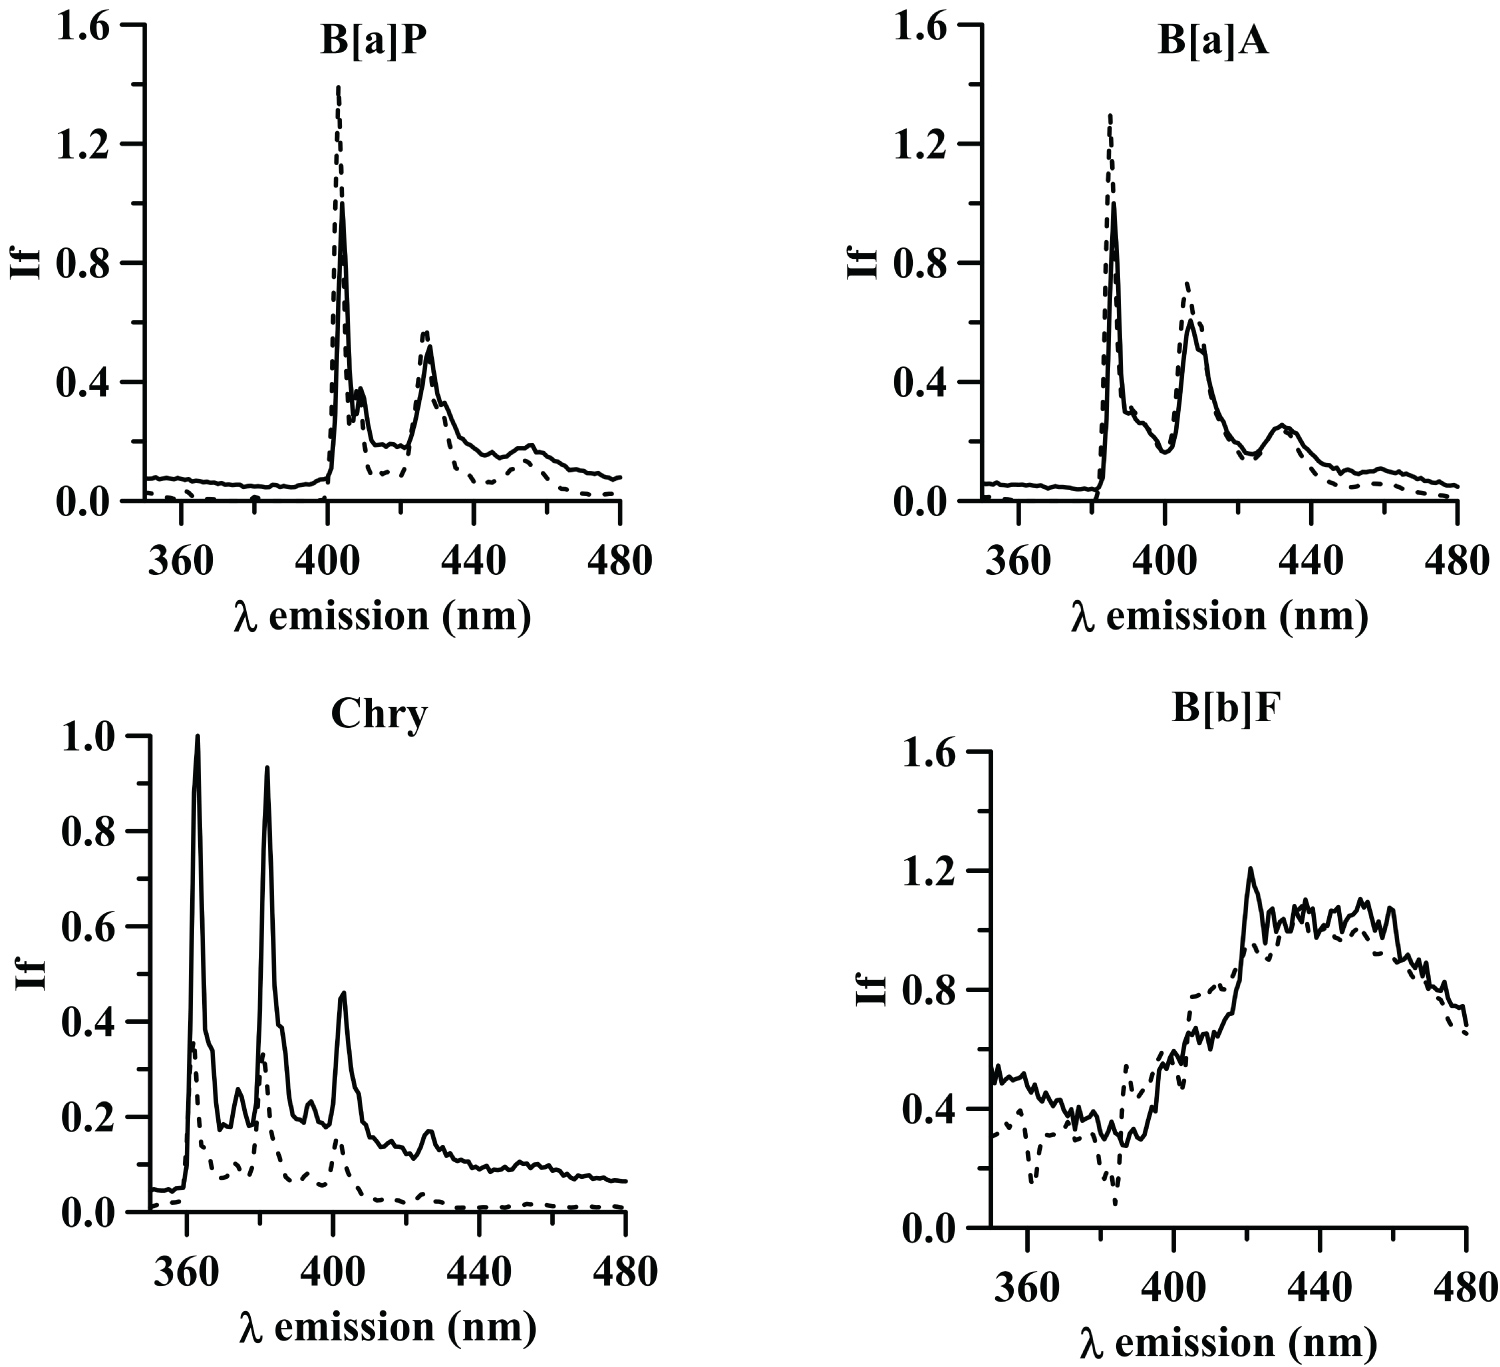
Figure 6: Emission loadings for the 4 components...
Emission loadings for the 4 components obtained by PARAFAC (dash line) and pure emission spectra of B[a]P, B[a]A, Chry and B[b]F (dotted line).
Tables
Table 1: a) Concentration of each PAHs in the mixtures employed for calibration and validation.
b) Concentration of each PAHs in the mixtures employed for calibration and validation (continuation).
Table 2: Results obtained for the validation set employing a five-component model.
References
- HI Abdel-Shafy, MSM Mansour (2016) A review on polycyclic aromatic hydrocarbons: Source, environmental impact, effect on human health and remediation. Egyptian Journal of Petroleum 25: 107-123.
- European Commission (2006) Commission Regulation (EC) No 1881/2006. Off J Eur Union L364 5-24.
- European Commission (2011) Commission regulation (EU) No 835/2011 of 19 August 2011 amending Regulation (EC) No 1881/2006 as regards maximum levels for polycyclic aromatic hydrocarbons in foodstuffs. Off J Eur Union 215: 4-8.
- European Comission (2015) Comission regulation (EU) No 2015/1933 of 27 October 2015, amending regulation (EC) No 1881/2006 as regards maximum levels for polycyclic aromatic hydrocarbons in cocoa fibre, banana chips, food supplements, dried herbs and dried spices. Off J Eur Union L282: 11-13.
- A Paris, J Ledauphin, P Poinot, JL Gaillard (2018) Polycyclic aromatic hydrocarbons in fruits and vegetables: Origin, analysis, and occurrence. Environ Pollut 234: 96-106.
- S Škaljac, M Jokanović, V Tomović, M Ivić, T Tasić, et al. (2018) Influence of smoking in traditional and industrial conditions on colour and content of polycyclic aromatic hydrocarbons in dry fermented sausage "Petrovská klobása". LWT - Food Science and Technologies 87: 158-162.
- AE Thea, D Ferreira, LA Brumovsky, ME Schmalko (2016) Polycyclic aromatic hydrocarbons (PAHs) in yerba maté (Ilex paraguariensis St. Hil) traditional infusions (mate and tereré). Food Control 60: 215-220.
- S Alves da Silva, G Rodrigues Sampaio, EA Ferraz da Silva Torres (2017) Optimization and validation of a method using UHPLC-fluorescence for the analysis of polycyclic aromatic hydrocarbons in cold-pressed vegetable oils. Food Chem 221: 809-814.
- D Patra, AK Mishra (2001) Excitation emission matrix spectral subtraction fluorescence to check adulteration of petrol by kerosene. Applied Spectroscopy 55: 338-342.
- R Ferrer, JL Beltran, J Guiteras (1998) Multivariate calibration applied to synchronous fluorescence spectrometry. Simultaneous determination of polycyclic aromatic hydrocarbons in water samples. Talanta 45: 1073-1080.
- R Ferrer, J Guiteras, JL Beltra (1998) Quantitative multicomponent analysis of polycyclic aromatic hydrocarbons in water samples. Analytica Chimica Acta 361: 233-240.
- F Alarcón, ME Baez, M Bravo, P Richter, GM Escandar, et al. (2013) Feasibility of the determination of polycyclic aromatic hydrocarbons in edible oils via unfolded partial least-squares/residual bilinearization and parallel factor analysis of fluorescence excitation emission matrices. Talanta 103: 361-370.
- SA Bortolato, JA Arancibia, GM Escandar (2008) Chemometrics-assisted excitation-emission fluorescence spectroscopy on nylon membranes. Simultaneous determination of benzo[a]pyrene and dibenz[a,h]anthracene at parts-per-trillion levels in the presence of the remaining EPA PAH priority pollutants as int. Anal Chem 80: 8276-8286.
- R Ferrer, J Guiteras, JL Beltra (1998) Multivariate calibration of polycyclic aromatic hydrocarbon mixtures from excitation - emission fluorescence spectra. Analytica Chimica Acta 373: 311-319.
- EP Lai, EL Inman, JD Winefordner (1982) Conventional fluorescence spectrometry of polynuclear aromatic hydrocarbons in Shpol'skii matrices at 77 K. Talanta 29: 601-608.
- WB Wilson, AA Costa, H Wang, AD Campiglia, JA Dias, et al. (2013) Pre-concentration of water samples with BEA zeolite for the direct determination of polycyclic aromatic hydrocarbons with laser-excited time-resolved Shpol'skii spectroscopy. Microchemical Journal 110: 246-255.
- AC Olivieri, HL Wu, RQ Yu (2009) MVC2: A MATLAB graphical interface toolbox for second-order multivariate calibration. Chemometrics and Intelligent Laboratory Systems 96: 246-251.
- Ca Andersson, R Bro (2000) The N -way Toolbox for MATLAB. Chemom Intell Labor 52: 1-4.
- AC Olivieri, GM Escandar (2000) Practical three-way calibration. Elsevier.
- R Bro, HAL Kiers (2003) A new efficient method for determining the number of components in PARAFAC models. J Chemom 17: 274-286.
- M Al-Tameemi, S Arif, AD Campiglia, WB Wilson, SA Wise (2019) Photoluminescence spectroscopy of anthrathiophenes and benzonaphthothiophenes in Shpol'skii matrixes. Talanta 194: 930-940.
- A Muñoz de la Peña, A Espinosa Mansilla, D González Gómez, AC Olivieri, HC Goicoechea (2003) Interference-free analysis using three-way fluorescence data and the parallel factor model. Determination of fluoroquinolone antibiotics in human serum. Anal Chem 75: 2640-2646.
- F Allegrini, AC Olivieri (2014) IUPAC-consistent approach to the limit of detection in partial least-squares calibration. Anal Chem 86: 7858-7866.
- AC Olivieri (2014) Analytical figures of merit: From univariate to multiway calibration. Chem Rev 114: 5358-5378.
- LA Currie (1995) Nomenclature in evaluation of analytical methods, including detection and quantification capabiIities (IUPAC Recommendations 1995). Pure Appl Chem 67: 1699-1723.
- N Ferretto, M Tedetti, C Guigue, S Mounier, R Redon, et al. (2014) Identification and quantification of known polycyclic aromatic hydrocarbons and pesticides in complex mixtures using fluorescence excitation-emission matrices and parallel factor analysis. Chemosphere 107: 344-353.
- S Elcoroaristizabal, A de Juan, JA García, N Durana, L Alonso (2014) Comparison of second-order multivariate methods for screening and determination of PAHs by total fluorescence spectroscopy. Chemometrics and Intelligent Laboratory Systems 132: 63-74.
Author Details
Olga Monago-Maraña1,2, Arsenio Muñoz de la Peña1,2*, Maha Al-Tameemi3, Teresa Galeano-Díaz1,2 and Andrés D Campiglia4
1Department of Analytical Chemistry, University of Extremadura, Badajoz, Spain
2Research Institute on Water, Climate Change and Sustainability (IACYS), Badajoz, Spain
3Department of Chemistry, College Science for Women, University of Baghdad, Baghdad, Iraq
4Department of Chemistry, University of Central Florida, Orlando, Florida, United Stated of America
Corresponding author
Arsenio Muñoz de la Peña, Department of Analytical Chemistry, University of Extremadura; Research Institute on Water, Climate Change and Sustainability (IACYS), Badajoz, 06006, Spain.
Accepted: December 29, 2019 | Published Online: December 31, 2019
Citation: Monago-Maraña O, de la Peña AM, Al-Tameemi M, Galeano-Díaz T, Campiglia AD (2018) Feasibility of Multidimensional Fluorescence at Low Temperature in Shpol'skii Matrices Combined with PARAFAC for the Quantitation of Polycyclic Aromatic Hydrocarbons. Int J Exp Spectroscopic Tech 3:022.
Copyright: © 2018 Monago-Maraña O, et al. This is an open-access article distributed under the terms of the Creative Commons Attribution License, which permits unrestricted use, distribution, and reproduction in any medium, provided the original author and source are credited.
Abstract
The feasibility of determination of four polycyclic aromatic hydrocarbons (PAHs), using multidimensional fluorescence at low temperature in Shpol'skii matrices, was addressed in this work. Excitation - Emission Matrices (EEMs) at low temperature (77 K) were obtained, using an optimized optic fiber consisted of two delivery and eight collection fibers, with an eight-around-two configuration. That configuration improved the sensitivity by six times compared with conventional six-rounded-one configuration. The second-order EEMs data were collected registering the emission spectra from 350 to 480 nm, each 1 nm, varying the excitation wavelength from 250 to 310 nm, each 5 nm, and processed with parallel factor analysis (PARAFAC) for the quantitation of traces of benzo[a]pyrene, benzo[b]fluoranthene, benzo[a]anthracene and chrysene. The results were validated obtaining recoveries ranging from 80 to 120%. The approach takes advantage of the sharp spectra with vibrational information resulting from homogeneous and inhomogeneous band-broadening reduction and could be useful for the analysis of these compounds in different food samples, where maximum levels of them are stablished in several regulations.
Keywords
Polyciclic aromatic hydrocarbons, Excitation-emission fluorescence, Low temperature, Shpol'skii matrices, PARAFAC
Introduction
Polycyclic aromatic hydrocarbons (PAHs) are considered important environmental pollutants originating from a wide variety of natural and anthropogenic sources. In fact, PAHs can be formed both during biological processes and as products of incomplete combustion from either natural combustion sources (forest and brush fires) or man-made combustion sources (automobile emissions and cigarette smoke) [1].
The disturbing dangerousness of these compounds has led to the European commission to stablish some limits of the concentration of these compounds. The European Regulation 1881/2006 [2] stablished maximum levels of chrysene, benzo[a]pyrene, benzo[b]fluoranthene and benzo[a]anthracene in some specific foods. This regulation has been modified lately by the European Regulation 835/2011 [3] and the last modification was in 2015 by the regulation 2015/1933 [4]. These limits are stablished according to the maximum concentration of these four compounds. And, if this concentration is lower than the limit, besides, the concentration of benzo[a]pyrene must be lower than another limit stablished. For example, in the case of spices, the concentration of the four PAHs must not be higher than 50 µg kg-1. In addition, even when this concentration is lower than the limit, the benzo[a]pyrene concentration must be lower than 10 µg kg-1.
Generally, these compounds have been analyzed in food matrices by means of separative techniques. Specifically, gas chromatography [5,6] or liquid chromatography [7,8] have been the chosen techniques. Excitation - Emission matrix (EEM) fluorescence, which is also known as total fluorescence spectroscopy is a rapid and inexpensive technique used for the analysis of polycyclic aromatic hydrocarbons (PAHs) in the environment [9]. Hence, synchronous fluorescence combined with first order calibration has been employed to quantify these analytes in water [10,11]. Multidimensional spectrofluorimetry, by registering Excitation-Emission Matrices (EEMs), have allowed quantifying PAHs in vegetable oils, combining this technique with parallel factor analysis (PARAFAC) and unfolded partial least-squares/residual bilinearization (U-PLS/RBL) [12], or, in water, combining EEMs with PARAFAC and U-PLS/RBL [13,14]. Besides, relevant studies about polycyclic aromatic hydrocarbons in Shpol'skii matrices at 77 K are found in the literature [15]. However, studies based on multidimensional fluorescence at low temperature in Shpol'skii matrices, combined with multivariate calibration algorithms, have not been found in the literature to analyze these four PAHs together in food matrices.
Fluorescence, and in general photoluminescence, has a multidimensional nature which gives rise to a good choice for the direct analysis of them with an unique potential. On the other hand, the decrease of temperature often improves the characteristics of fluorescence signals, not only their magnitude but also their shape. This last advantage is particularly pronounced in the so-called high-resolution techniques, namely, Shpol'skii spectroscopy (SS) and fluorescence line narrowing spectroscopy. In these techniques, the reduction of the brand-broadening results from reduction of vibrational information [16].
In the case of Shpol'skii technique a dilute solution of a guest molecule frozen to 77 K or below in a solvent host is generally utilized as matrix, given that: (1) The solvent freezes to an ordered polycrystalline matrix, not a random glass; (2) The guest-host interactions are weak; and (3) The guest and host molecular dimensions enable that the guest molecules occupy a small number of crystallographic sites in the host lattice.
The objective of this work is focus on exploring the feasibility of determination of polycyclic aromatic hydrocarbons (PAHs), combining low temperature fluorescence and the second-order PARAFAC algorithm. In addition, to improve the sensitivity, a new fiber optic configuration has been used.
Experimental
Reagents and chemicals
The solvent employed (n-octane) (HPLC grade) and the stocks of PAHs (benzo[a]pyrene (B[a]P), benzo[b]fluoranthene (B[b]F), benzo[a]anthracene (B[a]A) and chrysene (Chry)) were purchased from Sigma - Aldrich at their highest available purity (> 98%).
Instrumentation and software
Steady-state excitation and fluorescence spectra were recorded with a commercial spectrofluorimeter (Photon Technology International). The excitation source was a continuous wavelength 75 W Xenon lamp allowing excitation from 200 to 2000 nm. The reciprocal linear dispersion of the excitation and the emission monochromator was 4 nm mm-1 and their wavelength accuracy was 61 nm within 0.25 nm resolution. The two gratings (1200 grooves/nm) were blazed at 300 nm (excitation) and 400 nm (emission). A photomultiplier tube with wavelength response range between 185 and 650 nm was used as detector. Commercial software (Felix32), specifically designed for the system, was used for the computer control of the instrument.
The Unscramble Software v6. 11 (CAMO A/S Olav Tryggvason Sgt, N-7011, Trondheim, Norway) was used for the experimental design.
The analysis of second-order data was performed using Matlab R2014a (MATLAB Version 8.3, The Marhworks, Natick, Massachusetts, 2014) and the MVC2 software, developed by Olivieri, Wu and Yu [17], and available at www.iquir-conicet.gov.ar/descargas/mvc2.rar. MVC2 software needs the N-way toolbox, written by Bro and Anderson. [18] and available at http://www.models.life.ku.dk, and, since the original publication in 2009, the interface has undergone a complete renovation [19].
Building of a new fiber optic probe for excitation-emission matrices measurements
The cryogenic Fiber Optic Probes (FOPs) were coupled to the sample compartment of the spectrofluorimeter with the aid of a commercial fiber optic mount (F-3000, Horiba Jobin-Yvon) that optimized collection efficiency via two concave mirrors. The alignment of each end of the FOP was performed by commercially available adapters (Horiba Jobin-Yvon) employing focusing mirrors. All fibers were 2 m long and 500 µm core diameter, silica-clad with polyamide buffer coating (Polymicro Technologies, Inc.). The fibers fed into a 1.2 m long section of copper tubing that provided mechanical support for lowering the probe into the liquid cryogen. At the sample end, the fibers were arranged either in a six-around one configuration or an eight-around two configurations with the excitation fiber in the center. At the instrument end, the emission fibers were positioned in a slit configuration. At both ends, vacuum epoxy was used to hold the fibers in place, which were then fed into metal sleeves for mechanical support and polished with a diamond rotating disk. At the sample end, the copper tubing was flared stopping a phenolic screw cap threaded for a 0.75 mL propylene sample vial.
Solution measurements were made as follows: for each sample, a 200 µL aliquot was pipetted into a sample vial. The samples vial was secured to the sample end of the copper tubing, and the tip of the FOP was positioned at a constant depth below the solution surface. Sample freezing was accomplished by lowering the sample vial into a 3 L liquid nitrogen Dewar to make the 77 K measurements and into a helium bottle to make the 4.2 K measurements.
The clean-up procedure involved removing the sample vial from the cryogen container, melting the frozen matrix and warming the resulting solution to approximately room temperature with a heat gun, rising the probe with n-alkane, and drying it with warm air from the heat gun. The entire freeze, thaw, and clean up cycle took less than 5 min.
The emission spectra were collected from 350 to 480 nm, each 1 nm, varying the excitation wavelength from 250 to 310 nm, each 5 nm. The excitation and emission monochromators slits were set at 2 and 2 nm, respectively.
Calibration and validation sets for PARAFAC analysis
The 21-standard calibration set employed in the PARAFAC model consisted on a mixture of the four PAHs. Their corresponding EEMs were collected by means of fluorescence. The analyte concentrations were corresponded with an experimental Central Composite Design and they were between 0.75 and 23.7 µg L-1 for B[a]P, between 15 - 60 µg L-1 for B[b]F, between 15 - 150 µg L-1 for B[a]A and between 25 - 245 µg L-1 for Chry. In addition, the blank (n-octane) was also registered and included in the calibration set. These concentrations are shown in the Table 1.
For the validation set, six additional standards were randomly prepared with different concentrations from those employed in the calibration, but in the same range of concentration (Table 1). Excitation - emission matrices were collected as indicated above.
The Parallel Factor Analysis (PARAFAC) algorithm was applied to obtain the calibration model. In all cases, non-negative constraint for the resolved profiles in all modes were applied. Taking into account that spectral values are positive, this restriction allowed to obtain realistic solutions.
The method of choice in the case of three-way trilinear data has been PARAFAC. The three modes of data are obtained from measurements of fluorescence, at J emission wavelengths and K excitation wavelengths for each I samples, with the data collected into a three-way data cube XIxJxK.
PARAFAC decomposes the array into a more condensed form than the original one. This decomposition is based on sets of scores and loadings [20]. The input array is decomposed by minimizing the sum of squares of the residuals, eijk, in the model
Where xijk is the fluorescence intensity for sample i, at the emission wavelength j and excitation wavelength k, whereas the element eijk, of the array E accounts for the variability not computed by the model. For a given component f, the elements aif which are directly proportional to the component f concentration in each sample are arranged in the score vector af and the elements bjf and ckf are in the loading vectors bf and cf, which estimate their emission and excitation profiles.
Results and Discussion
Building of a new fiber
Usually, the conventional six-rounded-one configuration with the delivery fiber in the center is employed to build the fiber optic. However, in this study, a new fiber was built in order to increase the sensitivity, which was probed with a reference standard, according to a previous optimized configuration [21].
Hence, the new fiber optic consisted of two delivery (excitation) and eight (emission) collection fibers with an eight-around-two configuration improving the signal six times. The emission spectra of a reference standard obtained with both conventional and the new fiber, as well as a scheme of the two configurations of the fiber, are shown in the Figure 1.
Optimization of the instrumental parameters
Different variables were assayed, in order to choose the best instrumental conditions, for the registering of the excitation - emission spectra and obtaining the highest signal. Hence, a standard solution of each analyte was prepared, and their emission spectra were obtained employing different band passes (1 and 2 nm), for excitation and emission, and different low temperatures (77 K and 4.2 K). An example for B[a]P can be seen in the Figure 2. As appreciated, the signal was higher in the case of the 2 nm band pass and, because of that, the band pass selected was 2 nm for excitation and emission.
Respect to the low temperature employed, it was observed that the signal did not increased notably in the case that 4.2 K was employed. Hence, taking into account that the nitrogen is less expensive and of easier use than helium, the working temperature chosen was 77 K. Results were similar for the four PAHs studied.
PARAFAC multivariate analysis
Firstly, the excitation - emission matrix (EEM) of each compound was registered, as indicated in the section 2.4, and they are shown in the Figure 3. As appreciated, selective bands appear for each one of the studied PAHs. As expected, these bands are narrowed than the room temperature bands. In the Figure 4, it is appreciated an EEM of a mixture of the four analytes studied where it can be observed the overlapping of the different signals for each analyte.
In order to perform the multivariate analysis of EEMs, the first step was the selection of the number of optimum components. For this selection, two different criteria are usually performed: core consistency diagnostics (CORCONDIA) [20] and the analysis of residuals [22]. The first one is based on observing the change in the core consistency parameter when the number of components increases. The optimal value of component is selected as the largest tested for which the core consistency is larger than ≈ 50%. Sometimes, this criterion may fail in certain circumstances, as being based on structural assumptions. Hence, an alternative criterion, based on the residual error, has been proposed [22]. This approach is more intuitively appealing than the rather complex core consistency and has already shown to be a good indicator of having reached the correct value of components. The value of the residual error should decrease with increasing number of PARAFAC components, until it stabilizes at a certain value, which is considered optimum [19,22].
Both criteria offered similar results and the optimal number of components were five in all cases (Figure 5). The corresponding loadings to the different components are shown in the Figure 6 and are clearly related with the spectra of the PAHs analyzed. This means that PARAFAC is a good choice for the determination of a mixture of these compounds. The multivariate calibration models were obtained from the relation between the score values of each component and the corresponding concentration values.
Hence, the validation samples were predicted, and the results are shown in Table 2. Most recoveries are comprised between 80 and 120%, which test the good accuracy of the model. It can be noticed that worst results are obtained for B[b]F, due to the fact that this analyte presents a very low fluorescence signal. The other three analytes (B[a]P, B[a]A and Chry) present better results of predictions, as observed in Table 2.
In Table 2, the values of limits of detection (LODs) and limits of quantification (LOQs) were also included, according to the modern definitions, based on IUPAC's recommendations [23,24]. LOD is defined as the minimum concentration that can be reliably detected by the method, taking into account both false positive (also called false detects, Type I or α) and false negatives (also called false nondetects, Type II or β) errors [25]. If we consider 95% confidence levels against Type I and II errors, i.e., α = 0.05 and β = 0.05, the LOD is given by LOD = 3.3 Ϭ0, where Ϭ0 is the standard deviation in concentration and the factor 3.3 is given by (2 × t0.05, ∞) one tail t value assuming a large number of calibration samples. The LOQ is the minimum analyte concentration which can be estimated with a relative error lower than 10%. Thus, the corresponding expression is LOQ = 10 Ϭ0 = 3.33 LOD. These expressions are employed by MVC2 software interface to report LOD and LOQ when analyzing a given sample by PARAFAC. Taking into account these results, it can be said that the method allows the quantification of the PAHs concentrations as there is a linear relationship between the fluorescence information extracted by combination with PARAFAC (as scores obtained for the different analytes) and the concentration of each analyte.
In this study, the innovation is based in the use of a new fiber optic configuration for the determination of 4 PAHs with an important risk in the human health. The novelty of this study is related with the combination of low temperature fluorescence with this new fiber and multivariate analysis. This work has allowed obtaining similar results to other studies but with a fiber optic, whose sensibility is, generally, lower. This study offers new challenges to employ this method in the analysis of food and other environmental samples.
Previous studies have reported about the determination of some analytes in a similar way to that utilized in this study but employing room temperature fluorescence, obtaining similar limits of detection [26] and relative errors of predictions [27] or even worse relative errors of predictions [12].
Other advantage of this method is the possibility of employing low volumes, which is quite important in the case of diluted samples, which required pre-concentrating treatments.
Conclusions
Preliminary studies allowed the quantitation of four PAHs, combining low temperature fluorescence with second-order multivariate calibration, showing the feasibility of the procedure as an interesting alternative for the application to different food samples. The fluorescence band narrowing effect at 77 K in Shpol'skii matrices, combined with PARAFAC analysis, has allowed the resolution of the PAHs mixture. The procedure could be useful to analyse samples where the volume of samples is low, due to the possibility of employing the new optimized fiber optic, with limits of detection compared to those obtained in a conventional fluorimeter employing a quartz cell.
Acknowledgements
Financial support was provided by the Junta de Extremadura (Ayuda GR18041-Research Group-FQM003 and Project IB16058) and Ministerio de Ciencia, Innovación y Universidades of Spain (Project CTQ2017-82496-P), both co-financed by the Fondo Social Europeo funds. Olga Monago Maraña is grateful to the Ministerio de Educación, Cultura y Deporte of Spain for a FPU grant (Resolución de 18 de noviembre de 2013, de la Secretaría de Estado de Educación, Formación Profesional y Universidades, BOE nº 279, de 21/11/13, reference number FPU13/00249) and a stay research FPU grant (Resolución de 20 de julio de 2015, BOE nº 186, de 21/11/13, reference number EST15/00173).