Analysis of Workflow in Chemotherapy Clinical Practice

International Journal of Healthcare Systems Engineering
(ISSN: 2633-8939)
Volume 3, Issue 1
Original Article
DOI: 10.35840/2633-8939/7208

Article Formats
Analysis of Workflow in Chemotherapy Clinical Practice
Table of Content
Figures

Figure 1: A representation of regimens, cycles, and treatment days.....
A representation of regimens, cycles, and treatment days.

Figure 2: (Color online) Flowchart of operations at MCCC. S: Stream of patients.....
(Color online) Flowchart of operations at MCCC. S: Stream of patients.
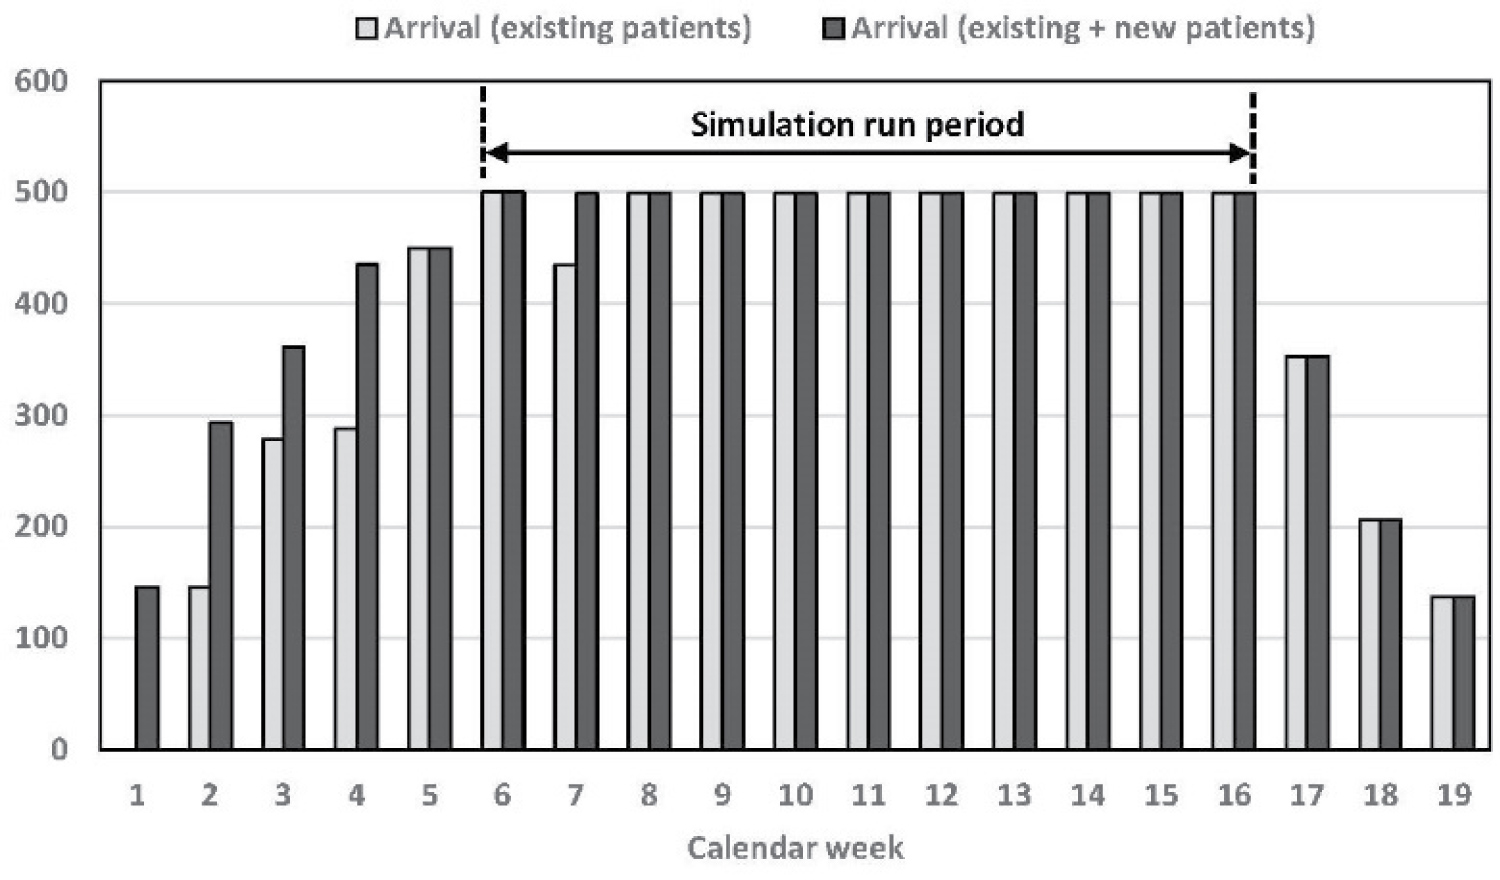
Figure 3: Simulation period based on a steady-state scheduling of patients' arrival.....
Simulation period based on a steady-state scheduling of patients' arrival.

Figure 4: Results under the baseline scenario....
Results under the baseline scenario.
Note: See Table 5 for description of numbers 1-7 under item (a).

Figure 5: Number of completions for infusions and treatments.....
Number of completions for infusions and treatments.
Note: Patient capacity: 500; each treatment may consist of ≥ 1 infusions; Numbers 2-9 refer to other resource scenarios to be discussed later in section 7.1.

Figure 6: Results on length of stay under other scenarios....
Results on length of stay under other scenarios.
Note: Results for set 1 are already reported in Figure 4a; see Table 5 and Table 6 for description of numbers 1-7 and sets 2-9, respectively; see Table EC.1 in the Online Appendix for the full results.
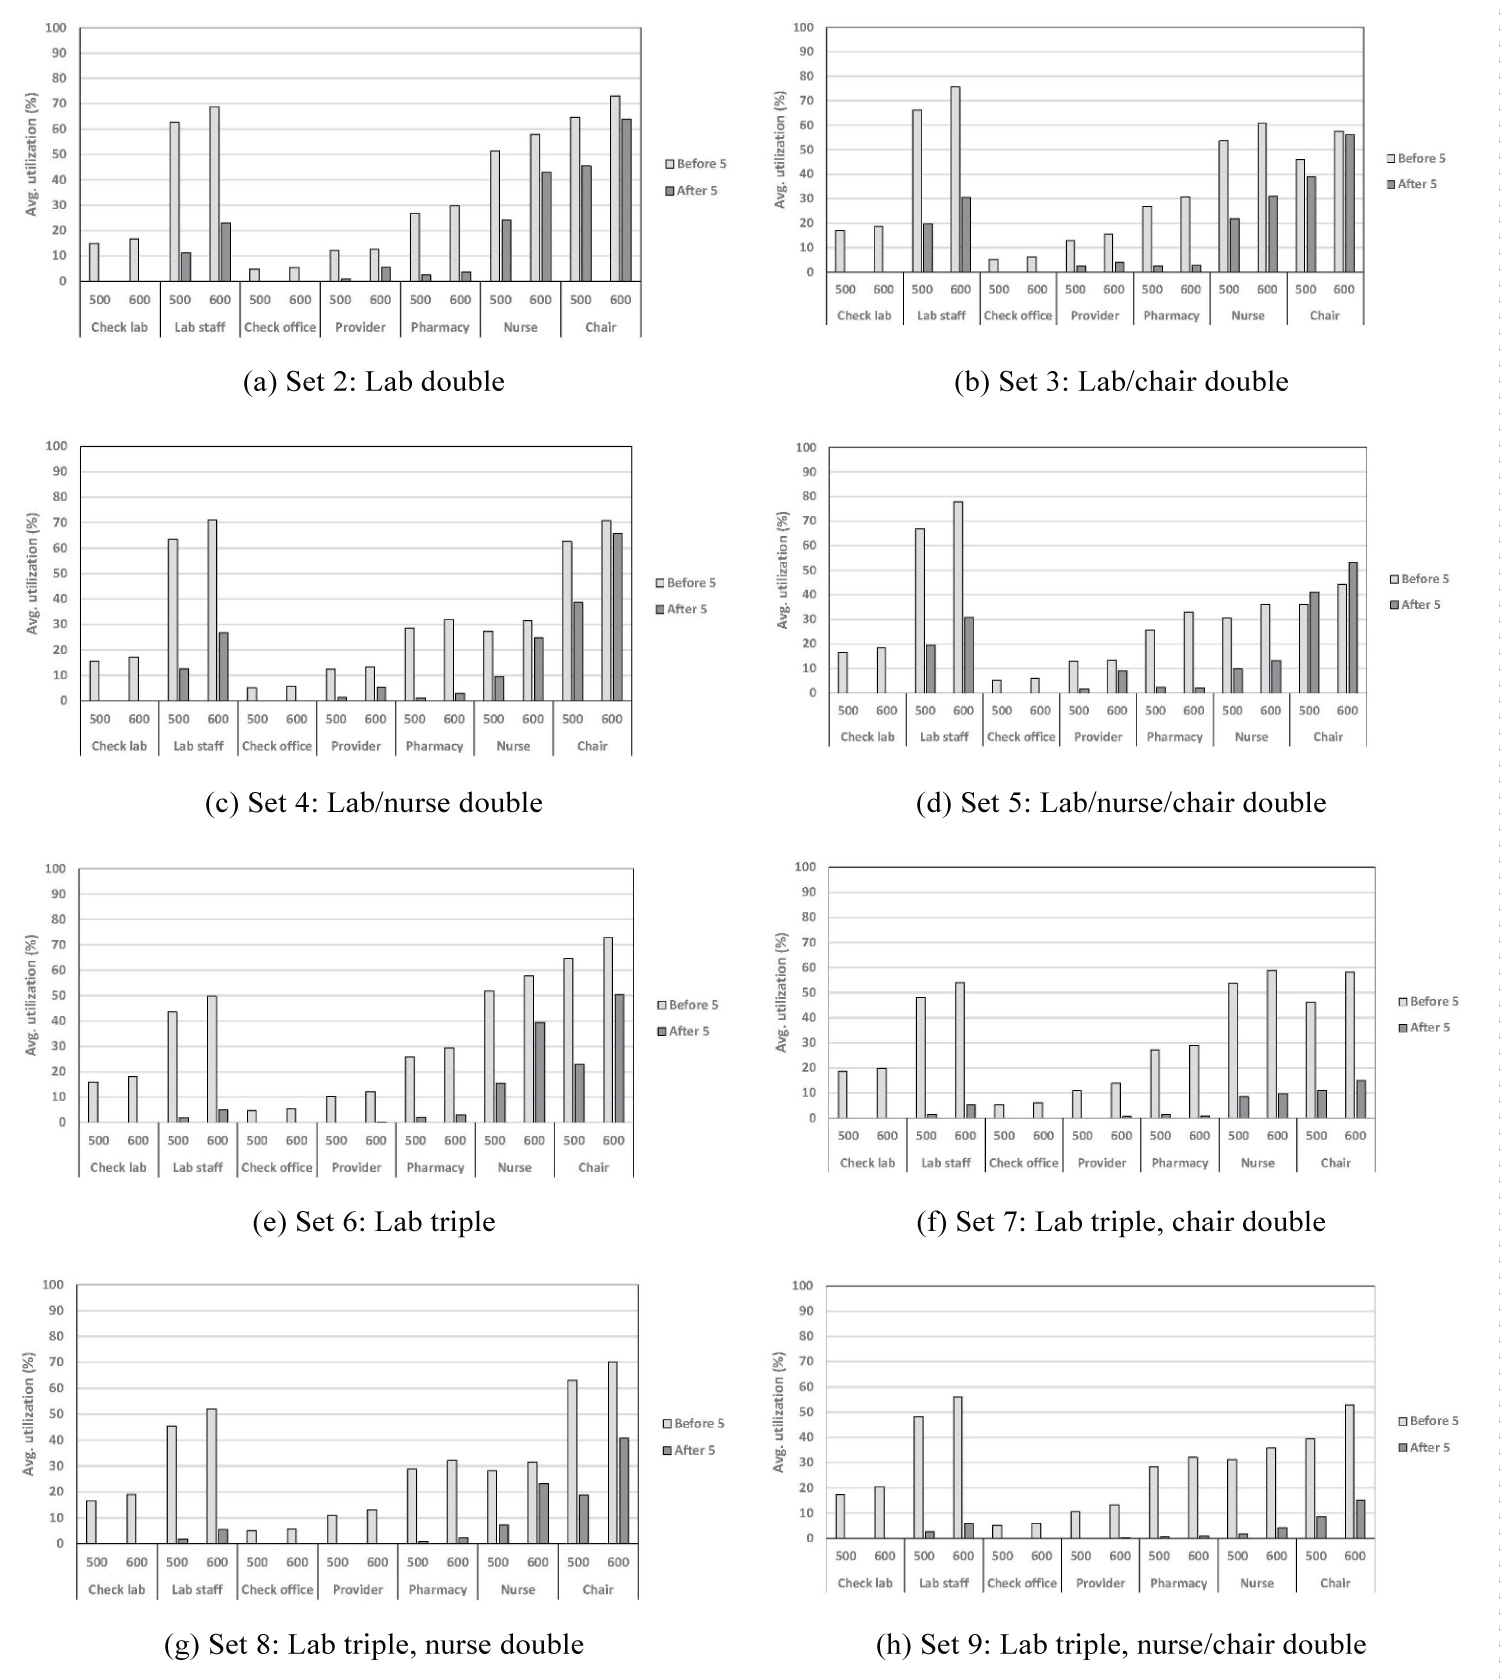
Figure 7: Results on resource utilization under other scenarios....
Results on resource utilization under other scenarios.
Note: Results for set 1 are already presented in Figure 4b; see Table 5 and Table 6 for description of numbers 1-7 and sets 2-9, respectively.
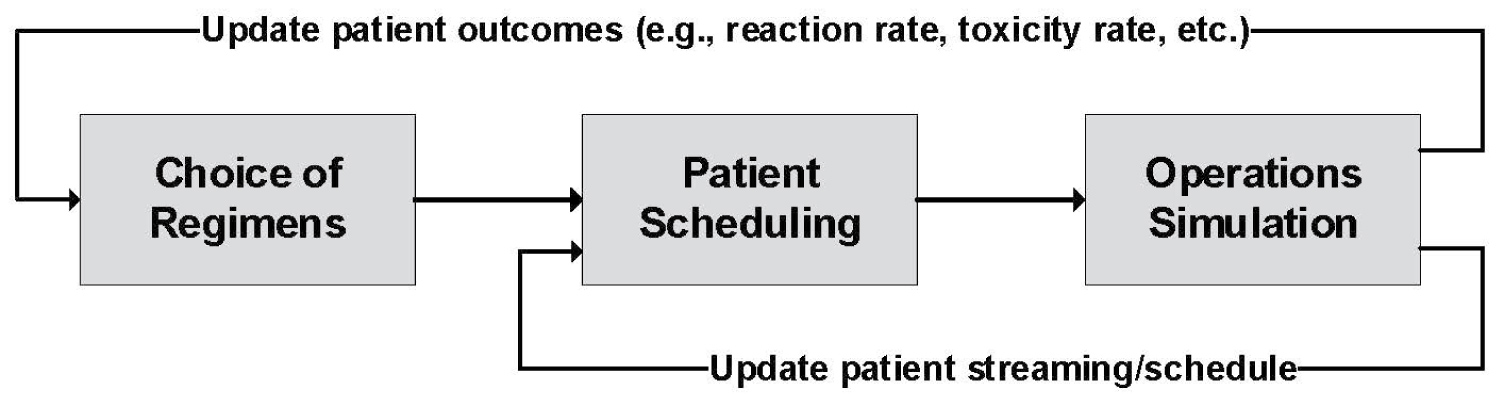
Figure 8: A holistic framework for chemotherapy operations....
A holistic framework for chemotherapy operations.
Tables
Table 1: Prevalence of chemotherapy among different cancer types in the U.S. for 2012-2016 (ACS 2019) [6].
Table 2: Information of regimens in each cycle (D1: # drugs; D2: Total duration (hours)).
Table 3: Weekday schedule of resources (baseline scenario).
Table 4: Estimation of times of different processes, delays, and decisions.
Table 5: Description of activities before and after sitting in a chair.
Table 6: Different scenarios for resource allocation.
Table 7: ANOVA results (asterisk(s) represent statistical significance).
References
- IARC (2019) All cancers. International Agency for Research on Cancer.
- NCI (2018) Cancer statistics. National Cancer Institute.
- Miller KD, Siegel RL, Lin CC, Mariotto AB, Kramer JL, et al. (2016) Cancer treatment and survivorship statistics. CA Cancer J Clin 66: 271-289.
- ACS (2016) Treatment types. American Cancer Society.
- FDA (2017) Types of cancer treatment and care. U.S. Food and Drug Administration.
- ACS (2019) Cancer treatment & survivorship - facts & figures. American Cancer Society.
- ACS (2016) Chemotherapy for breast cancer. American Cancer Society.
- Buffery D (2019) New indications approved by the FDA in 2018 for oncology drugs. Journal of Hematology Oncology Pharmacy 9: 6-13.
- Van Merode GG, Groothuis S, Schoenmakers M, Boersma HH (2002) Simulation studies and the alignment of interests. Health Care Management Science 5: 97-102.
- Santibanez P, Aristizabal R, Puterman ML, Chow VS, Huang W, et al. (2012) Operations research methods improve chemotherapy patient appointment scheduling. Jt Comm J Qual Patient Saf 38: 541-553.
- Woodall JC, Gosselin T, Boswell A, Murr M, Denton BT (2013) Improving patient access to chemotherapy treatment at Duke Cancer Institute. Interfaces 43: 449-461.
- Liang B, Turkcan A, Ceyhan ME, Stuart K (2015) Improvement of chemotherapy patient flow and scheduling in an outpatient oncology clinic. International Journal of Production Research 53: 7177-7190.
- Baril C, Gascon V, Miller J, Bounhol C (2016) Studying nurses workload and patient waiting time in a hematology-oncology clinic with discrete event simulation. IIE Transactions on Healthcare Systems Engineering 6: 223-234.
- Suss S, Bhuiyan N, Demirli K, Batist G (2017) Toward implementing patient flow in a cancer treatment center to reduce patient waiting time and improve efficiency. Journal of Oncology Practice 13: e530-e537.
- Suss S, Bhuiyan N, Demirli K, Batist G (2018) Achieving level patient flow in an outpatient oncology clinic. IISE Transactions on Healthcare Systems Engineering 8: 47-58.
- Sepulveda JA, Thompson WJ, Baesler FF, Alvarez MI, Cahoon LE (1999) The use of simulation for process improvement in a cancer treatment center. 1999 Winter Simulation Conference Proceedings 2: 1541-1548.
- Dobish R (2003) Next-day chemotherapy scheduling: A multidisciplinary approach to solving workload issues in a tertiary oncology center. Journal of Oncology Pharmacy Practice 9: 37-42.
- Turkcan A, Zeng B, Lawley M (2012) Chemotherapy operations planning and scheduling. IIE Transactions on Healthcare Systems Engineering 2: 31-49.
- Gocgun Y, Puterman ML (2014) Dynamic scheduling with due dates and time windows: An application to chemotherapy patient appointment booking. Health Care Manag Sci 17: 60-76.
- Hahn-Goldberg S, Carter MW, Beck JC, Trudeau M, Sousa P, et al. (2014) Dynamic optimization of chemotherapy outpatient scheduling with uncertainty. Health Care Manag Sci 17: 379-392.
- Castaing J, Cohn A, Denton B, Weizer A (2016) A stochastic programming approach to reduce patient wait times and overtime in an outpatient infusion center. IIE Transactions on Healthcare Systems Engineering 6: 111-125.
- Alvarado MM, Cotton TG, Ntaimo L, P´erez E, Carpentier WR (2018) Modeling and simulation of oncology clinic operations in discrete event system specification. Simulation 94: 105-121.
- Benzaid M, Lahrichi N, Rousseau LM (2018) Chemotherapy appointment scheduling and daily outpatient- nurse assignment. Health Care Manag Sci 23: 34-50.
- Hooshangi-Tabrizi P, Contreras I, Bhuiyan N, Batist G (2020) Improving patient-care services at an oncology clinic using a flexible and adaptive scheduling procedure. Expert Systems with Applications 150: 113267.
- Condotta A, Shakhlevich NV (2014) Scheduling patient appointments via multilevel template: A case study in chemotherapy. Operations Research for Health Care 3: 129-144.
- Liang B, Turkcan A (2016) Acuity-based nurse assignment and patient scheduling in oncology clinics. Health Care Manag Sci 19: 207-226.
- Leeftink AG, Vliegen IMH, Hans EW (2017) Stochastic integer programming for multi-disciplinary outpatient clinic planning. Health Care Manag Sci 22: 1-15.
- Alvarado M, Ntaimo L (2018) Chemotherapy appointment scheduling under uncertainty using mean-risk stochastic integer programming. Health Care Manag Sci 21: 87-104.
- (2019) Rockwell automation.
Author Details
Alireza Boloori1*, John Fowler2, Srimathy Mohan2, Mohan Gopalakrishnan2, Jeffrey A Betcher3, Kristin M Altman3, James G Collins3, Alan H Bryce3 and Ruben Mesa4
1Departments of Statistics and Probability and Family Medicine, Michigan State University, USA
2Department of Supply Chain Management, Arizona State University, USA
3Mayo Clinic Cancer Center, USA
4University of Texas San Antonio Cancer Center, USA
Corresponding author
Alireza Boloori, Departments of Statistics and Probability and Family Medicine, Michigan State University, East Lansing, MI, USA
Accepted: May 14, 2021 | Published Online: May 16, 2021
Citation: Boloori A, Fowler J, Mohan S, Gopalakrishnan M, Betcher JA, et al. (2021) Analysis of Workflow in Chemotherapy Clinical Practice. Int J Healthc Syst Eng 3:008
Copyright: © 2021 Boloori A, et al. This is an open-access article distributed under the terms of the Creative Commons Attribution License, which permits unrestricted use, distribution, and reproduction in any medium, provided the original author and source are credited.
Abstract
The number of new cases of cancer diagnosed is constantly increasing. Although cancer is one of the leading causes of death in the U.S., the ongoing development of new intravenous drugs continues to improve the life expectancy and quality of life of cancer patients. However, given the total number of chemotherapy drugs that are currently available, and also the influx of newly-approved agents by the Food and Drug Administration, managing these drugs in an oncology center is a challenging task from an operational standpoint. As the first step to address these challenges, we attempt to analyze potential sources of system wastage. To this end, we develop a discrete-event simulation model which mimics the operations at Mayo Clinic Cancer Center on a daily basis. In particular, we conduct a set of experiments on the number of resources available, and see how different resource scenarios would impact (1) Patient's length of stay (both value-added and non-value-added times), (2) Resource utilization, and (3) Possibility of same-day treatment completions.
Keywords
Chemotherapy, Oncology, Delivery process, Experience of care, Discrete-event simulation
Introduction
As one of leading causes of death worldwide, cancer was responsible for about 9.6 million deaths in 2018, while 18.1 million new cases of cancer were diagnosed in the same year [1]. The situation in the United States has not been better as more than 1.7 million new cases of cancer were estimated to be diagnosed in 2018, while the total number of cancer-related deaths was expected to surpass 0.6 million in the same year [2].
Despite these soaring death tolls, millions of people with cancer remain alive. As reported by Miller, et al. [3], more than 15.4 million people in the U.S. were estimated to be alive while having cancer in 2016, and this number is projected to go beyond 20 million in 2026. In order to deal with their cancers, the majority of this population requires different treatments including surgery, chemotherapy, and radiation therapy. Although any combination of these treatments may be recommended for a patient depending on the type/severity of cancer [4], intravenous infusions of chemotherapy is the mainstay of treatment for most cases of advanced disease. For the purposes of this paper, we will use the Food and Drug Administration (FDA) definition of chemotherapy, which is "a cancer treatment that uses drugs to destroy cancer cells" [5]. Thus, the term is inclusive of all anti-cancer drugs including DNA damaging agents, immunotherapy, protein inhibitors, antibodies, hormone therapies, and all other classes of drugs used to kill cancer cells. To this end, Table 1 [6] shows the prevalence of using chemotherapy in some of most common cancer types. Even in those cases where chemotherapy is not used predominantly (e.g., lung and uterine cancers), it has an important impact on the process of treating cancer. For example, we refer to the following cases: (1) Neoadjuvant chemotherapy which is conducted before a surgery in order to shrink a large mass (to increase the chance of a successful removal surgery), and (2) Adjuvant chemotherapy which is conducted after a surgery to eradicate any remaining microscopic disease that was left behind [7].
To contribute to this stream, the approval of new chemotherapy agents by the Food and Drug Administration (FDA) has been on the rise. For example, 18 new drugs and 6 biosimilars were approved in 2018 alone Buffery [8]. However, this flow of incoming drugs creates complications for oncology centers (referred to as OCs, hereafter) by perturbing (1) The healthcare delivery process (e.g., chair and bed utilization, nurse/workload planning, inventory/ordering management, etc.), and (2) Patient experience of care (e.g., waiting time, same-day treatment completion, unforeseeable drug reaction, availability of drugs, etc.). To address these challenges, most OCs take a reactive approach of waiting for the drug to be incorporated in medical practice, and then observing its impact on different parts of an OC. However, being able to predict the drug's impact before adoption would be a great asset for OCs in this ever-growing environment (i.e., a proactive approach).
Developing such a proactive approach requires an understanding of how current resources are utilized in managing chemotherapy agents. To tackle this, we have collected data from a set of patients (with multiple myeloma) who received chemotherapy at the Mayo Clinic Cancer Center between November 2015 and May 2017. Utilizing this data (e.g., infusion time, utilized chair/bed time, total administration time, occurrence of infusion reaction, etc.), we attempt to identify sources of system waste, including (1) Ineffective utilization of resources, (2) Unnecessary waiting time for patients, and (3) Inability to finish a treatment within the same day. To quantify these measures, we develop a discrete-event simulation model to simulate the daily operations of the cancer center.
The remainder of this paper is organized as follows. In section 4, we provide a brief survey of relevant literature. In section 5, we describe the problem under consideration, including the operations at Mayo Clinic Cancer Center. In section 6, we discuss our methodology (discrete event simulation). We also shed light on our numerical settings, including our clinical data set, parameter estimations from this data, and some initial results. In section 7, we present our numerical results from a design of experiment on the number of resources available. Finally, in section 8, we conclude our paper and discuss some avenues for future research.
Literature Review
In an oncology center, there are typically three main areas that would impact operations: (1) System process improvement, (2) Patient streaming, and (3) The planning and scheduling of appointments and resources. While, in the current study, we primarily contribute to the first two areas, we also discuss extant literature associated with the last area.
System operations process improvement
The main emphasis under this category is to diagnose potential sources of system improvements or wastage in healthcare settings. Discrete event simulation (DES) is the most commonly used tool in fulfilling this objective, because it is able to capture the inherent complexities and dynamic nature of these settings. We refer to some of the studies from the literature that have utilized DES models in regard to process improvements in oncology centers: Van Merode, et al. [9] analyze the impact of each patient/drug combination on waiting times and costs, Santibanez, et al. [10] evaluate the effects of alternative scheduling scenarios on patients' waiting time and satisfaction, Woodall, et al. [11] predict patient waiting times and resource utilizations, Liang, et al. [12] improve patients' and staff flows, Baril, et al. [13] analyze the impact of increase in number of treatments on patient waiting time and nurse workload, and Suss, et al. [14,15] reduce patients total waiting time. The foregoing simulations have some resemblance of daily operations in a healthcare setting. Our simulation is different in the sense that it captures a complex process flow that is completely driven by an external spreadsheet that contains the data from Mayo Clinic Cancer Center. Furthermore, as will be discussed next, in our simulation we establish a complex classification of streams which match the daily operations at the cancer center.
Patient streaming
Although diverse patients streaming is a common phenomenon in oncology centers, it has been less discussed from an operational standpoint for chemotherapy treatments. Baril, et al. [13] consider three streams (or trajectories) for patients based on possibilities of seeing a provider or having an infusion on any appointment day. Suss, et al. [15] use another streaming system by considering trajectories based on possibilities of having blood tests, visiting a provider, and having infusions with different lengths. As other instances addressing patient trajectories in oncology centers, see Sepulveda, et al. [16] and Dobish [17]. These studies utilize the aforementioned trajectories to develop new appointment and resource scheduling. Compared to the extant literature, our notion of patient streaming is established based on a very complex classification of streams which match the daily operations at Mayo Clinic Cancer Center (see our discussion in section 5.1). Our study is also different from the body of literature using patient trajectories to track flow of patients across multiple facilities (see, e.g., Sepulveda, et al. [16] for a feasibility study for introducing new treatment facilities). Instead, all the operations at Mayo Clinic Cancer Center are carried out in one location, and hence, our notion of patient streaming is entirely attributed to potential inclusion/exclusion of different processes in a chemotherapy treatment session.
Planning and scheduling
The main body of literature in this stream has typically focused on developing optimization frameworks, where decision variables are to plan (inter-day) and/or schedule (intra-day) chemotherapy appointments or resources.
Appointments: Turkcan, et al. [18] minimize patients' deviation from optimal treatment plans via an integer programming (IP) model along with a two-stage heuristic to handle planning and scheduling decisions. Gocgun and Puterman [19] propose a Markov decision process model to schedule appointments while taking into account patients' preferences about their desired time windows. They minimize the scheduling cost by penalizing earliness/tardiness. Hahn-Goldberg, et al. [20] accommodate real-time scheduling by taking into consideration last-minute scheduling changes. They propose a deterministic model along with dynamic-template and shuffling algorithms to minimize the system waiting time. Castaing, et al. [21] present a stochastic IP model for scheduling infusion sessions with the aim of minimizing expected waiting time for each patient and the total treatment time for all patients. For recent studies in this avenue, one can refer to Alvarado, et al. [22], Benzaid, et al. [23], Hooshangi-Tabrizi, et al. [24]. In our study, we use a simple IP model to identify the arrival of patients to the system for the first time (see section 6.2).
Resources: Woodall, et al. [11] minimize nurse shortages via a mixed IP model to schedule nursing staff. Of note, there are also instances in the literature that have analyzed both appointment and resource planning/scheduling. Condotta and Shakhlevich [25] and Liang, et al. [12] minimize patients' waiting time and nurses' workload/time by proposing a multi-criteria optimization model and a linear programming model, respectively. Liang and Turkcan [26] take a new perspective and focus on functional and primary care nursing delivery systems, where their main difference is in the utilization of nurses. For the former, each patient may have different nurses on different chemotherapy sessions. However, for the latter, the same nurse will take over chemotherapy sessions for the patient unless the nurse has a work overload (in such a circumstance, a part-time nurse will be added to help). The authors minimize patient waiting time and nurse overtime (under the first system) and total overtime and excess workload (under the second system). Leeftink, et al. [27] minimize patient waiting time, clinician idle time, and clinician overtime. They develop an IP model along with a sample average approximation for this matter. Alvarado and Ntaimo [28] propose a stochastic IP model to optimize four objectives: Minimize expected system delays, expected system time, and expected nurse overtime, and maximize expected throughput. In our study, we consider the current resource allocation at the cancer center, and then evaluate alternative allocation scenarios for these resources.
Problem Description
In this section, we shed light on operations at the Mayo Clinic Cancer Center (referred to as MCCC, hereafter) with respect to the management of chemotherapy treatments. Based on these operations, we will then build our simulation model. To this end, we first introduce some of the terminologies that we will use in our discussions. Figure 1 illustrates an example, where there are three regimens (each could have multiple drug infusions), and for each regimen, there will be multiple treatment cycles. According to Figure 1, if a patient is assigned to regimen 1, 2, or 3, then there will be 4, 3, or 2 treatment days for that patient in each cycle, respectively, where between each two consecutive treatment days, there must be an elapsed time (which is determined by the regimen's instructions). Once s/he is done in any cycle, there will be an inter-cycle time until the beginning of the next cycle, in which the foregoing process will be repeated. (To help a reader to better understand the relationships between the foregoing elements and many others, we also provide an entity representation diagram (ERD) in Figure EC.1 in Online Appendix.) Based on this premise, we now explain in more details the operations at MCCC.
Operations at mayo clinic cancer center
We show the flowchart of operations at MCCC in Figure 2. As illustrated, in each treatment day in each cycle, a patient undergoes lab work. Then, under either of the following conditions, s/he visits a provider in the first treatment day of each cycle: (1) If the patient is in the first two cycles of chemotherapy, (2) If any drug reaction or intolerance occurred in the previous cycle, or (3) If the patient did not visit a provider in the previous cycle. For example, if we are in the third cycle and the patient did not experience any reaction in the second cycle (but did visit the provider in that cycle), then s/he does not visit the provider in the current cycle, and instead, a nurse reviews the patient's lab results.
There are two types of abnormalities that might be observed for each patient: (1) Lab abnormality (e.g., low hemoglobin levels in lab results) and (2) Patient-reported toxicity, which is a more subjective index compared to item (1). In this study, we label both of these abnormalities as a "red flag". If a red flag is observed and the provider is not already aware of the condition, then the nurse will notify the provider, because ultimately the provider should approve the continuation of therapy. Of note, there could exist occasions where the nurse cannot find the provider (provider not available), and hence, they may have to postpone the infusion to another day (although this would be very unlikely).
Notwithstanding, after getting the approval, the patient will be put in a chair/bed for receiving the treatment. At this point, two nurses will double check the patient's information and signal the pharmacy to prepare the chemotherapy drugs. Each treatment could consist of multiple drug infusions, and each drug infusion requires having a pre-medication (referred to as "pre-med", hereafter). Once pre-meds are readied by the pharmacy, a nurse will pick them and set them up for the patient. In parallel to this, a pharmacist (or assistant) will start working to prepare the actual chemotherapy drug.
Now, if a reaction/intolerance occurs during an infusion, three strategies can be followed: (1) Continue the infusion while using supportive care (i.e., no modification in the infusion rate), (2) Continue the infusion but lowering the infusion rate, or (3) Stop the infusion completely, which ends the current treatment day. If the current infusion is completed, then the next infusion (if any) will be administered. After completing all infusions, the next treatment day/cycle is scheduled. This continues until all cycles are done.
We note that some delays are inherent in the operations and processes in Figure 2. However, we also observe other delays between the operations that are not necessarily categorized as process delays. In Figure 2, we show such delays in triangles 1-2, which include: (1) Delay between the medications activated by a nurse and the actual modifications made by the pharmacy, and (2) Delay before the start of infusion. In section 6.2.3, we address how we estimate these parameters.
Patient streaming
As demonstrated in section 5.1, to receive chemotherapy treatments, a patient typically goes through a series of procedures, such as having blood (lab) tests, visiting a provider (e.g., physicians, nurse practitioners, physician assistants, and advanced practice practitioners), and infusion itself. However, there are several factors in an OC that would result in different streaming among patients. Indeed, chemotherapy treatments are cyclical, which implies that a patient could undergo multiple cycles, where in each cycle, s/he receives treatments over multiple weeks (e.g., one treatment in each week). Since regimens are patient-specific and there are typically multiple regimens available, there will be a wide variation in patients streaming. More importantly, since resource availability may vary on a daily/hourly basis (e.g., limited number of providers in a specific day or during lunch time), this will create further variation in the streaming. For example, a patient may see the provider and have infusion on the same day, while another patient may have to complete infusion on the second day. Based on this premise, we consider the following types of patient streaming (see Figure 2):
• S = 1: A new patient who is in the first cycle, first treatment day, and who is supposed to have lab work, provider visit, and infusion all on that day.
• S = 2: A patient who has done the lab works on a treatment day, but the provider visit, and infusion are yet to be done on that day. We note that patients' appointments are typically scheduled based on an amount of time expected for each process. However, when the lab results take more time than expected, there may not be enough time for a potential office visit and/or an infusion.
• S = 3: A patient who has done the lab works on a treatment day, and the infusion(s) is left. We note that the patient might have had the provider visit prior to the infusion.
• S = 4: When a red flag is observed, and hence, a nurse needs to notify a provider, but no provider is available. This happens when the provider visit was not required beforehand.
• S = 5: When a patient arrives for the next treatment day (still in the same cycle). Therefore, the patient is expected to have the lab work and infusion on that day (i.e., no provider visit would be required).
• S = 6: When a patient arrives for the next cycle (reset treatment day to 1). Hence, the patient is expected to have the lab work and infusion on that day (i.e., provider visit may or may not be required).
• S = 7: This is the same as S = 6, with the difference that it is the result of a no-go decision made for a cycle. This prompts moving to the next cycle if there is any.
We note that there are similarities between the above-mentioned streams in terms of the underlying processes required. For example, streams S = 5 and S = 6 could both imply lab work and infusion. However, they are different in terms of therapy status: While in S = 5, we are still in the same cycle, in S = 6, we move to the next cycle (i.e., a patient with S = 6 is downstream compared to another with S = 5).
Simulation Model
In this section, we first shed light on the clinical data obtained from MCCC. Then, we will elaborate on the discrete-event simulation model that we have developed based on the operations at MCCC. This includes the parameter estimation and information about the availability of resources. Finally, we present our baseline numerical results.
Clinical data set
We have collected data on a set of patients who received chemotherapies at MCCC between November 2015 and May 2017. Utilizing the information in this data (e.g., infusion time, utilized chair/bed time, total administration time, occurrence of infusion reaction, etc.), we estimate the main parameters used in our simulation model (see section 6.2.3 for more details). Furthermore, we consider three regimens in this study with the following characteristics: Length of cycle for all regimens is 28 days, there are a maximum of four treatment days in each cycle, and the time gap between each consecutive treatment days is 7 days. Table 2 shows other information about these regimens.
Discrete event simulation
We use Arena [29] to build a discrete-event simulation model. We develop this simulation based on the flowchart of MCCC's operations (see Figure 2 in section 5.1). In our simulation, we capture a complex process flow completely driven by an external spreadsheet. Incorporating the data, this can be adjusted by physicians, nurse practitioners, etc. in their clinical practice. To make this simulation more applicable to the practice, we also consider a very complex classification of patients' streams which match the daily operations at MCCC. As inputs to Arena, we need to have information about (1) Arrival schedule of patients, (2) Availability of resources (along with their schedules), and (3) Estimation of different parameters (e.g., processes, delays, decisions, etc.). These items will be explained in sections 6.2.1-6.2.3, respectively.
Patients arrival: Planning and scheduling: We establish the arrival schedule of patients based on the following integer programming (IP) model:
Where the main decision variable is the number of new patients to admit in calendar week (i.e., equally distributed throughout 5 business days in week i), and the objective function (1a) is to maximize patient utilization against a benchmark capacity C over the time horizon (K calendar weeks). Furthermore, constraint (1b) simply means that the total number of patients (i.e., new plus existing) in any calendar week cannot surpass the capacity C. Of note, we identify the number of existing patients by utilizing the characteristics of a chemotherapy regimen (assigned to patients) in a spreadsheet. For example, if there are 100 new patients arriving in the system in calendar week 1, we know that there will be 100 existing ones in calendar week 2 (provided that each patient is on a regimen with treatment days in that cycle). Of note, this schedule may not hold due to various reasons such as when a patient experiences a reaction/intolerance or when a provider should stop an infusion or the treatment cycle. We note that we have accounted for these irregularities in our simulation (see section 5.1).
Although the model in (1a)-(1c) provides a schedule for new patients coming into the system, we also need to identify the planning part of this arrival (i.e., arrival hour during a day). To this end, we resort to Equation (2), which is derived based on MCCC's operations and the requirement of each patient (i.e., lab work, office visit, and infusion).
Where d represents the number of drugs used for each treatment session (numbers are written based on a 24-hour/day format). Also, RA indicates required activities.
Schedules of resources: There are six types of resources involved: Nurses, providers, pharmacists, lab staff, operators for lab/infusion check-in, and operators for office visit check-in. Table 3 shows the baseline scenario for these resources, where the information is based on the current practice at MCCC. Due to the large number of chairs and nurses, we also consider zones for their allocations to patients. In particular, we consider 5 zones, where in each zone there are 10 chairs and 5 nurses. Furthermore, in our simulation, we generate walk around for nurses within their zones. For patients who do not experience a reaction during their infusion, a nurse is expected to visit the patient after every 15 minutes (on average), while this time is reduced to 10 minutes for patients who have reactions during their infusion.
Parameter setting for processes, delays, and decisions: In Table 4, we show the estimations of time of processes based on our clinical data set. We used the Arena Input Analyzer for making these estimations. We also note that there are some instances where, due to the small sample sizes, we make reasonable assumptions (based on expert opinions of physicians) in place of estimations.
Performance measures
To run our simulation in Arena and obtain our numerical results, we consider the time frame of K = 19 calendar weeks and the capacity of C = 500 patients. Figure 3 illustrates the arrival schedule of patients over this 19-week period (based on the model in (1a)-(1c)).
As can be seen, the period from week 6 until week 16 would form a steady-state condition with respect to the number of patients in the system. Hence, we tailored our simulation model based on a warm-up period of 5 weeks and an actual simulation period of 11 weeks.
We run each simulation for 100 iterations and track the following performance measures: Length of stay, resource utilization, and number of same-day treatment completions. Our reason for targeting these measures is two-fold: They are among the most common metrics in the literature of healthcare delivery problems. Furthermore, physicians and medical staff at MCCC have emphasized on the importance of these measures in their daily operations.
Length of stay: Length of stay is important from both system (i.e., the healthcare delivery process) and patient (i.e., experience of care) perspectives. In Table 5, we break down the time that each patient would spend before and after being seated in a chair. Of note, since a patient may come in and leave the system for any treatment day, the length of stay would be the total time spent in the system in a non-continuous way.
Resource utilization: We aim to analyze the utilization of our resources (i.e., % of resources being utilized in daily operations). Although this measure would be of more interest from the system standpoint, we also aim to analyze its potential ramifications on length of stay, which could, in turn, impact patients' experience of care.
Number of same-day treatment completions: This is a measure that captures the possibility of starting and finishing a chemotherapy treatment session in a single day (by the end of daily regular hours at 5:00 PM). It would be particularly important for MCCC to keep track of this measure so as to assess the patient's experience of care.
Summary of results under the baseline scenario: In Table 3, we showed the schedule of resources available at MCCC under the baseline scenario. We now aim to analyze the abovementioned performance measures under this scenario. Figure 4 shows the results for the first two measures.
Figure 4a shows the amount of time that a patient would spend under each activity whether it is prior to being seated in a chair or after that. Furthermore, we have classified each activity based on non-value-added time (i.e., waiting time) and value-added time (i.e., process time, if applicable). As can be observed, the most significant time that a patient must wait (before getting into a process) is for the lab work. This implies that the lab staff could be the bottleneck in the daily operations at MCCC.
Figure 4b shows the average utilization of resources. We further break down our results based on two different patient capacities (C = 500 and 600 patients per calendar week), and based on whether or not we are during the regular hours (from 7:00 AM until 5:00 PM or after 5:00 PM). As can be perceived from this figure, all 6 lab staff are completely utilized during the regular hours, which is another indication that the lab staff could be the bottleneck of the operations (under C = 500 scenario).
Regarding our last measure (number of same-day treatment completions), we note that a patient is typically seated in a chair before 5:00 PM. However, it is not known whether s/he will finish his/her session by 5:00 PM, between 5:00 and 8:00 PM, or in another day. Therefore, we aim to analyze the number of infusions/treatments that are completed during these three time frames. Figure 5 shows the results. Apparently, the higher the ratio of same-day (whether by 5:00 or 8:00 PM) to another-day completions gets, that will be more desirable from the patients' perspective.
Finally, regarding our numerical results under the baseline scenario, we note that we got the approval of MCCC management on the fact that our results are reflecting appropriately on the behavior on the floor and existing metrics from their daily operations.
Design of experiments: After discussing our results under the baseline scenario, we venture into a design of experiments (DOE). In the previous section, we noticed that how the lab staff could serve as the bottleneck in daily operations. Thus, this DOE would allow us to further examine variations in resources and how they could impact the performance measures. Table 6 shows our DOE setting. Of note, we consider variations in the lab staff, nurses, and chairs, because they are being utilized the most (see our results in Figure 4b). Furthermore, since the lab staff is identified as the bottleneck, it would not make sense to increase other resources while keeping the baseline allocation of lab staff. Therefore, we only analyze the baseline lab staff under set 1. Of note, due to its role as the bottleneck, the lab staff is the only resource that we triple in our experiment. To reflect on our DOE, we will conduct various sets of analysis of variance (ANOVA) in section 7.2.
We next provide a summary of the results from our various simulation runs.
Computational Results
Here, we demonstrate our analysis under other eight resource scenarios (sets 2-9 in Table 6). This will include our results on the three performance measures, as well as ANOVAs. It should be noted that, under each scenario, we have iterated our simulation for 100 times.
Summary of results under other scenarios
Length of stay: From our results in Figure 6, notice that, when the number of lab staff is doubled from 6 to 12, the waiting time for getting into the lab can be considerably lowered (more than 50%), but this is still a long time for a patient (see Figure 6a, Figure 6b, Figure 6c and Figure 6d). Thus, we also consider scenarios where the number of lab staff is tripled to 18. Under such circumstances, the waiting time can be reduced to less than 90 minutes (see Figure 6e). Furthermore, whether the lab staff is doubled or tripled, the waiting time for seizing a chair (in order to start an infusion) would be minimum when nurses and chairs are all doubled. However, this waiting time would be still in a reasonable range if the lab staff and chairs (not nurses) are only doubled. Finally, we realized from our results in Figure 6 that, when the ratio of chairs/nurses in each zone is increased, the waiting time for some activities would increase as well. These mainly include nurses double and triple checks, drug preparations by the pharmacy, nurses checks between infusions (or after a reaction), and patient discharge.
Resource utilization: In Table 3, we provided the schedule of resources, according to which some resources are not available after 5:00 PM. However, based on Figure 7, these resources are shown to be utilized after 5:00 PM. This could happen when a patient has already entered the queue (for that particular process) prior to 5:00 PM, and is waiting to seize (or has already seized) the resource. This, in turn, reveals the overtime performance for lab staff, providers, and pharmacists. Our results in Figure 7 reveal the intuitive fact that increasing the number of a resource would typically result in a reduced utilization for that resource. However, we also know from our results in Figure 6 that patients would spend less amount of waiting time as a result of increased resources. Therefore, there would exist a trade-off between resource utilization and patients' non-value-added time in the system.
Number of same-day treatment completions: When presenting our results under the baseline scenario in Figure 5, we discussed that as the ratio of same-day completions (whether by 5:00 or 8:00 PM) to another-day completions increases, patients would spend less amount of time in the system, which is more desirable for them. In addition to set 1 (i.e., baseline resource allocation), we also noticed that, under resource sets 5 (double lab/chair/nurse) and 9 (triple lab, double chair/nurse), the foregoing result holds.
Results on analysis of variance
Based on our resource scenarios (see Table 6), we also conduct a design of experiments (DOE) on the number of resources available. To this end, we consider three outcomes as follows and perform an analysis of variance (ANOVA) for each outcome.
• Total time (before chair): This is the sum of value-added (process) and non-value-added (waiting) times before a patient is being seated in a chair (see Table 5).
• Total time (after in chair): Similar to the previous item, this would be measured after the patient is seated in the chair (see Table 5).
• Utilization of all resources: This is the utilization rate considered across all resources.
Since the lab staff, chairs, and nurse staff are subject to change in our DOE setting, we consider their individual effect, as well as their pairwise and three-way interactions. We note that, due to 9 resource scenarios and 100 replications for our simulation under each scenario, there are a total of 900 data points over which we conduct our ANOVAs. We present the results in Table 7.
ANOVA 1: Total time (before chair). We test the hypothesis that different factors for resources would result in different total time (before chair) for a patient (versus the null hypothesis that such factors would not make any difference in this outcome), such that if there is a statistical significance for a resource, we reject the null hypothesis. For ANOVA 1, the null hypothesis is rejected for all resource combinations (the significance level ≤ 10%). Therefore, whether to consider an individual resource (e.g., lab staff, nurse staff, or chairs) or an interaction of these resources, there is evidence that changing such resources would change the amount of time that each patient would spend in the MCCC prior to being seated in a chair (as it would be expected).
ANOVA 2: Total time (in chair). Our results indicate that variations in the allocation of lab staff or their interaction with chair allocation could not have a statistically significant impact on the total amount of time that a patient spends in the chair. The latter is a counter-intuitive result. One justification for this finding could be the fact that the lab would create a bottleneck in daily operations. As a result, the influx of patients to chairs would happen at a lower pace no matter how many chairs are available. We also note that for all other resource combinations, changing the resource allocation would result in a different outcome.
ANOVA 3: Resource utilization. For interactions between resource allocations for the lab and chairs or that for lab, nurse staff, and chairs, we are not able to establish statistical significance. On the other hand, for all other resource combinations (particularly when we consider each resource separately), there is a statistical significance (the significance level ≤ 5%). This means that changing resources for lab staff, nurse staff, and chairs individually would alter the overall average utilization of all resources.
Conclusion
The number of new cases of cancer diagnosed is constantly increasing each year. Although cancer is one of the leading causes of death in the U.S., using chemotherapy (as the main treatment mode) has enabled the majority of patients to live longer. However, given the total number of chemotherapy drugs that are currently available, and also the influx of newly-approved agents by the FDA, managing these drugs in an oncology center is a challenging task from an operational standpoint. To address these challenges, we first to analyze potential sources of system wastage. To this end, we develop a detailed discrete- event simulation model which mimics the operations at Mayo Clinic Cancer Center on a daily basis. We also conduct a design of experiments on the number of resources available, and see different resource scenarios impact (1) Patient's length of stay (particularly the part impacted by avoidable waiting times), (2) Resource utilization, and (3) Possibility of same-day treatment completions.
This study contributes to the healthcare delivery literature from an application standpoint. Indeed, our simulation model not only captures information about streaming of patients, but also incorporates most factors that influence daily operations at MCCC, whether they are related to the supply side (e.g., availability of nurses, providers, pharmacists, lab staff, chairs and beds, etc.) or emanated from the demand side (e.g., possibilities of reaction/intolerance by patients, finishing the same treatment session in the same day, and disruption/temporary discontinuation in a treatment cycle/day). In addition, our simulation is completely driven by an external spreadsheet, which is devised based on the data from Mayo Clinic, and it can be handled/utilized by medical personnel in their practice.
Finally, it should be noted that the results presented in this study are unique to our setting at MCCC, and hence, they may not be generalizable to other oncology centers without further in-depth analysis.
As future steps of this research, we aim to move towards the implementation of our results at MCCC. To this end, our ultimate goal is to develop a holistic framework with three main sections (as illustrated in Figure 8):
Choice of regimens: Machine learning algorithms will be used to predict the performance of new chemotherapy drugs (with respect to patients' outcomes such as toxicity rate, reaction rate, etc.). Determining the best regimen for each patient would also reveal the number of treatment cycles and days, which, in turn, are exclusive for each regimen. Then, we use this information as input for the next section.
Patient scheduling: We develop a mathematical model to determine the arrival schedule of patients. We then use this arrival schedule as an input for the third section.
Simulation of operations: This will be based on the simulation model that we have developed in the current study.
We note that the framework in Figure 8 will be used dynamically, in the sense that section 5 (i.e., simulation) will impact sections 3/4 in the following ways:
• Negative patient outcomes (e.g., occurrence of drug reaction or toxicity) are recorded during the simulation, and will be used as a learning mechanism for section 3 (i.e., choice of regimens).
• Throughout the simulation, type of patient streaming (e.g., whether or not to complete a treatment on the same day of provider's visit) is identified, which, in turn, affects section 4 (i.e., scheduling of patients).
Acknowledgement
This work was partially funded by the Mayo Clinic, Award #AWD00033482.