Simple Shewhart Control Charts: Are They Really So Simple?

International Journal of Industrial and Operations Research
(ISSN: 2633-8947)
Volume 4, Issue 1
Research Article
DOI: 10.35840/2633-8947/6510

Article Formats
Simple Shewhart Control Charts: Are They Really So Simple?
Table of Content
Figures
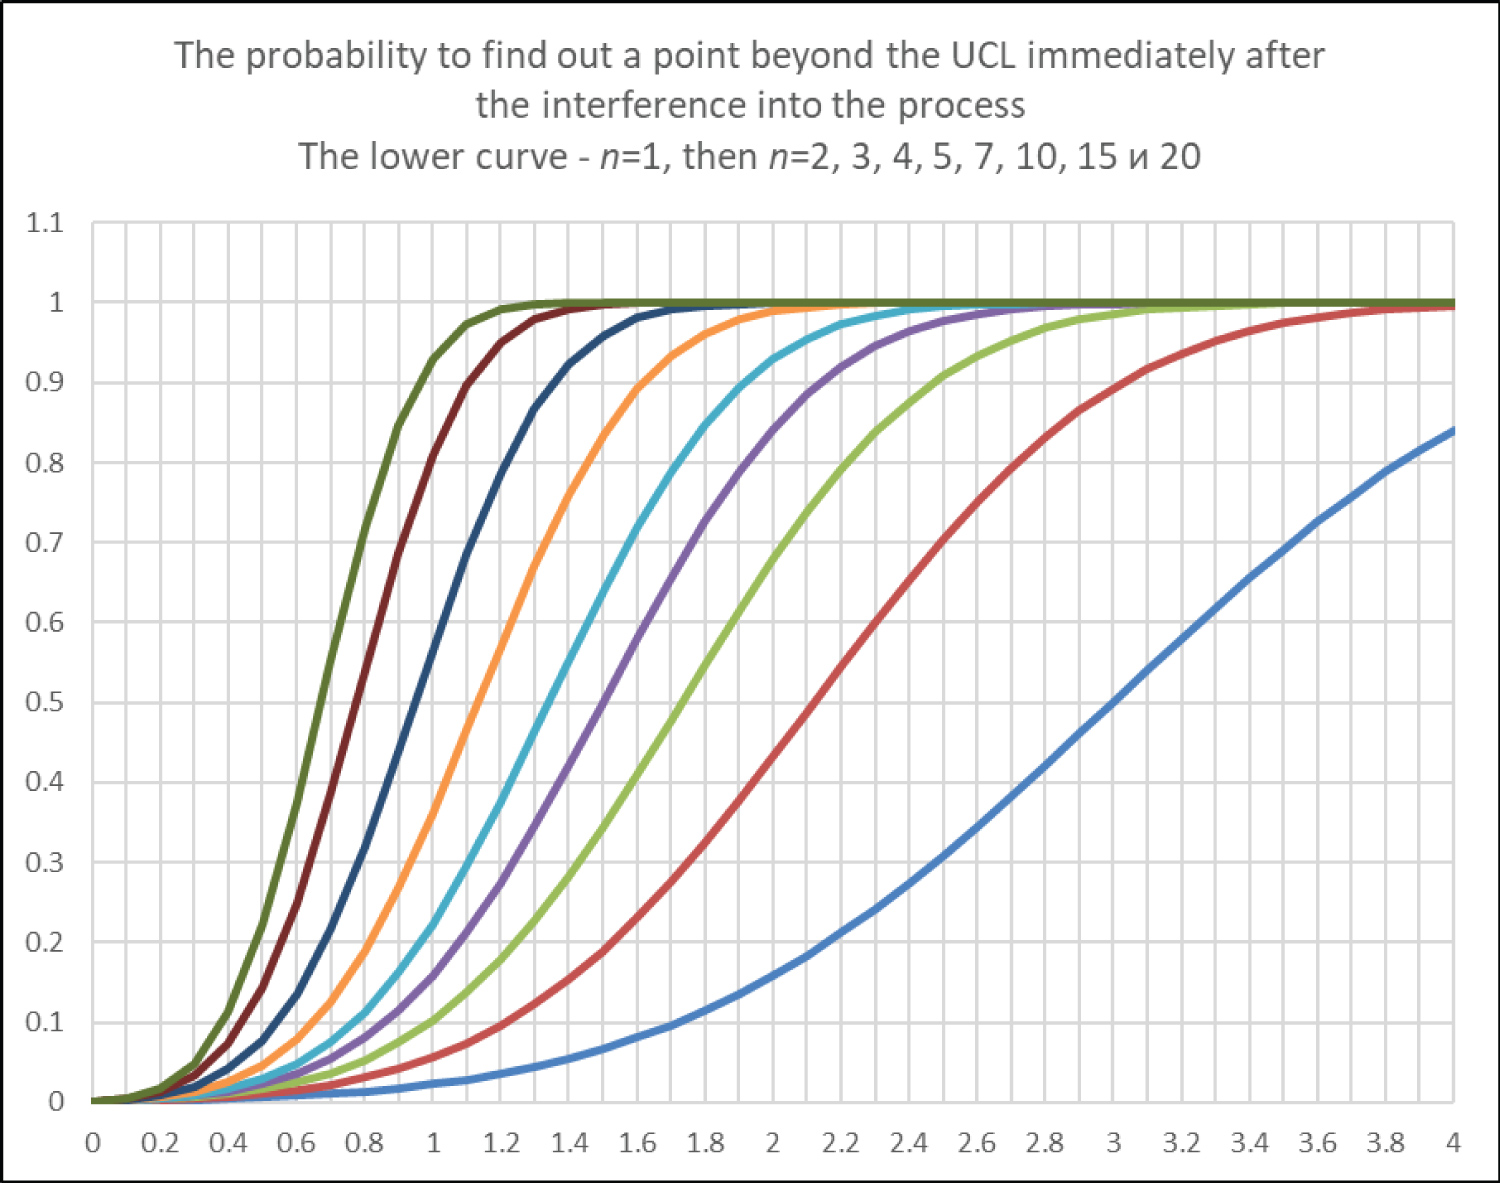
Figure 1: The dependence of PF on k values for....
The dependence of PF on k values for different n. Axis X - A value of process shift; Axis Y - The probability of a point to fall beyond the UCL.
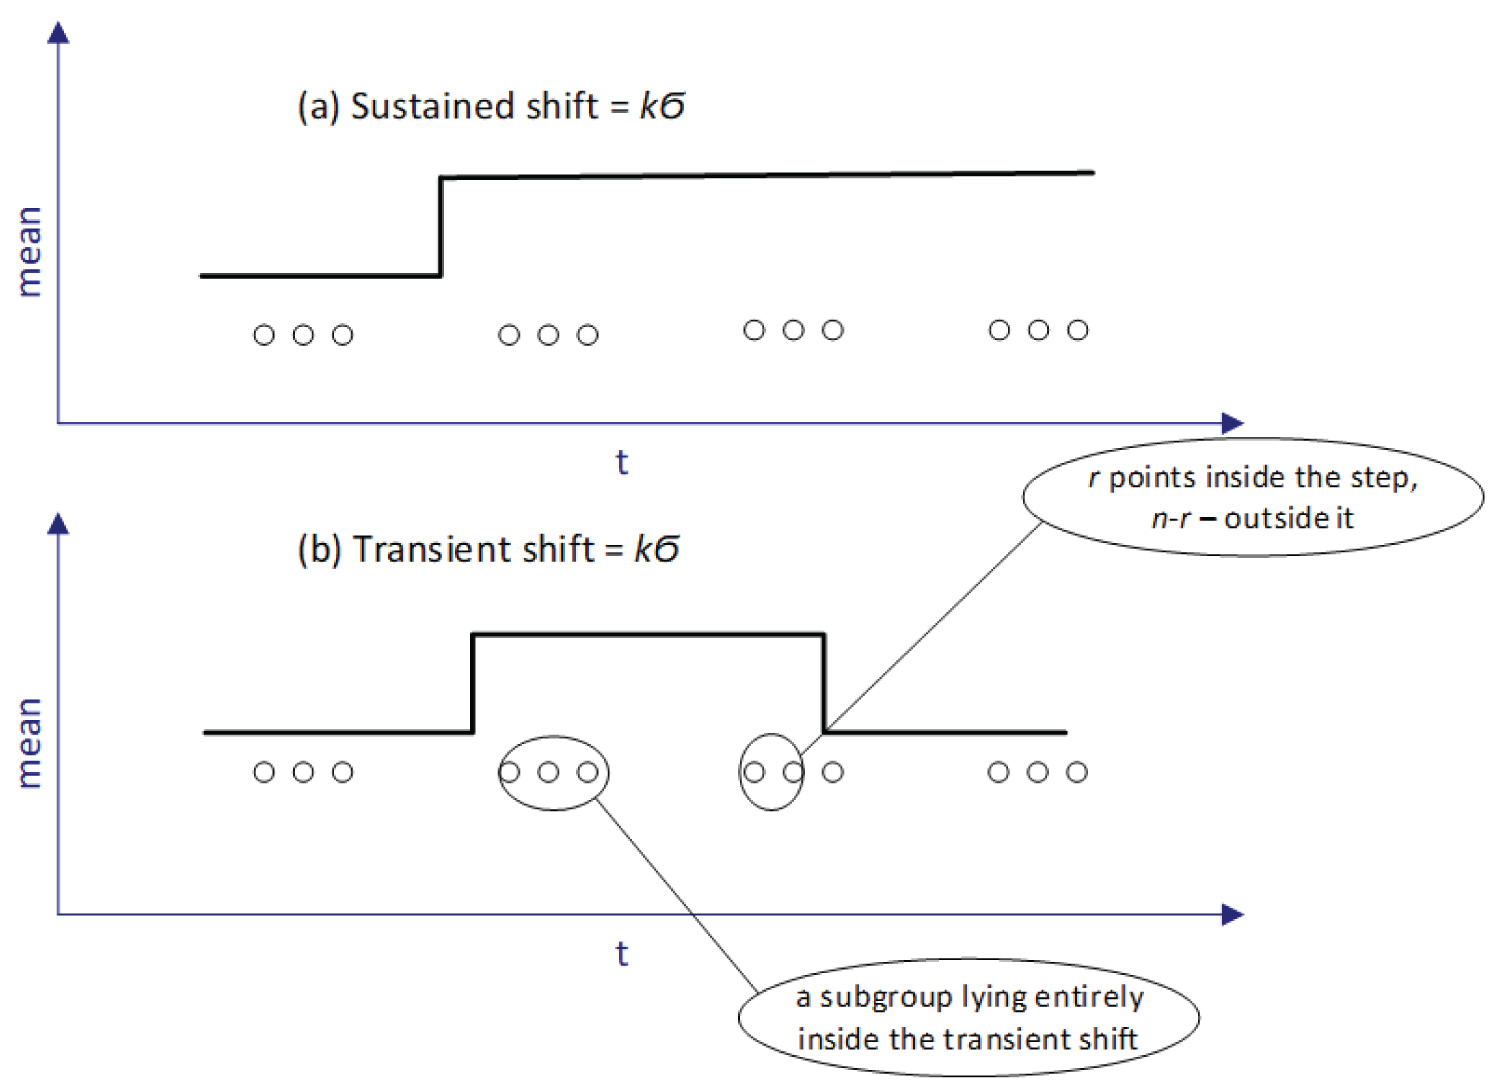
Figure 2: (a) - Sustained shift, (b) - Transient.....
(a) - Sustained shift, (b) - Transient shift, n - sample size, here n = 3 the number of subgroups lying entirely inside the step we denoted as m. Here m = 1.
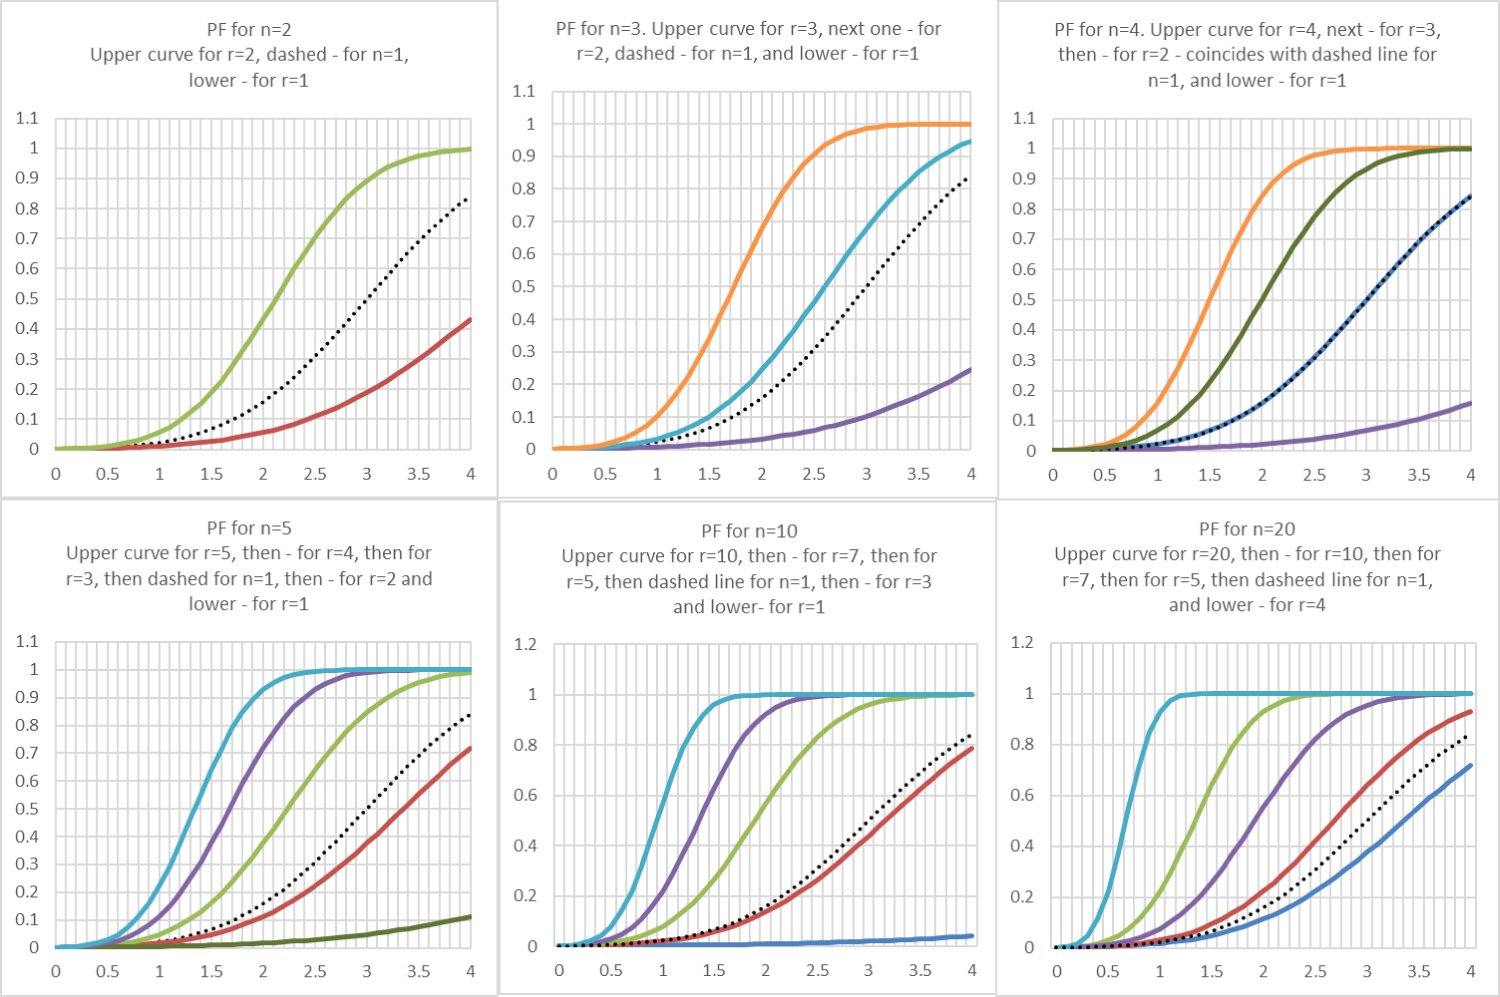
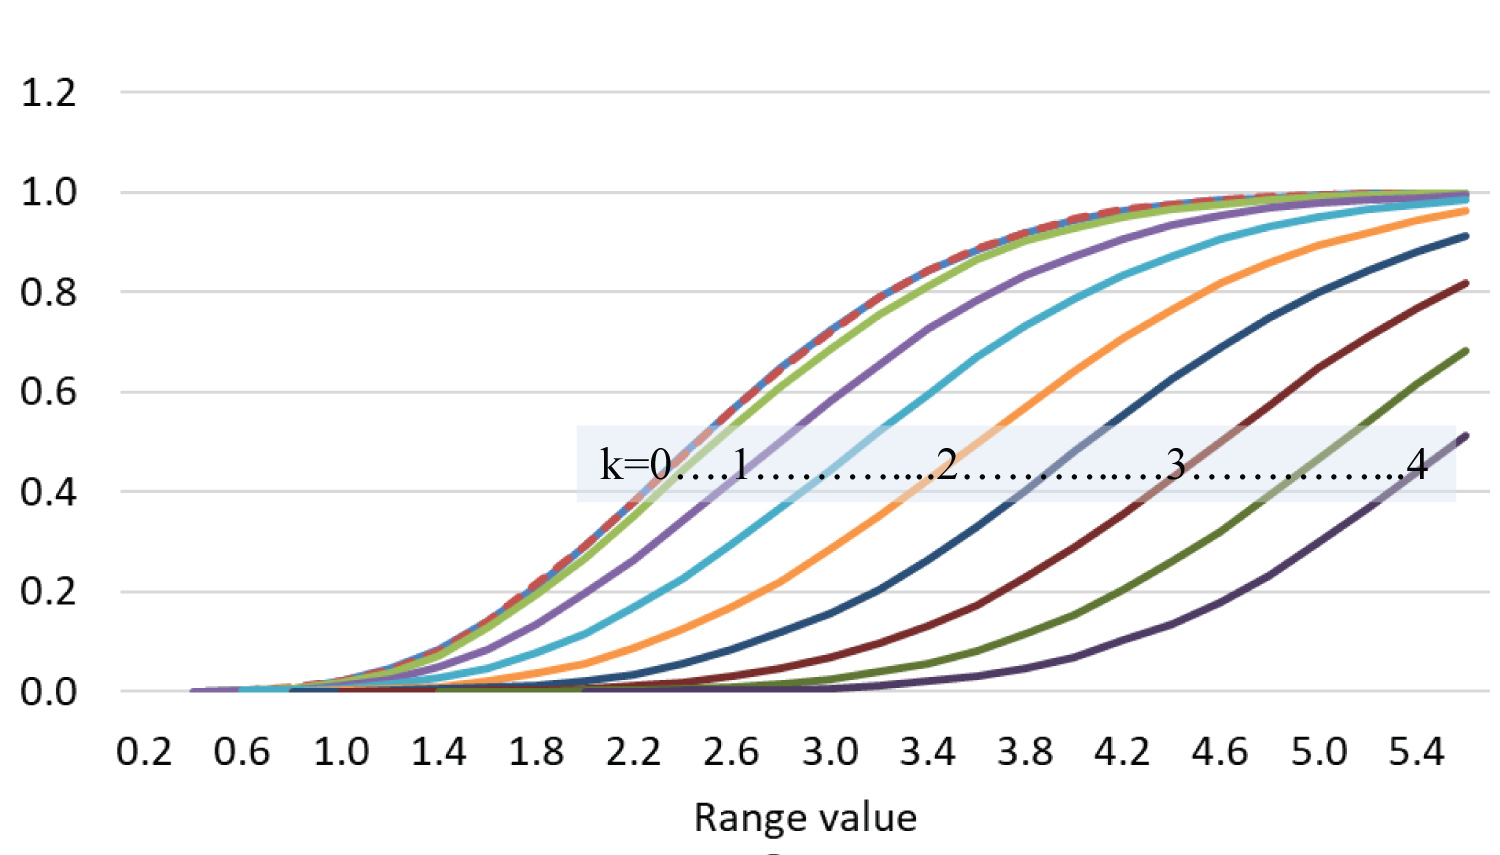
Figure 4: EDFs for ranges, n = 5, two points....
EDFs for ranges, n = 5, two points from the original DF, and 3 points from the DF with mean = kϬ = k.
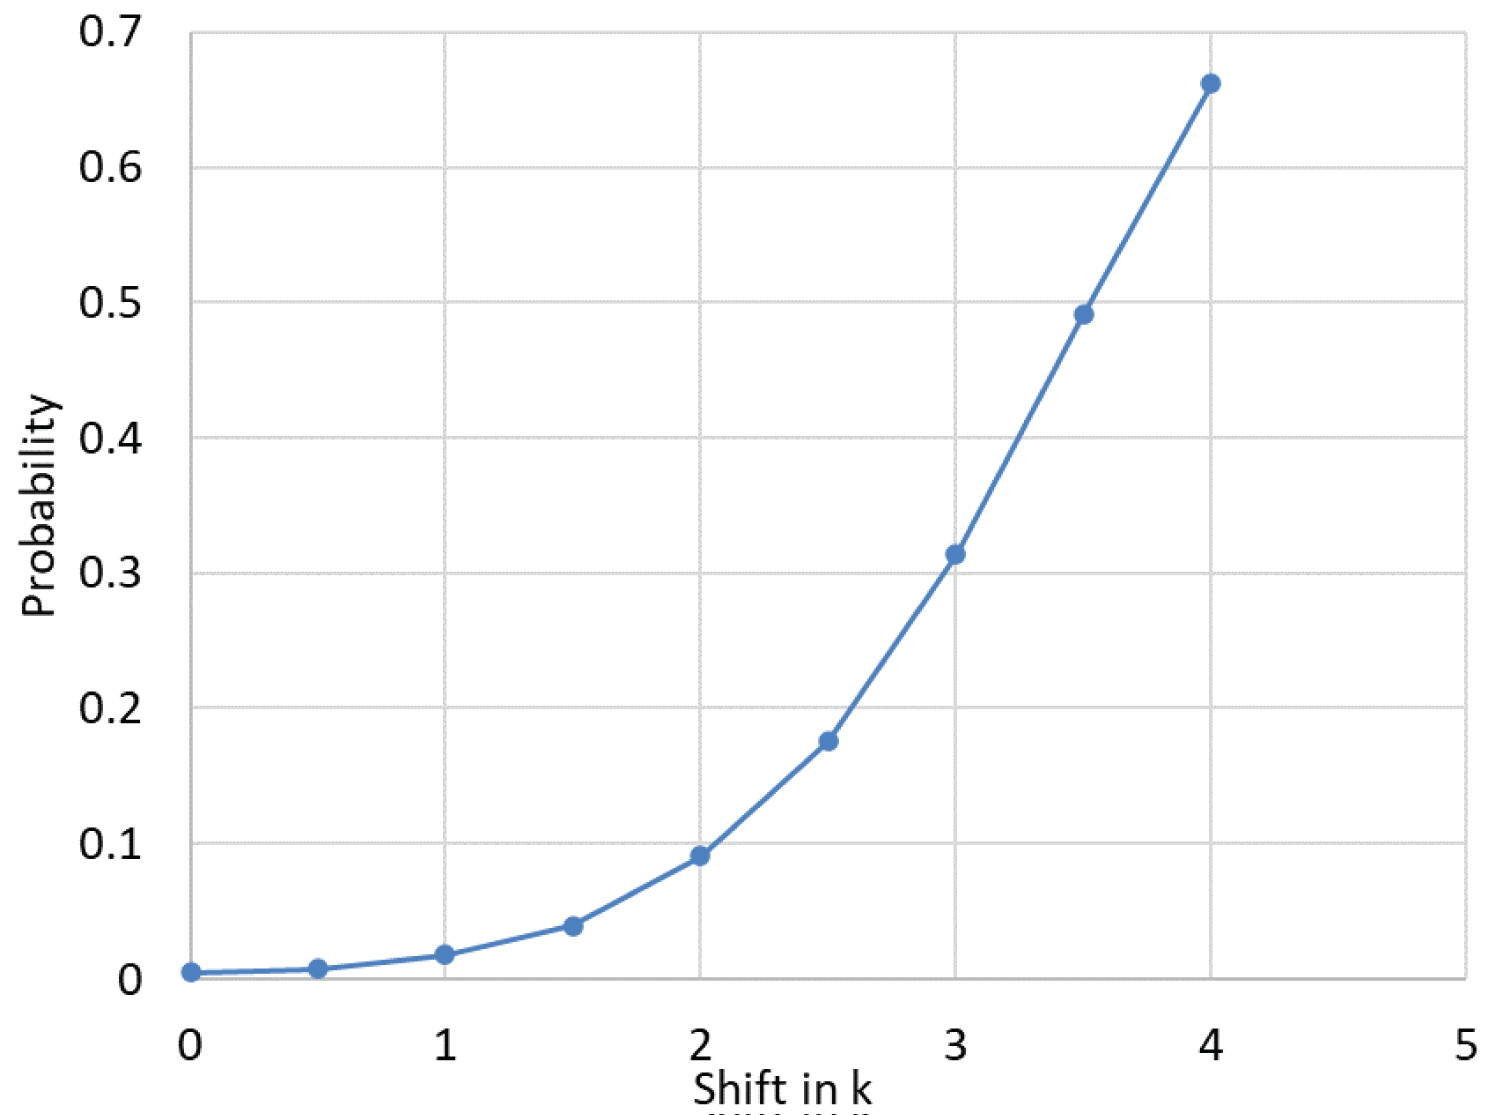
Figure 5: Probability of detecting the transient....
Probability of detecting the transient shift of mean on R-chart as the function of the shift for n = 5, r = 3.
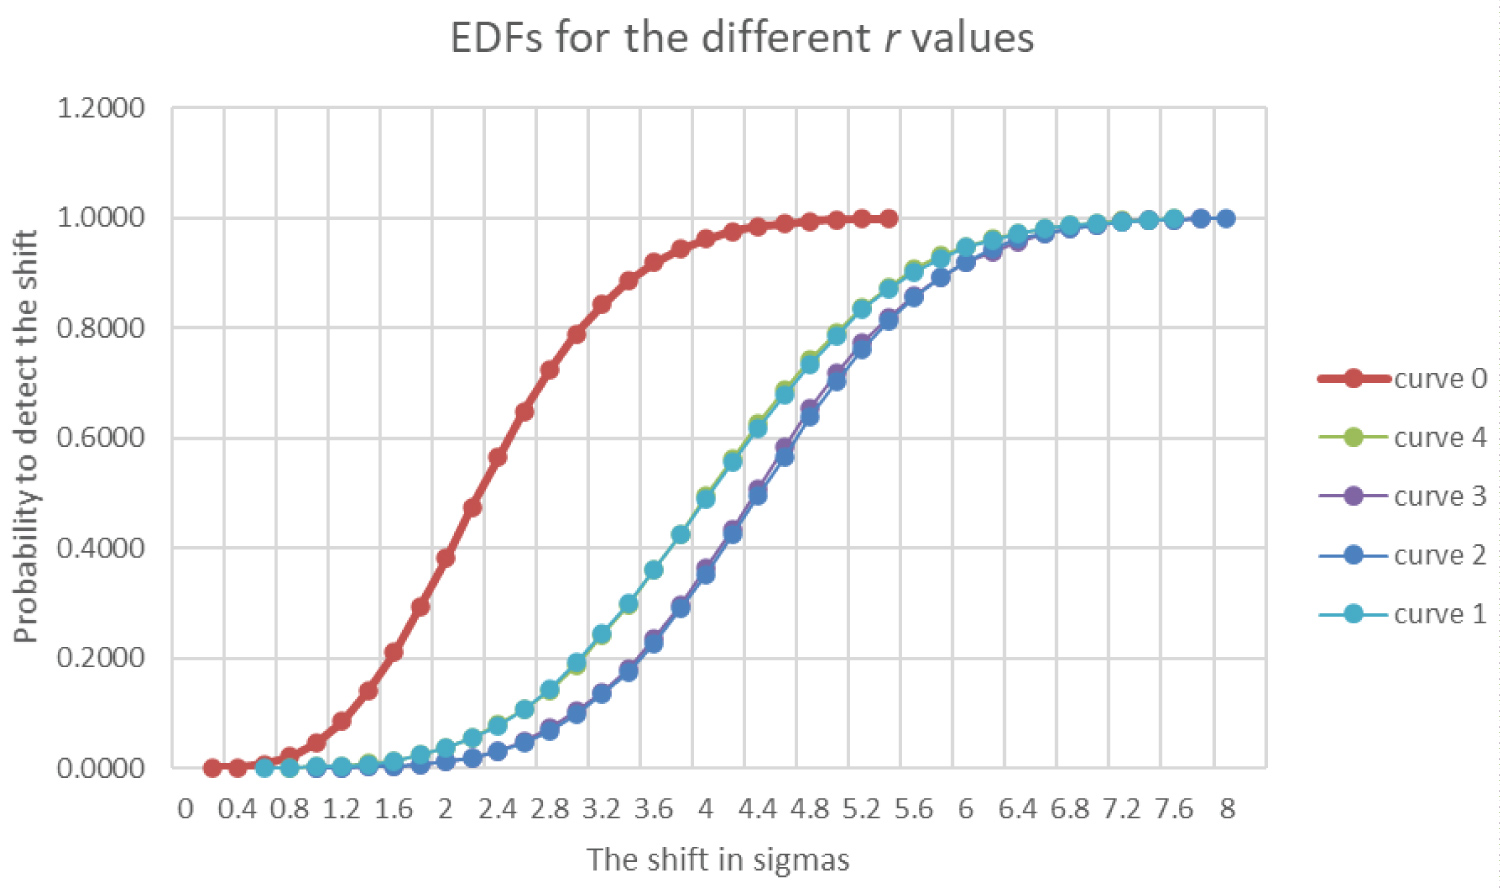
Figure 6: The EDFs for the subgroup of....
The EDFs for the subgroup of n = 5 with different values of r.
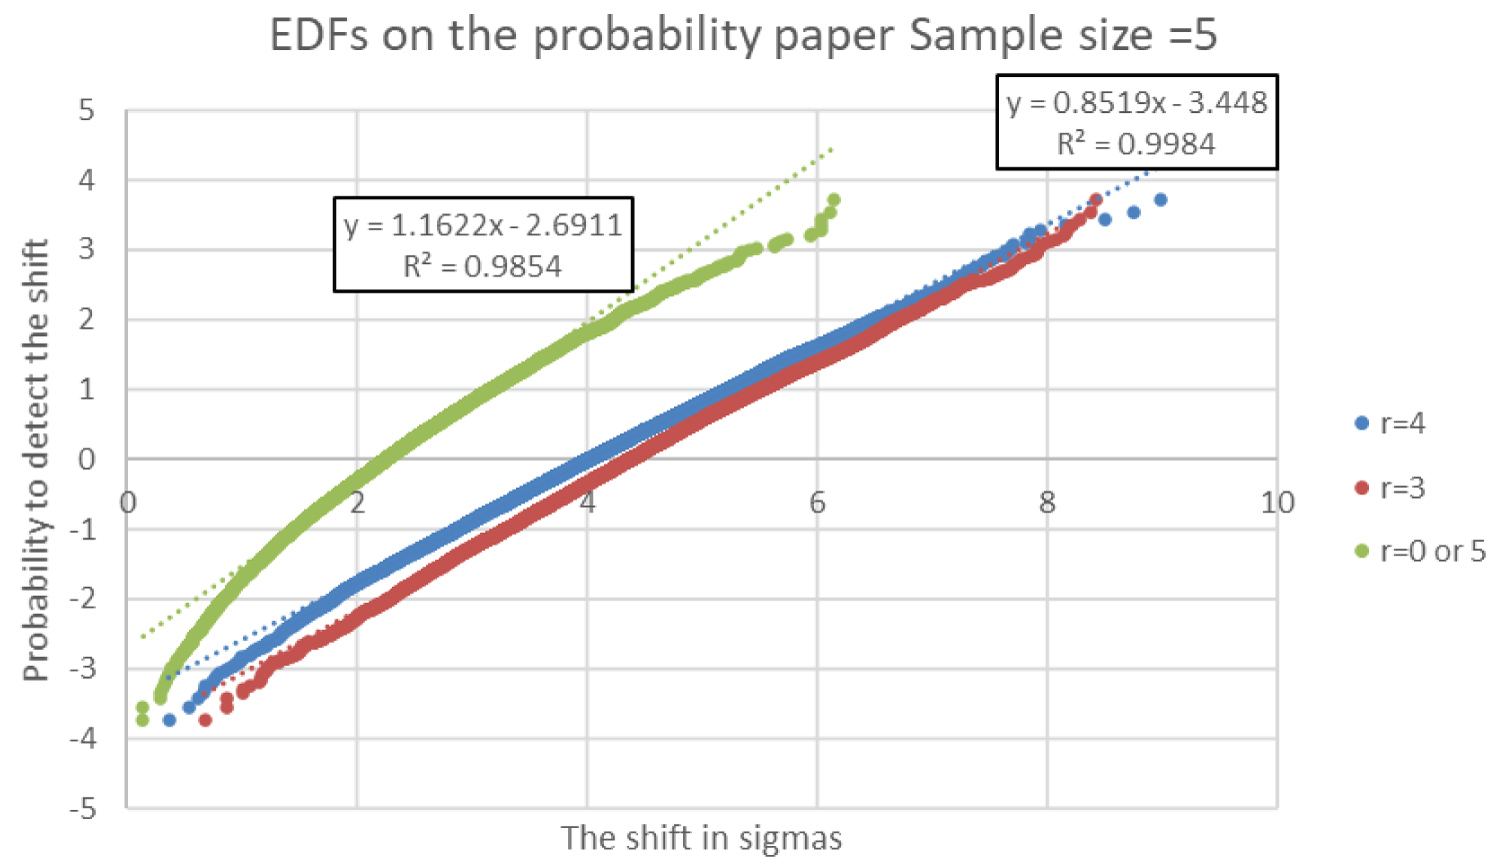
Figure 7: The same curves as in Figure 6 on the....
The same curves as in Figure 6 on the normal probability paper.
References
- Gunter B, Farewell Fusillade (1998) An unvarnished opinion on the state of the quality profession. Quality Progress.
- Woodall WH (2017) Bridging the gap between theory and practice in basic statistical process monitoring. Quality Engineering 29: 2-15.
- Schindowski E, Schürz O (1974) Statistische qualitätskontrolle. Veb Verlag Technik, Berlin.
- Murdoch J (1979) Control charts. The Macmillan Press Ltd, US.
- Grant EL, Leavenworth RS (1980) Statistical quality control. (5th edn), McGraw-Hill, NY.
- Duncan AJ (1986) Quality control and industrial statistics. (5th edn), Irwin, Homewood, IL.
- Rinne H, Mittag H-J (1993) Statistische methoden der qualitätssicherung. Fernuniversität-Gesamthochschule-in-Hagen, Deutschland, Fachbereich Wirtschaftswissenschaft.
- Wheeler DJ, Chambers DS (1992) Understanding statistical process control. (2nd edn), SPC Press, Inc.: Knoxville, 409.
- Wheeler DJ (1993) Understanding variation. The Key to Managing Chaos, SPC Press, Inc.: Knoxville, 137.
- Wheeler DJ (1995) Advanced topics in statistical process control. SPC Press, Inc.: Knoxville, 472.
- Alwan LC (2000) Statistical process analysis. Irwin/McGrow-Hill series in operations and decision sciences, 752.
- Montgomery DC (2009) Introduction to Statistical Quality Control. (6th edn), John Wiley & Sons, 736.
- Balestracci D (2009) Data sanity: A quantum leap to unprecedented results. Medical Group Management Association 306.
- (2013) ISO 7870-2. Control Charts - part 2: Shewhart Control Charts. International Standard.
- Adler Yu (2018) Algorithmically unsolved problems and artificial intelligence. Economy and Management: Problems, Solutions 7: 17-24.
- Adler Y, Maksimova O, Shper V (2011) Assignable causes of variation and statistical models: Another approach to an old topic. Quality and Reliability Engineering International 27: 623-628.
- Shewhart WA (1939) Statistical method from the viewpoint of quality control. Dover Publications, NY.
- Shper V, Adler Y (2017) The importance of time order with Shewhart control charts. Quality and Reliability Engineering International 33: 1169-1177.
- www.qualitydigest.com/inside/statistics-column/which-chart-use-120318.html
- Shewhart WA (1931) Economic control of quality of manufactured product. ASQ Quality Press, Milwaukee, WI.
- Hoyer RW, Ellis WCA (1996) Graphical exploration of SPC. Quality Progress.
- Woodall WH, Montgomery DC (1999) Research issues and ideas in statistical process control. Journal of Quality Technology 31: 376-386.
- Woodall WH (2000) Controversies and contradictions in statistical process control. Journal of Quality Technology 32: 341-350.
- Reynolds Jr MR, Stoumbos ZG (2001) Monitoring the process mean and variance using individual observations and variable sampling intervals. Journal of Quality Technology 33: 181-205.
- Jensen WA, Jones-Farmer LA, Champ CW, Woodall WH (2006) Effect of parameter estimation on control chart properties: A literature Review. Journal of Quality Technology 38: 349-364.
- Frisén M (2007) Properties and use of the Shewhart method and its follows. Sequential Analysis 26: 171-193.
- Jones-Farmer LA, Woodall WH, Steiner SH, Champ CW (2014) An overview of phase I analysis for process improvement and monitoring. Journal of Quality Technology 46: 265-280.
- Quevedo V, Vegas S, Vining G (2016) A tutorial on an iterative approach for generating Shewhart control limits. Quality Engineering 28: 305-312.
- Woodall WH, Faltin FW (2019) Rethinking control chart design and evaluation. Quality Engineering 31: 596-605.
- Hawkins DM, Olwell DH (1998) Cumulative sum charts and charting for quality improvement. Springer-Verlag, Inc.: NY, 258.
- Palm AC (1990) Tables of run length percentiles for determining the sensitivity of Shewhart control charts for averages with supplementary run rules. Journal of Quality Technology 22: 289-298.
- Reynolds MR Jr, Stoumbos ZG (2004) Control charts and the efficient allocation of resources. Technometrics 46: 200-214.
- Reynolds MR Jr, Stoumbos ZG (2004) Should observations be grouped for effective process monitoring? Journal of Quality Technology 36: 343-366.
- Reynolds MR Jr, Stoumbos ZG (2006) A new perspective on the fundamental concept of rational subgroups. In: Lenz HJ, Wilrich PT, Frontiers in Statistical Quality Control. (8th edn), Physica-Verlag HD, 172-184.
- Zwetsloot IM, Woodall WH (2021) A review of some sampling and aggregation strategies for basic statistical process monitoring. Journal of Quality Technology 53: 1-16.
- Bolshev L, Smirnov N (1983) Tables of mathematical statistics. Nauka, Moscow, 416.
- David HA (1970) Order statistics. A wiley publication in applied statistics.
- Haridy S, Ou Y, Wu Zh, Khoo MBC (2016) A single X chart outperforming the joint X & R and X & S charts for monitoring mean and variance. Quality Technology & Quantitative Management 13: 289-308.
Author Details
Shper Vladimir, PhD1* and Gracheva Anna2
1Associated Professor, National University of Science and Technology "MISiS" (NUST MISiS), Russia
2Master, NUST MISiS, Russia
Corresponding author
Shper Vladimir, PhD, Associated Professor, National University of Science and Technology "MISiS" (NUST MISiS), Russia.
Accepted: June 21, 2021 | Published Online: June 23, 2021
Citation: Vladimir S, Anna G (2021) Simple Shewhart Control Charts: Are They Really So Simple?. Int J Ind Operations Res 4:010.
Copyright: © 2021 Vladimir S, et al. This is an open-access article distributed under the terms of the Creative Commons Attribution License, which permits unrestricted use, distribution, and reproduction in any medium, provided the original author and source are credited.
Abstract
The focus of our paper is on such basic control charting methods as the X-bar chart, the R-chart and the chart for individual values (the x-chart). They have long ago been known and described in all guides and handbooks devoted to Shewhart control charts (ShCC). But the application of these tools in practice encounters often on the lack of knowledge of some underlying assumptions which ShCC' performance is based on. For example, many books on Statistical Process Control (SPC) claim that the efficiency of the X-bar chart to detect the shift of the process mean exceeds the efficiency of x-chart significantly and grows when the sample size n increases. This is true but only for the so-called sustained shift. What will happen if the shift is not sustained but transient - most of the practitioners simply don't know because this issue was rarely discussed in the literature and has not been investigated adequately. Just this is a goal of our work: We investigated the impact of the transient shift on the X-bar chart behavior and found that in this case the probability of detecting a shift depends on the amount of points falling into the shifted part of the subgroup. As a result the X-bar chart may become less sensitive than the chart for the individuals. Besides, we found that the range chart becomes sensitive to the mean shift.
Keywords
Shewhart control charts, Transient shift, Chart efficiency comparison
Introduction
There is a widely spread opinion of many experts in SPC that ShCC are a very simple tool used to determine if a process is in a stable state or not. More than twenty years ago Bert Gunter called "control charts" to be archaic, simplistic and honored but ancient tool [1]. Recently William Woodall called X-bar and R-chart to be "the simplest monitoring methods" [2]. The basis for such opinion is clear: such charts as Xbar-R, Xbar-S, x-mR, p-chart, etc., are well-known for many decades and described in many guides, handbooks, standards, etc. [3-14] (to name a few). Nevertheless, we are sure that ShCC are very simple technically and not so simple for their application in practice at all. The thing is that the right use of ShCC requires more than mere knowledge how to construct a chart. A practitioner has to understand what assumptions her/his chart is based on and if these assumptions are applicable to the process under consideration. In other words: The reasonable and useful application of ShCC can't be totally algorithmized [15]. The right use of ShCC requires the participation of a Man knowing "everything"a about the process. The three main steps that principally can't be formalized are: (1) The choice of the type of ShCC; (2) The choice of the Phase I duration; (3) The choice of the subgroup size and the frequency of their taking out if one decided to use a chart based on rational subgrouping. Unfortunately, most of the practitioners rarely know about numerous assumptions and restrictions of ShCC. For example, many results of the theory of ShCC are based on the implicit assumption that the assignable cause of variation changes the mean or variance or both of the original distribution of process' parameters but don't change the type of the distribution function (DF) itself. In the work [16] it was demonstrated that the rejection from this assumption radically changes the shape of power function (probability to detect a shift in the process). Another example: most conclusions about comparative efficiency of different types of charts are based on the assumption of total randomness of all process points. This problem was discussed carefully by W. Shewhart in his 1939 book [17] and was raised in the paper [18] where the authors tried to attract the attention of statistical community to the problem of nonrandomness of many real processes. We mention these examples in order to outline a simple thought: real processes do not need to follow any assumptions. That is why we have to analyze all possible rejections from traditional approaches. This paper is devoted to the consequences of rejecting from another rarely discussed assumption of established or sustained shift. Many guides and textbooks while discussing the properties of X-bar charts tell practitioners about "... advantage of the increased sensitivity that comes with larger subgroup sizes" [12,19]. Such effect does exist but only for the sustained shift. Our paper is organized as follows. At first some basic concepts of comparing efficiencies of different types of charts are discussed. Then the previous results about transient shifts are reviewed and the suggested model and its follow-ups are considered. Conclusions are given in the final section of the paper.
a. We mean "everything" in that sense that she/he knows all details of factual process flow. In quality management systems such person is often called the process owner.Control chart efficiency comparison
There is an extensive literature on the different aspects of the theory of ShCC nowadays. In addition to original books of Walter Shewhart [17,20] and very popular books of L. Alwan [11], D. Montgomery [12], D. Wheeler [8-10], D. Balestracci [13] a practitioner may obtain a huge amount of information from the excellent surveys and research papers that regularly are being published in such journals as Technometrics, Quality Engineering, Journal of Quality Technology, Quality and Reliability Engineering International [21-29] and many others (our list is by no means complete). Many efforts are focused on the study of the statistical performance of charts and on the creating new types of charts or new methods of their analysis. But here we intend to return to the basics because the above-mentioned assertions about the better efficiency of X-bar chart due to bigger sample size are being repeated from the books of 70th-80th and up to now [3-7,10,12,19]. We don't touch such problems as the difference between phase I and phase II, the influence of the estimate errors on the performance of charts, the influence of non-normality and autocorrelation on chart behavior, and so on. All these topics are very important, but they are only additions and improvements to the basic properties of ShCC derived many years ago. Originally, the comparison between X-bar charts with different sample sizes was being made by using the notion of the average run length or the probability of detecting (or not detecting) the process shift [3-7,10,12]. These approaches are equivalent and following Wheeler's book [10] we shall use the power functions (PF) - the theoretical probability to detect a point beyond the chart limits immediately after the shift. As we are interested in basic features of the charts the probabilities will be calculated as if the data were taken from normal distribution and we knew the true value of the process mean (μ0) and process standard deviation (Ϭ). Surely, the true values are never known in practice but this facet of reality has no importance for our analysis (this is a common approach to such comparison -see, e.g., [3,10,12]).
For X-bar chart the probability of a point to be within the k-sigma limits (β) equals [12]
Where φ denotes the standard normal cumulative distribution, UCL and LCL - upper and lower control limits, correspondingly,
µ0 - mean value for the original process,
σ - standard deviation (SD) of the original process,
n - the subgroup size,
k - a multiplier, which defines the value of the mean's shift (measured in σ).
Because and , where L = 3 for standard 3-sigma limits, one can easily obtain from (1) (coincides with (6.19) in [12]):
Below we'll consider the probability of a point to fall outside the upper control limit under the assumption that the shift was in the same direction. So we'll omit the second member in (2) and will go to the PF - the probability of a point to be above the UCL:
By using (3) one can easily calculate the dependence of the probability to detect the mean shift on the value of k. These curves are shown in Figure 1. They are the source of traditional conclusion about the efficiency of different types of charts. In fact, the probability to detect the shift of the mean of one SD (k = 1) for individual chart (n = 1) is equal approximately to a quarter of one cell on Figure 1, i.e., about 0.025 (the exact value = 0.023), while for n = 10 this probability is growing up to about 0.55 (the exact value = 0.56), and for n = 20 it is 0.93.
But all these calculations imply that the shift of a process was sustained.
The necessity of this assumption is closely related to the notion of rational subgrouping. The gist of rational subgrouping is quite simple. One over a short period selects a sample from the process - a subgroup and using this subgroup data gets information (the values of mean, variance, etc.) about the current state of the process. The shortness of the time interval give her/him the sound base to hope that the system where the process is running will not change during the time of data collection. Then - after much longer time - she/he selects another subgroup from the same process, then another one, etc. As a result one gets an opportunity to compare the instant values of key process parameter (e.g., variance within a subgroup) with their values during much longer period of time (e.g., variance between subgroups). If these values differ insignificantly then one has a good reason to claim that the process is stable. This deep Shewhart's idea [17,20] is the basis for X-bar charts since their appearance in the middle of 20th century. However, as the ShCCs were spreading around the World the principal importance of time shortness for extracting a subgroup was lost by many practitioners - we saw many cases in practice when a subgroup was selected, e.g., hourly, or during a shift, a day, or even a month. Does anyone have a solid ground to hope that in such cases nothing interfered into the process while the subgroup was being taken out? Of course, not. It is worth noting that Dr. Deming wrote in his Foreword to the reprint of Shewhart 1939 book: "The great contribution of control charts is to separate variation by rational methods into two sources: (1) The system itself ("chance causes" Dr. Shewhart called them), the responsibility of management; and (2) Assignable causes, called by Deming "special causes", specific to some ephemeral event ..." [17]. An adjective "ephemeral" means "lasting a very short time; short-lived; transitory" (see Webster's Encyclopedic Unabridged Dictionary). The general scheme of sustained and transient shift is shown in Figure 2.
The necessity to differentiate between sustained and transient cases was recognized long ago by many authors. For example, D. Hawkins and D. Olwell in their book [30] wrote:" It is helpful to recognize two distinct types of special cause variability. One is transient... and may affect the process for a short while, then disappear only to reappear at some future time... The other type of special cause is one whose effects persist until the problem is detected and diagnosed". Moreover, many authors while explaining the X-bar chart performance made the remark that the shift occurs between subgroups on a chart for averages (see Figure 2a). This is important because "...a shift in the means alone between subgroups should not affect the subgroup ranges. The more general case where the shift does not necessarily occur between subgroups is more complex and has not been investigated" [31]. Montgomery made a hint on this circumstance: "If a shift does occur while a sample is taken, the sample average can obscure this effect" (see [12] p. 239). Nevertheless, the number of works where the impact of transient shift on the behavior of ShCC has been investigated is very little. Most of such works deal with CUSUM and EWMA charts or with the change-point charts. The exception is a cycle of works by Reynolds, Stoumbos [32-34]. These authors investigated the comparative efficiency of ShCC as well as CUSUM and EWMA charts for sustained and transient shifts and for condensed and dispersed samples. But in order to have an opportunity to compare all these types of charts the authors used the specific condition "when all of the charts have the same false alarm rate and the same sampling rate" [33, p.348]. They name this condition "fair". We think that it is fair only from the viewpoint of statistical calculations. It is unfair from the viewpoint of a practitioner because they compare, for example, the performance of the X-bar chart with 3-sigma limits and the performance of the chart for individuals with 3.205-sigma limits. This makes questionable their conclusions for traditional application of ShCC with 3-sigma limits used by all practitioners. On the other hand, the traditional approach used in our paper does not take into account that charts with different sample sizes require different resources for their accumulation. Such considerations justify the technique of Reynolds, Stoumbos [32,34], but we prefer more simple and more intuitively clear traditional way of comparison from [3,10,12]. The most recent work where the authors discussed the issues of transient shift is the paper of I. Zwetsloot and W. Woodall in JQT [35]. One of the conclusions of that work coincides with ours assertions: "4. Almost all of the work thus far is under the assumption of sustained shifts in the process. The possibly substantial effect of data aggregation on the detection of transient shifts has been studied only by Reynolds and Stoumbos". We presented our considerations about these works above.
The Model and some results
Let us consider the case when the transient shift starts between subgroups and ends after m shifted subgroups within the (m + 1)th. That is, we will assume that the X-bar chart with subgroups of size n is being constructed and an assignable cause of variation emerges between subgroups and lasts so that it covers m subgroups totally and r points within the last (m + 1)th. In this case one obtains for the average:
Obviously, the bias of the average will be approaching the sustained value when , and the impact of the transient shift will be maximal for m = 0. In this case one has for the average:
Obviously, the shift of the average will decrease and therefore the probability to detect it will decrease as well. The value of SD is constant (at least at the first approximation) and is equal to . So one can obtain:
As usual, we use the assumptions of data normality and the property of being i.i.d. (identically independently distributed). The results of calculations on the base of (6) for different values of n and r are shown in Figure 3. Looking at Figure 3 one can make the following conclusions:
As one could expect before, when r is equal to n the PF coincides with the traditional one in Figure 1.
As soon as not all the subgroup's points fall into the changed process the PF starts to decrease, and for some value of r - we named this value boundary, rb - the PF becomes less than the corresponding PF for n = 1 (the PF of the chart for the individual values). It is quite easy to find out the value of rb for which the PF of X-bar chart becomes less than the PF of the chart for individuals:
It means that the traditional arguments about better performance of the chart for averages in comparison with the chart for individuals in case of transient shift do not matter. All depends on the amount of points falling into the changed part of the subgroup. This conclusion shows that even for the simplest ShCC everything is not so simple as it seems to be. And even for the values of r > rb the resulting values of probability to signal about the shift may be essentially lower than it is traditionally mentioned in SPC textbooks. For example, for X-bar chart with n = 10 the probability to detect the mean's shift of one sigma falls down from 0.564 when the shift is sustained to 0.078 when only 5 points are within the changed process and 5 points belong to the unchanged process.
Another interesting result was obtained from the analysis of the impact of a transient shift on the range chart. It is obvious that for a sustained shift variance is constant and R-chart has the central line going horizontally, that is R-chart is insensitive to the mean's shift. But, for a transient shift variance within a subgroup will increase so the R-chart has to become sensitive to a mean shift. In order to check this consideration we simulated 10000 subgroups of size 5 where two points were from standard normal distribution with mean = 0 and Ϭ = 1, and three points were from normal distribution with mean = kϬ, Ϭ = 1, k = 0.0, 0.5, 1.0, 1.5, 2.0, 2.5, 3.0, 3.5, 4.0, 4.5. For each k we got 10000 values of range, which let us to construct an Empirical Distribution Function (EDF). The EDFs give one a possibility to estimate the probability of falling beyond the Upper Control Limit for R-chart (UCLR). In case of the standard normal distribution the UCLR is equal to 4.917 (D4*d2) and after finding out the corresponding value of probability on the EDF one can get the probability of our interestb. In Figure 4 one can see the EDFs for different values of k. Naturally the curve for k = 0 coincides with the exact values of DF for ranges from [36]. Figure 5 shows the dependence of the probability to exceed UCLR on the k values for this specific combination of n and r. It is interesting that for large shifts the R-chart becomes very sensitive to the shift of the process mean. For example, for the shift equal to 3 the probability to detect the shift of the mean on the range chart will be bigger than 30%.
b. Surely this is rather rough estimate but we were interested not in the exact probabilities bit in the existence of the effect itself.It is worth noting that different combinations of n and r influence the probabilities of detecting the transient shift but this influence is much lesser than the impact from the shift itself. This is obvious from Figure 6 where one can see the EDFs for the subgroup of n = 5 and r = 0 (curve 0), r = 1 (curve 1), r = 2 (curve 2), r = 3 (curve 3) and r = 4 (curve 4). The curves for r = 1 and 4 coincide with each other; the same occurs for the curves with r = 2 and 3. Additionally we constructed these EDFs for transient shift on the normal probability paper - see Figure 7. It is interesting that EDFs for mixed subgroups seem to be much closer to the straight lines than the EDFs for subgroups with r = 0 or r = 5. The fact that the DF for range is not normal has long since been known [37] but a transient shift obviously decreases the deviation of the DFs from normality.
Conclusions and Some Thoughts
The ShCCs are being used in all areas of human activity today because there is no quality without them. So in this part the words of Kaoru Ishikawa in the epigraph are being realized in life. But his last sentence which - we think - may be transformed into:
Useful application of control charts starts and ends with education are still waiting for its more deep realization. It encounters many problems and one of them is the inadequate education in the area of the ShCCs. We tried to discuss here one of the causes of such situation: insufficient knowledge of many assumptions by practitioners and not enough explanation of these restrictions in SPC literature. In order to overcome these problem statisticians should apply additional efforts for more clear explanations of all assumptions lying in the foundation of all types of the ShCCs. We are sure that a shortage of such information in many textbooks and guides on SPC hinders the useful applications of charts by practitioner.
As a special case it was shown that the chart for averages loses its advantages in front of the chart for individuals when the process shift is not sustained but transient one. It turned out that the starts working worse than the chart for individual values when the number of points from the shifted process becomes less than a square root of sample size. In the paper by Haridy, Ou, Wu and Khoo [38] in the abstract it is written "The comparative study led to surprising results that contradict the conventional wisdom in Statistical Process Control (SPC) niche. It is found that the simplest single X chart (i.e., the X chart with a sample size n) is always the optimal version of the X chart for detecting" shift of the mean and SD. We think that such an abstract is an example of the above-mentioned problem of difficulties for practitioners. The thing is that the authors do not mention in the abstract the conditions which their conclusions are based on. They used the loss function approach to compare chart efficiency so their results have no relation to the traditional comparison. So their abstract creates much more general conclusion than it is in reality. However, combining their result with ours it seems that simple x-chart may turn out to be much more useful in practice than it is considered usually.
Besides, it was found that under conditions of the transient change in the mean the R-chart becomes sensitive to the shift of the process location. Moreover, from Figure 6 and Figure 7 one can see that the average value of range for mixed samples increased from the standard value 2,326 (this is a well-known coefficient d2 - see, e.g., [8,10,12]) to the values close to 4. This is an interesting result which needs to be discussed in another paper.
We are sure that simple ShCCs while being applied to real processes are both a statistical tool and a tool for the growth of process knowledge. The latter is not elucidated enough in most of the textbooks and guides on SPC. That's why we think that handbooks, guides and other teaching materials must pay much more attention to the limits and restrictions of the conclusions they give to practitioners. Besides, we think that mentioning all the assumptions (explicit and implicit) in the section "Conclusions" in our favorite and respectable journals would be very useful for practitioners.
We hope that the results obtained and mentioned here may be useful for stimulating more research in the area of "simple" SPC tools because the diversity of real processes is unlimited and reasonable application of the ShCCs must be established for the cases that cannot be fit to the Procrustean bed of traditional approach.