
International Journal of Magnetics and Electromagnetism
(ISSN: 2631-5068)
Volume 2, Issue 2
Research Article
DOI: 10.35840/2631-5068/6506

Article Formats
Diagnosis of Insulation Materials with Terahertz Wave
Table of Content
Figures
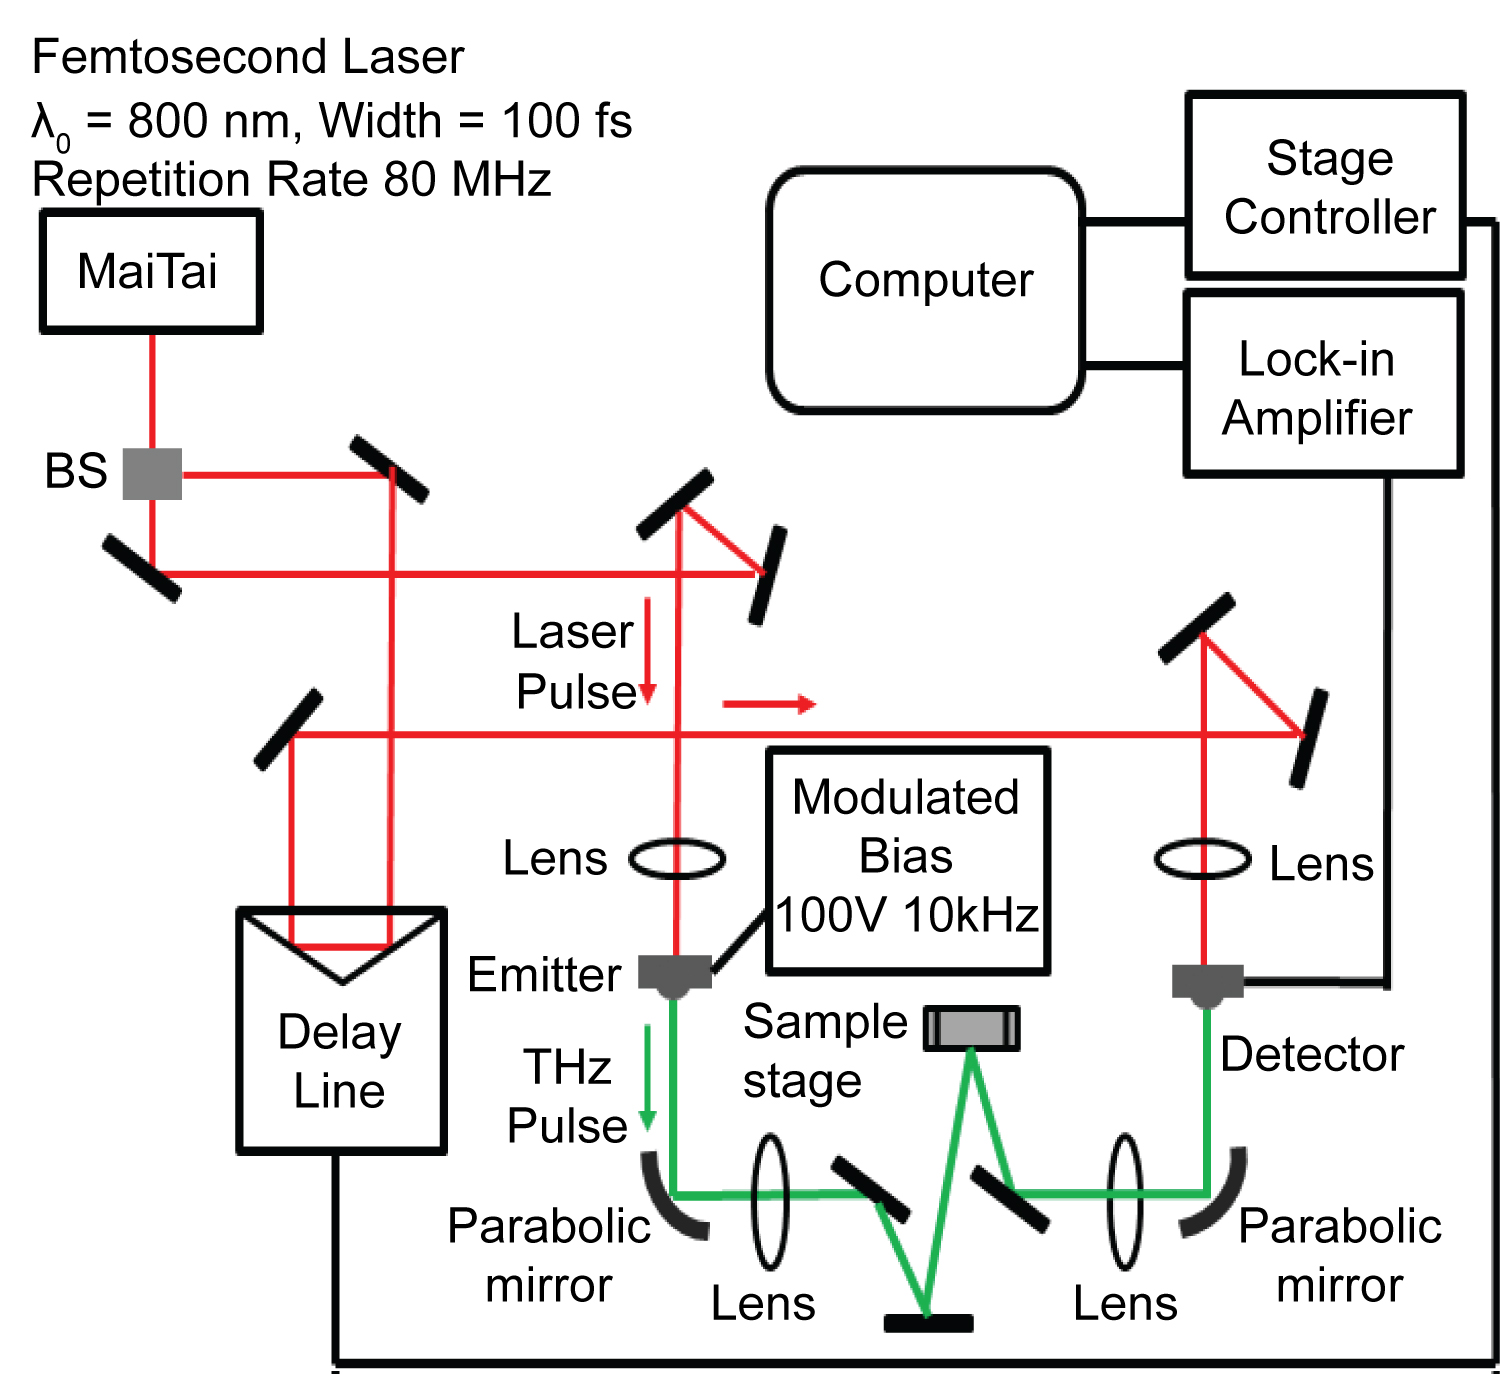
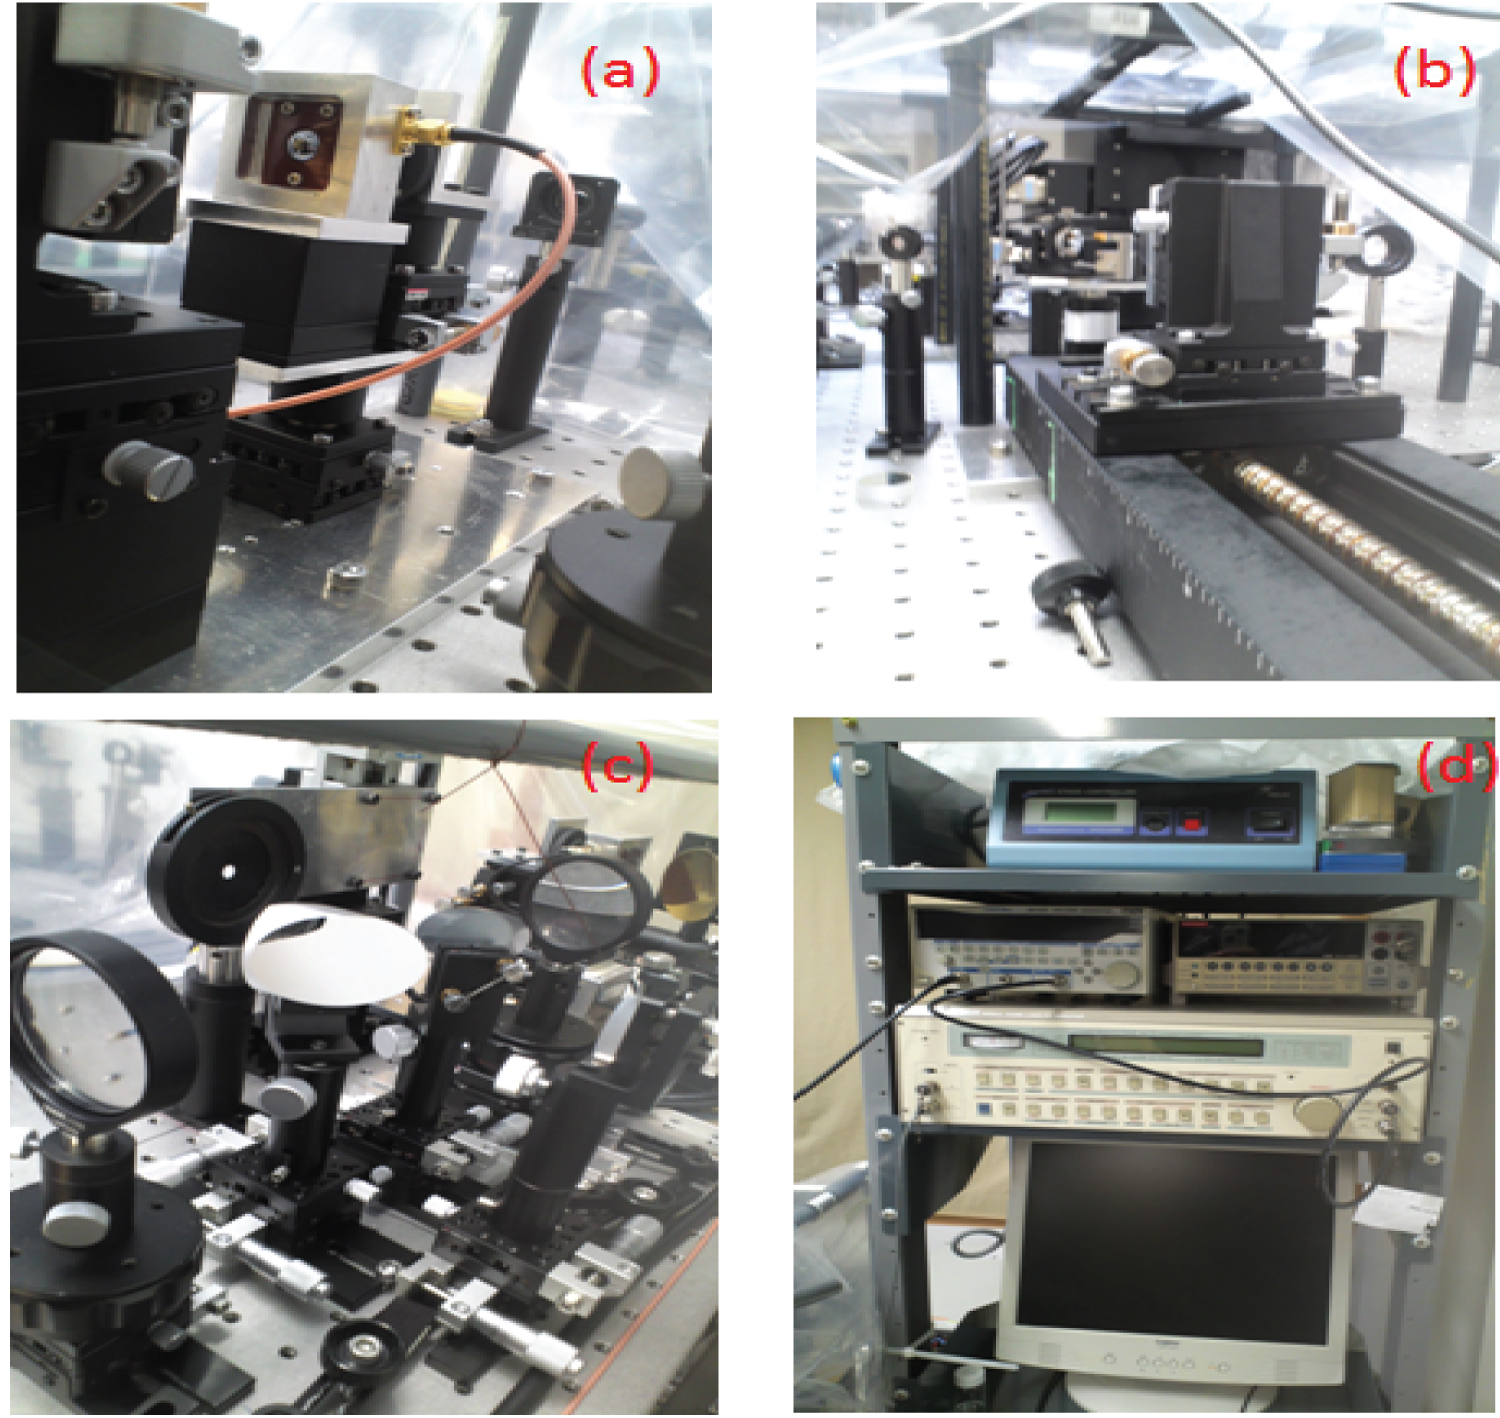
Figure 2: Photograph of setup...
Photograph of setup. a) THz emitter; b) delay line; c) optics system; d) control system.
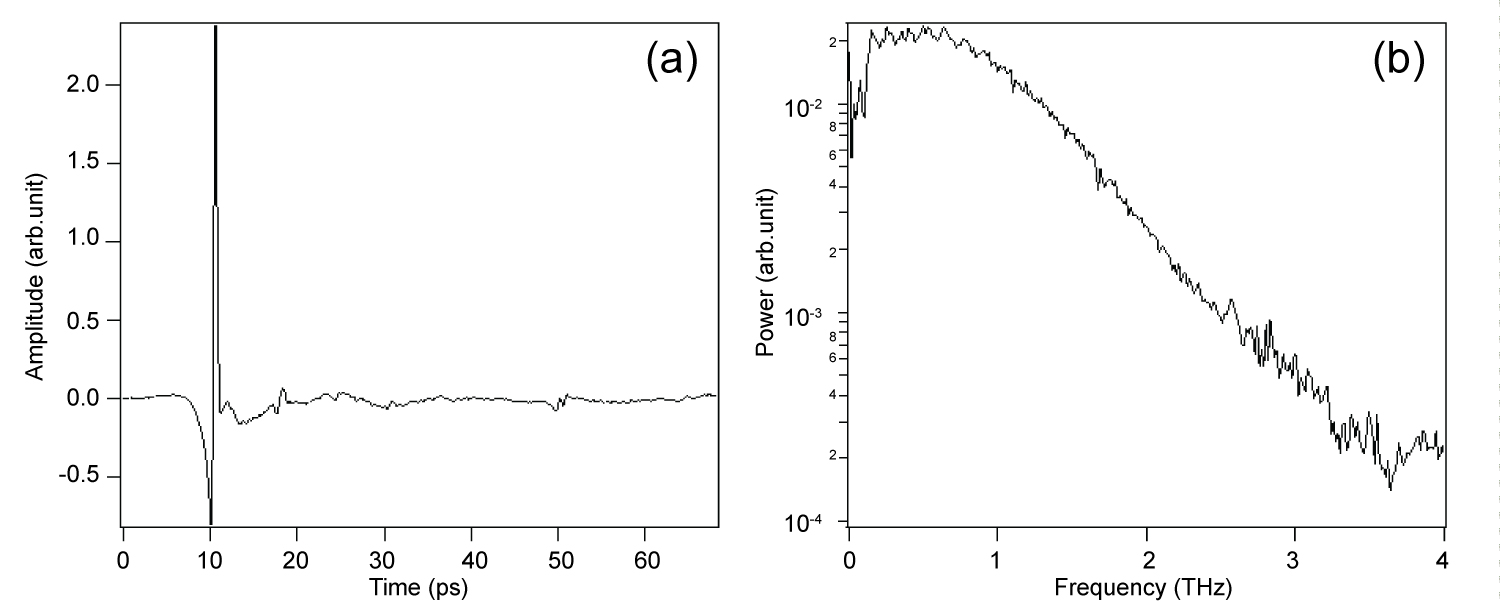
Figure 3: Observed. a) time wave...
Observed. a) time wave form; b) spectrum of reference mirror in the dry air.
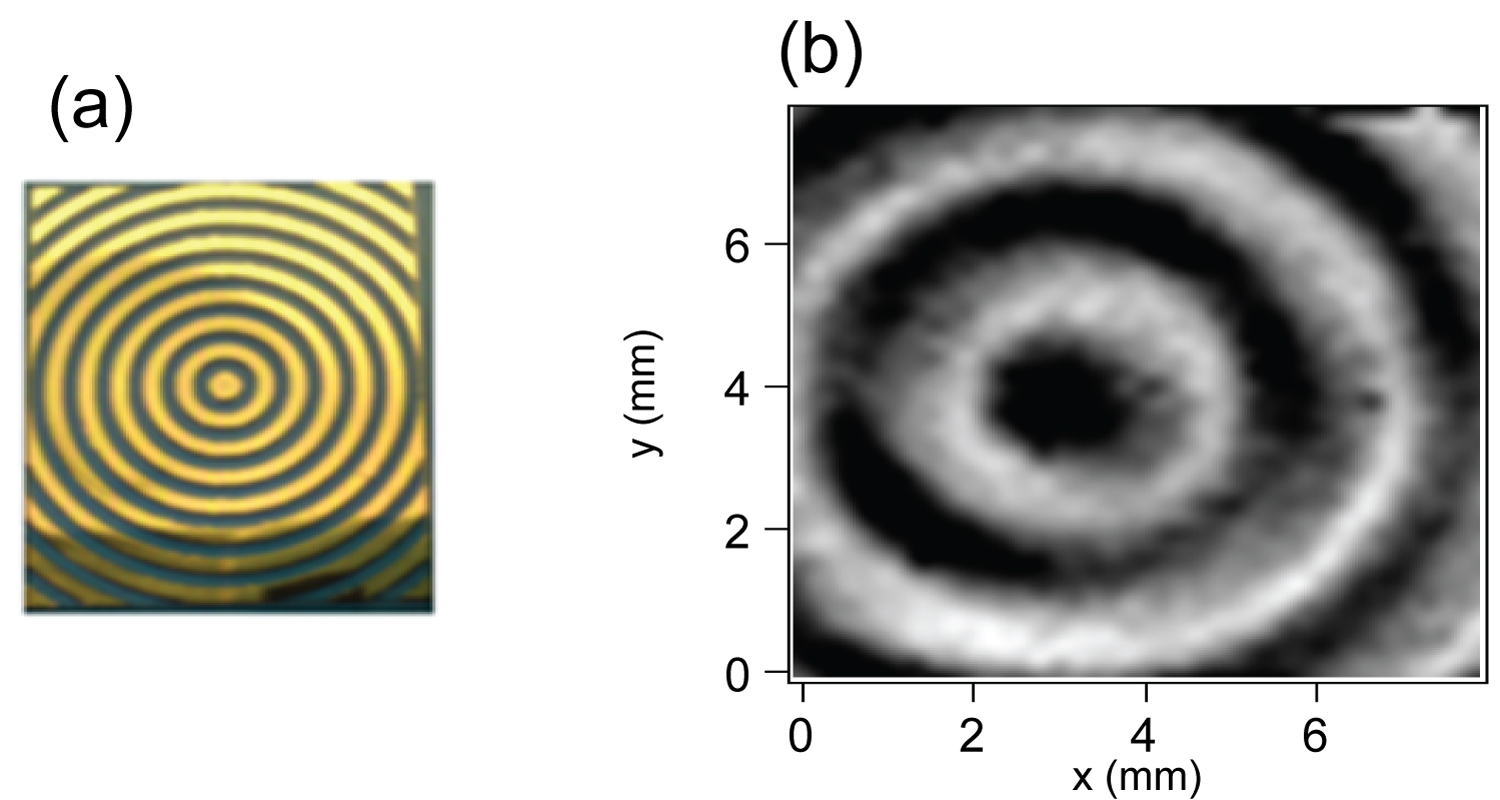
Figure 4: a) A photograph of concentric-circle...
a) A photograph of concentric-circle pattern; b) frequency decomposed image at 2 THz.
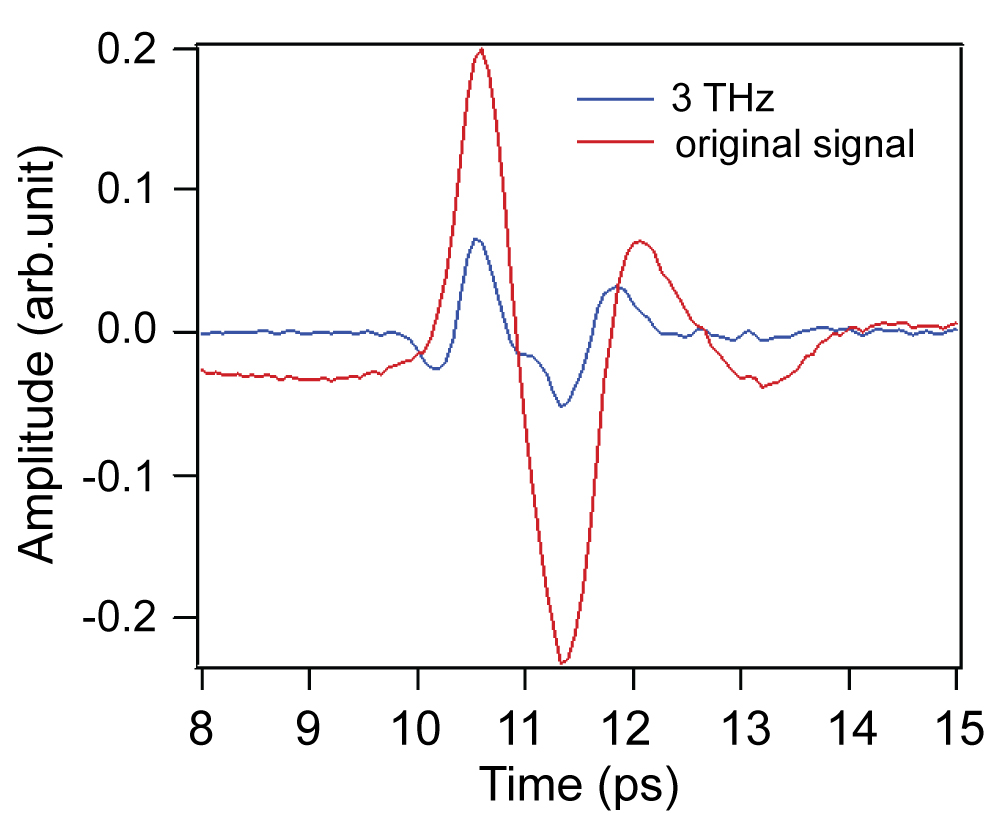
Figure 5: Time wave form of original...
Time wave form of original signal and the component of 3 THz.
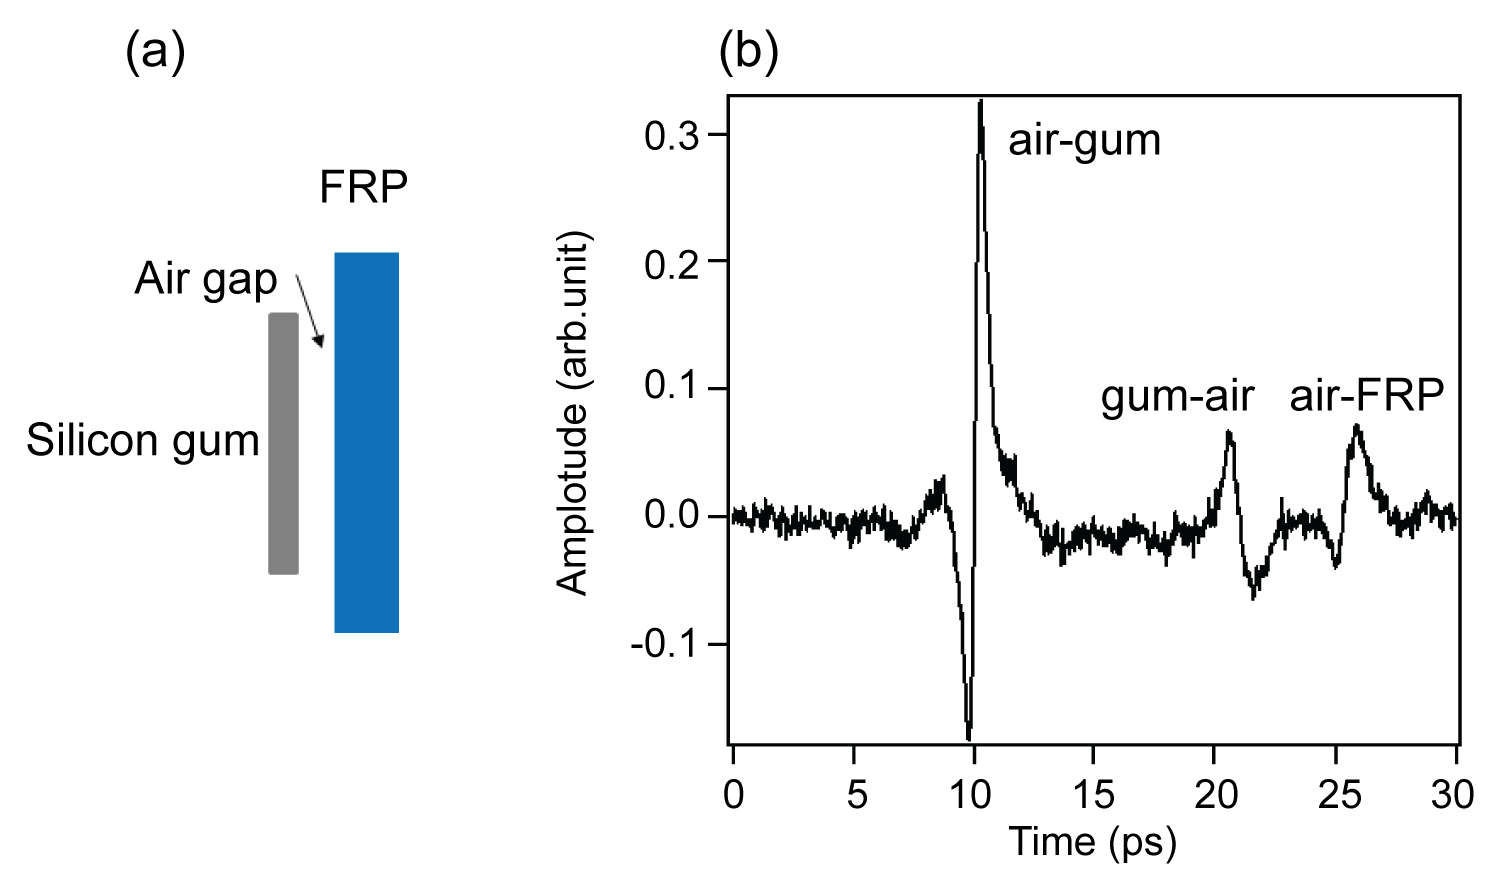
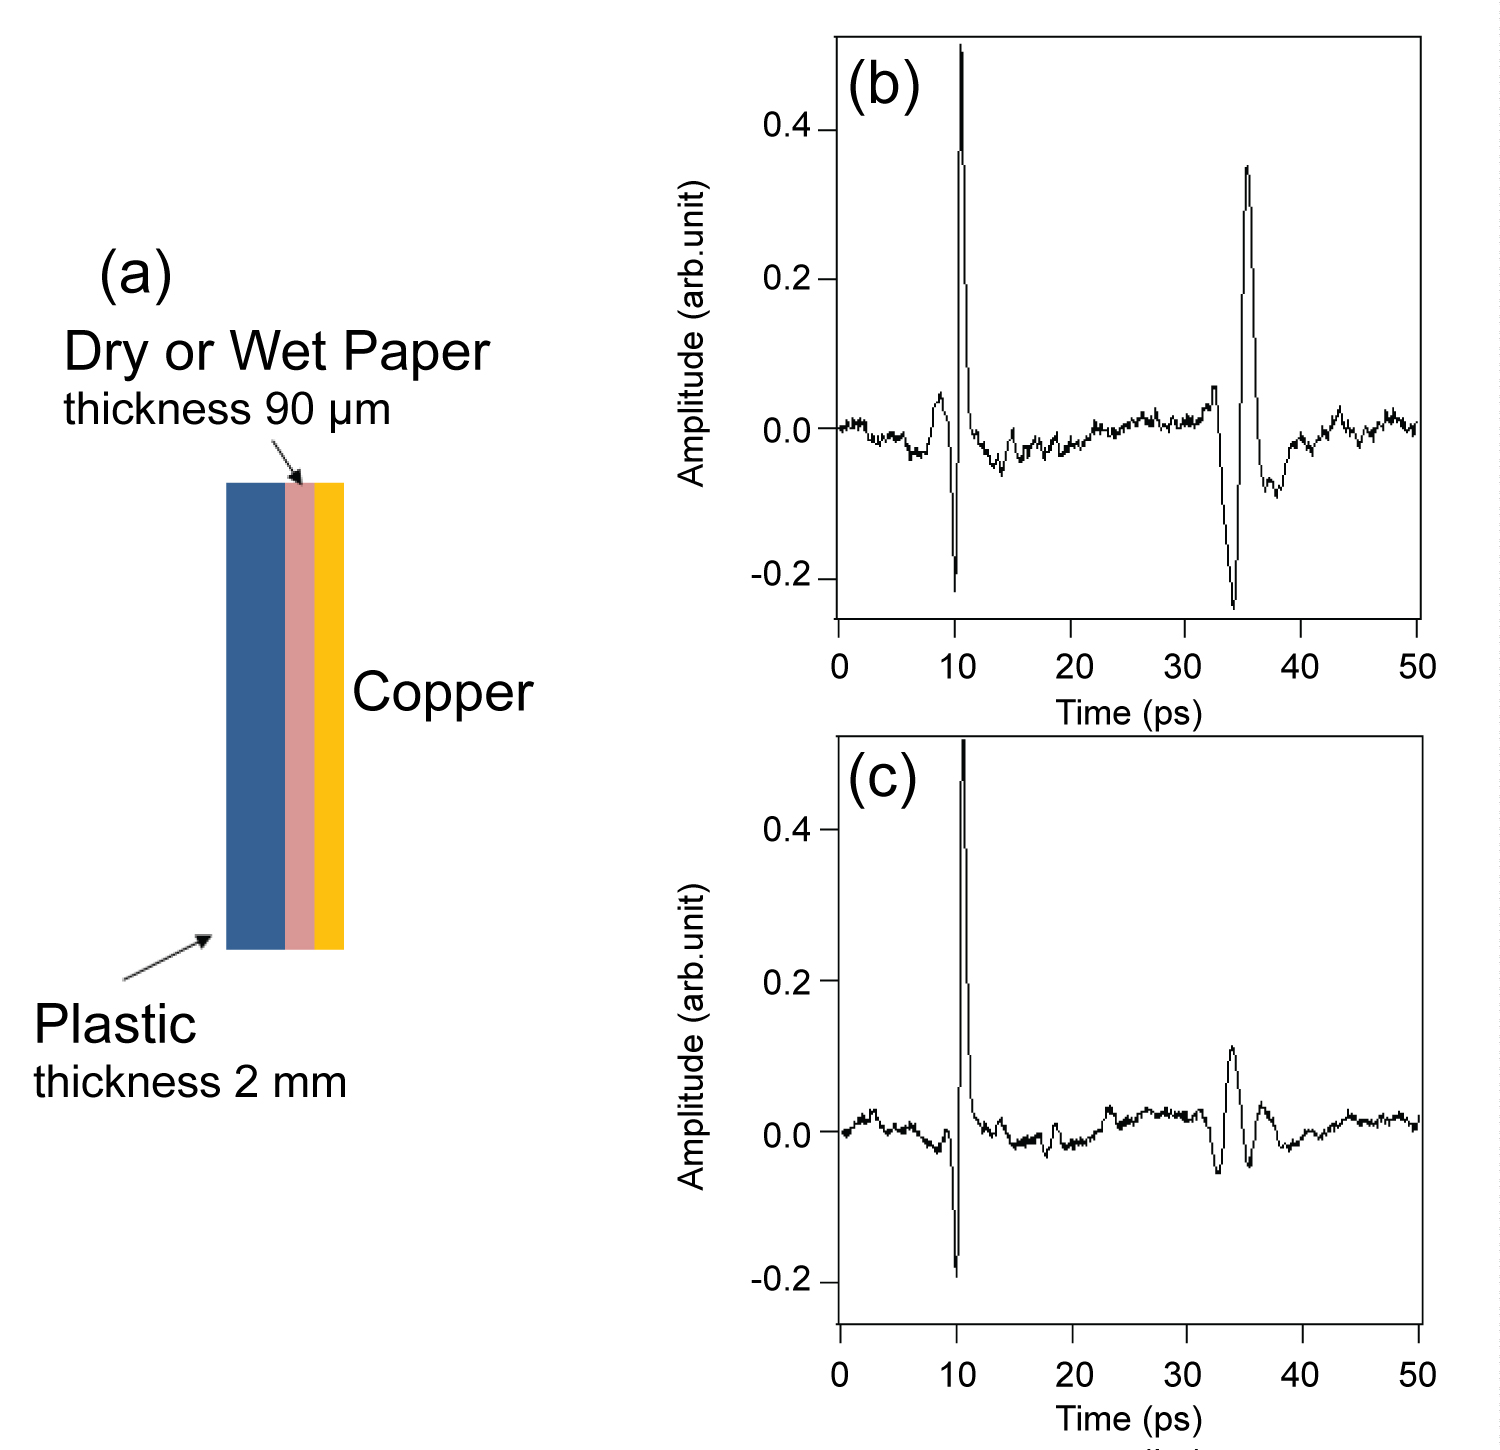
Figure 7: a) The mock sample of cable; b) time...
a) The mock sample of cable; b) time wave form reflected from sample with dry paper; c) wet paper.
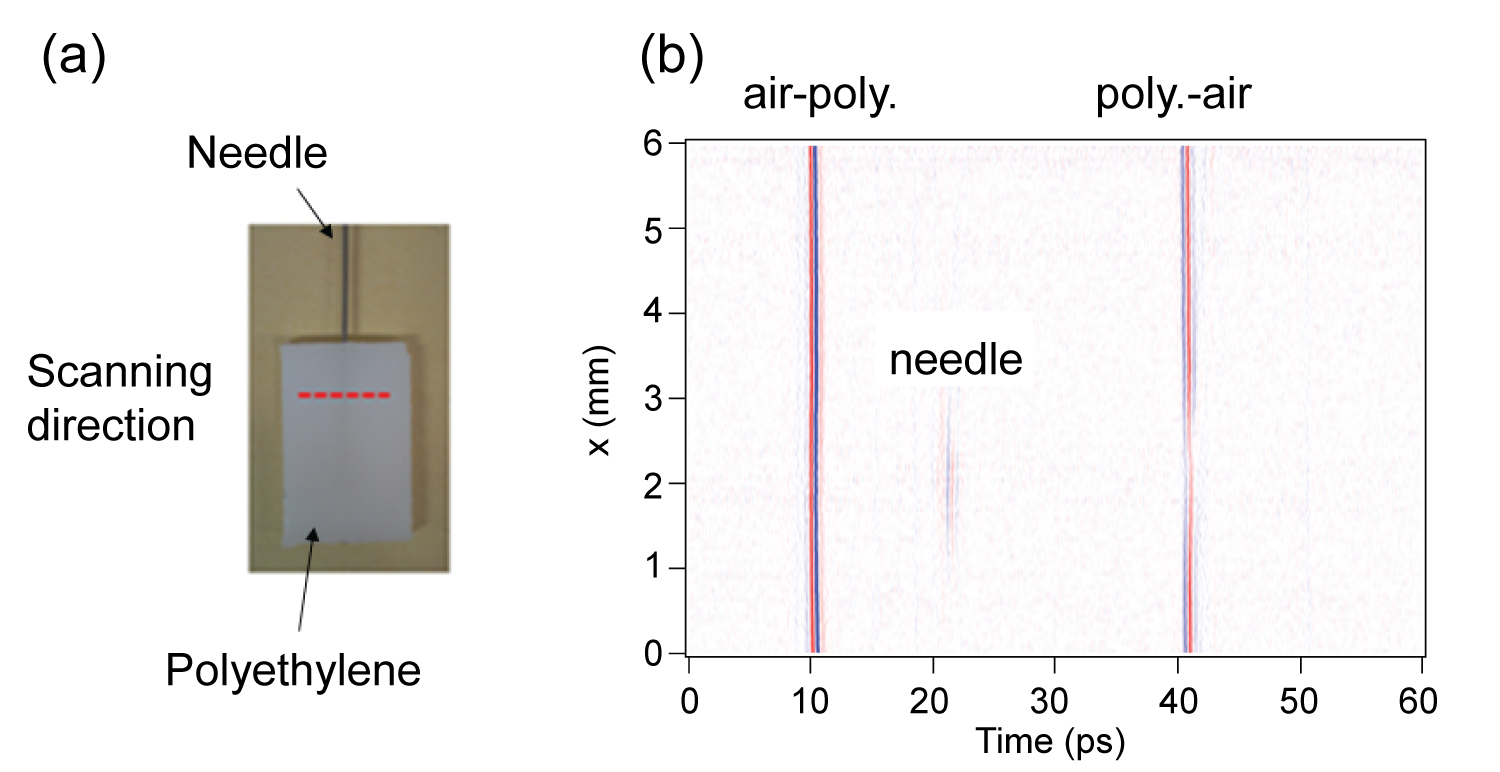
Figure 8: Detection of alien substances...
Detection of alien substances in insulation materials. a) Sample made of polyethylene plate with inserted metallic needle; b) the scanning image at 2 THz.
References
- Jiang Z, Xu XG, Zhang XC (2000) Improvement of terahertz imaging with a dynamic subtraction technique. Appl Opt 39: 2982-2987.
- Kitahara H, Takeda MW, Lida M, Tani M, Waranabe M, et al. (2004) Reflection losses of finite periodic Crystals. Laser Physics 14: 654.
- Hu BB, Nuss MC (1995) Imaging with terahertz waves. Opt Lett 20: 1716.
- Hangyo M, Nagashima T, Nashima S (2002) Spectroscopy by pulsed terahertz radiation. Meas Sci Tech 13: 1727-1738.
- Darmo J, Tamosiunas V, Fasching G, Kroll J, Unterrainer K, et al. (2004) Imaging with a Terahertz quantum cascade laser. Opt Express 12: 1879-1884.
- Mittleman DM, Hunsche S, Boivin L, Nuss MC (1997) T-ray tomography. Opt Lett 22: 904-906.
- Kitahara H, Takano K, Ikeda T, Tani M, Hangyo M (2007) Applications of terahertz time-domain reflectometry. IEEJ Trans FM 127: 391-396.
- Hori Y, Yasuno Y, Sakai S, Matsumoto M, Sugawara T, et al. (2006) Automatic characterization and segmentation of human skin using three-dimensional optical coherence tomography. Opt Express 14: 1862-1877.
- Miyamaru F, Yonera T, Tani M, Hangyo M (2004) Terahertz two-dimensional electro-optic sampling using high speed complementary metal-oxide semiconductor camera. Jpn J Appl Phys 43: L489.
- Cole BE, Woodward RM, Crawley D, Wallace VP, Arnone DD, et al (2001) Terahertz imaging and spectroscopy of human skin in vivo. SPIE proc Photonics west 4276: 1-10.
- Horiuchi N (2010) Quantum optics: Enhanced quantum light generation. Nature Photonics 4: 140.
- Liu HB, Zhong H, Karpowicz N, Chen Y, Zhang XC (2007) Compact continuous-wave subterahertz system for inspection applications. Proc IEEE 95: 1514.
- Appleby R, Wallace HB (2007) Standoff detection of weapons and contraband in the 100 GHz to 1 THz region. IEEE Trans Antennas Propag 55: 2944-2956.
- Hauri CP, Ruchert C, Vicario C, Ardana F (2011) Off-resonant magnetization dynamics phase-locked to an intense phase-stable terahertz transient. Appl Phys Lett 99: 161116.
- Vigilante M, Reynaert P (2014) An E-Band low-noise Transformer-Coupled Quadrature VCO in 40 nm CMOS. Euro Solid State Circuits Conf 40: 423-426.
- Huang KC, Wang Z (2011) Terahertz terabit wireless communication. IEEE Microwave Magazine 12: 108- 116.
- Llombart N, Cooper KB, Dengler RJ, Bryllert T, Siegel PH (2010) Confocal ellipsoidal reflector system for a mechanically scanned active terahertz imager. IEEE Trans Antennas Propag 58: 1834-1841.
- Nagatsuma T, Song H, Kado Y (2010) Challenges for ultrahigh-speed wireless communications using terahertz waves. Terahertz Sci Technol 3: 55-65.
- Ajito K, Ueno Y, Song HJ, Tamechika E, Kukutsu N (2011) Terahertz Spectroscopic Imaging of Polymorphic Forms in Pharmaceutical Crystals. Molecular Crystals and Liquid Crystals 538: 33-38.
- Cooper KB, Dengler RJ, Llombart N, Thomas B, Chattopadhyay G, et al. (2011) THz imaging radar for standoff personnel screening. Terahertz Science and Technology IEEE Transactions 1:169-182.
Author Details
Dazhi Li* and Shinji Motokoshi
Institute for Laser Technology, Suita, Osaka, Japan
Corresponding author
Dazhi Li, Institute for Laser Technology, Suita, Osaka 565-0871, Japan, E-mail: dazhi_li@hotmail.com
Accepted: June 03, 2016 | Published Online: June 06, 2016
Citation: Li D, Motokoshi S (2016) Diagnosis of Insulation Materials with Terahertz Wave. Int J Magnetics Electromagnetism 2:006.
Copyright: © 2016 Li D, et al. This is an open-access article distributed under the terms of the Creative Commons Attribution License, which permits unrestricted use, distribution, and reproduction in any medium, provided the original author and source are credited.
Abstract
Preliminary experiments for a planning project to develop terahertz wave devices for non-contact and non-destructive diagnosis of electric power facilities are presented. A reflection-type terahertz time-domain spectroscopy was built to study the possible applications in diagnosing defects occurred in insulation materials or other nonmetallic parts of electric power facilities. We performed experiments on detecting some insulation material samples, and the results show that it is feasible to find out the defects, alien substances and water in the samples through analyzing the reflected terahertz wave. In addition, a data-processing technology capable of improving the depth resolution is demonstrated.
Keywords
Terahertz wave, Insulation materials, Electric power facility
Introduction
As a light between radio waves and infrared, terahertz wave has some unique properties which are expected to be used in a wide range of fields [1-10]. Terahertz waves have found applications in many different fields, such as physics, material science, electrical engineering; chemistry, forensics, and new research potential are being discovered in biology and medicine [11-20]. Applications of terahertz wave to non-contact and non-destructive diagnosis is attracted in recent years, since it can pass through a variety of amorphous substances- many synthetics, textiles and plastic products. It has been successfully applied to check the authenticity of the bank bills and to measure the complex index of refraction of materials [4-6]. And it is expected to be applied to the surface and inner-structure diagnosis of insulated products used for electric power facilities.
Cooperating with an electric power company, a project of developing non-contact and non-destructive diagnosis of electric power facilities with terahertz wave is under planning in our institute. As part of preparation for the project, we performed preliminary experiments to study the properties of insulation materials in terahertz regime and explore the possible applications in diagnosis of electric power equipment. A terahertz time-domain spectroscopy was built to generate terahertz wave and support the measurement of terahertz wave reflected from samples. In this paper, we present preliminary experiments on detecting insulation material samples with simulated defects to demonstrate the feasibility of terahertz wave in diagnosing electric power facilities.
Experiments
Experimental setup
A reflection-type time-domain spectroscopy system has been developed in our laboratory. The block diagram and photograph of the experimental setup are shown in figure 1, figure 2 respectively. The terahertz wave emitter and detector are photoconductive dipole antennas. Femtosecond laser is used for generating pump and probe pulses for excitation and gating the photoconductive dipole antennas. The center wavelength of the laser is 800 nm and the repetition rate is 80 MHz. The emitter bias voltage has a 10 kHz sinusoidal wave form with 100-V amplitude. The terahertz radiation beam is focused on the surface of a sample with an angle of 8 degree from the normal direction to the sample surface by using a lens and two mirrors as shown in figure 1. The reflected terahertz wave is focused on the detector antenna by using a mirror, a lens and an off-axis parabolic mirror. The timing of the probe pulse was varied against the pump pulse to obtain time-domain wave form of the terahertz wave. The spectrum can be obtained by Fourier transform of the time wave form. The raster scan imaging is realized by moving the sample stage in the direction perpendicular to the plane of terahertz wave irradiation. At each position of the raster scanning, the reflection terahertz wave form is measured. The maximum translation range of the sample stage (an x-y stage) is 20 mm in each lateral direction.
Performance of setup
At room temperature and dry atmosphere, a reference wave form measured for a high reflection metal plate (a sliver-coated mirror) and its Fourier transform spectrum are shown in figure 3a and figure 3b, respectively. The time delay interval is 66.7 fs and the amount of data is 1024. In the time wave form, besides the main pulse at 10 ps, small pulses appear at ~18 ps and 50 ps, which are due to the reflections of terahertz pulse at the interfaces between the GaAs substrate and the Si lens used for the emitter and the detector photoconductive antennas. These system-intrinsic pulses will produce an artifact in the depth profile measurements, which should be taken into account in the interpretation of experimental results. The reference spectrum in figure 3b shows a monotonic decrease with increasing frequency from the maximum level at 0.2 THz to the noise level. The signal to noise is about 102 at 0.2 THz.
In order to investigate the performance of the setup as an image, a concentric-circle pattern was used as test sample (Figure 4a) to measure the lateral spatial resolution. The sample is fabricated by thermal transfer printing on to a plastic sheet with conductive ink. The width of the lines and gaps are both 1 mm. Scanning experiment was performed with a 0.2 mm step in x and y direction. The frequency decomposed image at 2 THz is shown in figure 4b, and the pattern image is observed clearly. Considering the lens with 360 mm focus length and 50 mm diameter, it is reasonable to estimate the lateral spatial resolution to be about 1 mm.
A paper with thickness of 90 μm is used as a sample for the resolution test in the direction of incident beam (the depth resolution). The time wave form is plotted in figure 5 as red line. It is shown that the peaks of the wave reflected from the air-paper interface and the paper-air interface could not be distinguished because peaks are overlapping together. In order to improve the depth resolution, we used wavelet transform to extract a certain high frequency component from the original data. In figure 5, the wave form at 3 THz is plotted as blue line, from which we can distinguish the peaks reflected from air-paper and paper-air interfaces. With this data-processing method, a sample with depth of several tens of μm could be measured. It should be noted that comparing to the incident wave, the wave reflected from the air-paper interface holds an inverse phase as shown in figure 5.
Experimental results
Since their introduction in 1970s, polymer insulators have been increasingly accepted and applied to electrical utilities as suitable replacements for porcelain and glass insulators. Polymer insulator is composed of fiber reinforced plastic (FRP) with coating silicon gum tightly. Separations between the silicon gum and FRP could take place when polymer insulators are used for a long time, and these separations lead the decrease of insulating performance. So, it is expected to diagnose those separations without destruction. A sample made of a 1 mm thick silicon gum and a 3 mm thick FRP plate is shown in figure 6a, and a small gap between the gum and the FRP is set deliberately to simulate the separation. The reflected wave form was measured and shown in figure 6b. Three reflected peaks are observed, which are from interfaces of air-gum, gum-air and air-FRP, respectively. From the separation of time induced by the air gap, the length of the gap can be concluded as 795 μm, with using the expression
where l is the gap length, c is the light velocity in vacuum, Δt is the separation of time, and θ is the incident angle.
As is known, the water leaking into a high voltage cable induces the corrosion of copper which is used as the shield layer under the plastic layer. The corrosion could destroy the insulator, so, it is better to find the place of leakage of water in advance. We attempt to detect the water leakage between the plastic and the copper layer with terahertz wave. The mock sample is shown in figure 7a. Between a copper substrate and a plastic plate with thickness of 2 mm, dry or wet paper is set to simulate the cases of with and without leakage of water. The paper is 90 μm thick, and stuck on the plastic plate. The measured wave forms are given in figure 7b and figure 7c, respectively. Comparing with the case of dry paper, the case of wet paper shows a weakened signal reflected from the copper, which is due to the absorption of water.
Next, we attempt to find alien substances in insulation materials. A polyethylene plate with an inserted metal needle is used as a sample as shown in figure 8a. The thickness of the polyethylene plate is 3 mm, and the diameter of the needle is 0.75 mm. The dashed line on figure 8a indicates the scanning direction, and it is shown that the scanning path across the area where the needle exists. We scanned 6 mm along the scanning path with a 0.05 mm step. With using the data-processing method mentioned above, the wave form at 2 THz is chosen to plot a scanning image as shown in figure 8b. In figure 8b, we can distinguish the air-polyethylene interface, the needle and the polyethylene-air interface, which means that the needle inside the polyethylene plate could be detected.
Conclusion
In conclusion, we built a reflection-type terahertz time-domain spectroscopy, and demonstrated non-contact and non-destructive diagnosis of insulating materials. The preliminary experiments show that terahertz wave can be applied to diagnose inner structures of various insulator used for electric power facilities. The results are helpful to a planning project on the development of terahertz wave applications in diagnosis of electric power facilities.
Acknowledgement
This work is supported by the Kansai electric power co. INC. We thank Dr. Kitahara H, Dr. Takano K and Prof. Nakajima M for kind help in preparing experiments.