
International Journal of Optics and Photonic Engineering
(ISSN: 2631-5092)
Volume 6, Issue 2
Research Article
DOI: 10.35840/2631-5092/4543

Article Formats
Ethanol Gas Concentration Detection System Based on Infrared Spectrum
Table of Content
Figures
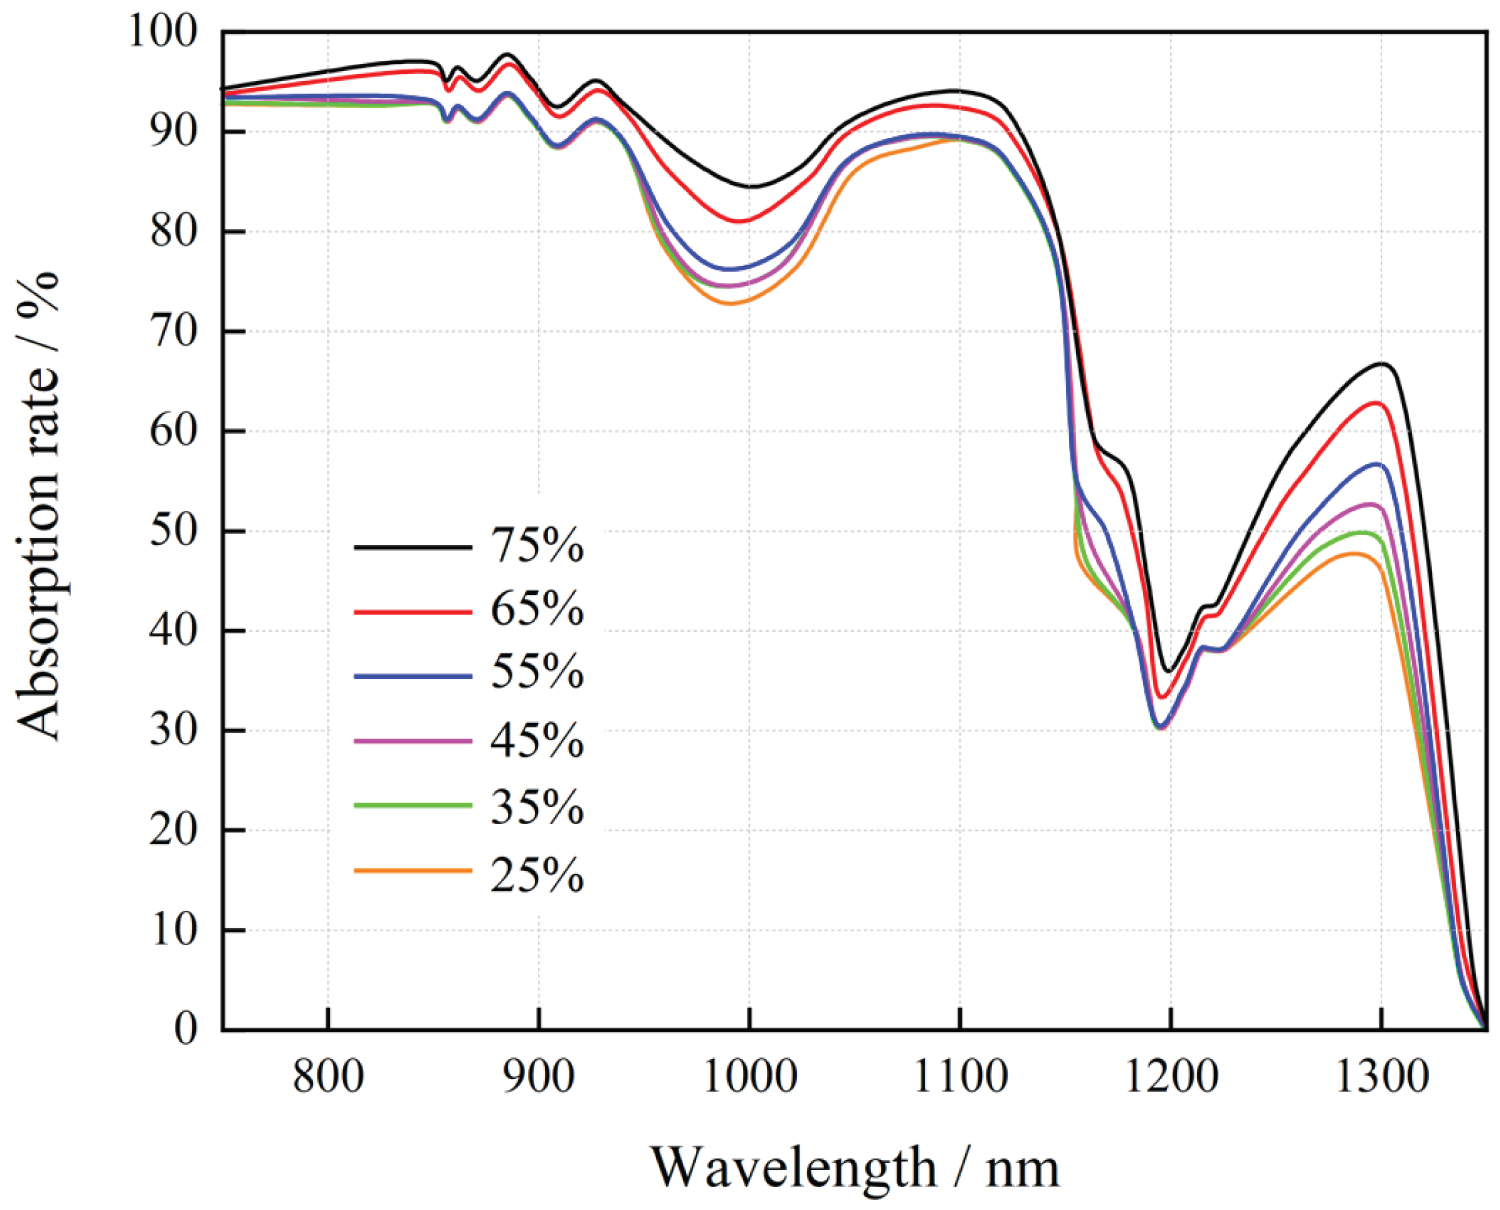
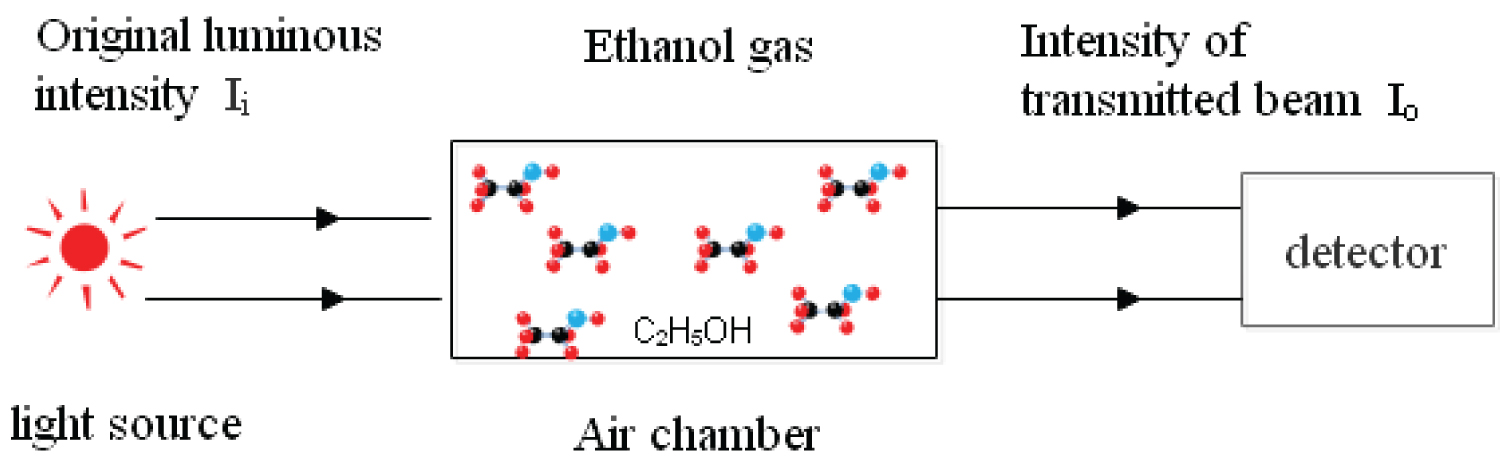

Figure 3: Three-dimensional stereogram of....
Three-dimensional stereogram of a double pitch air chamber.
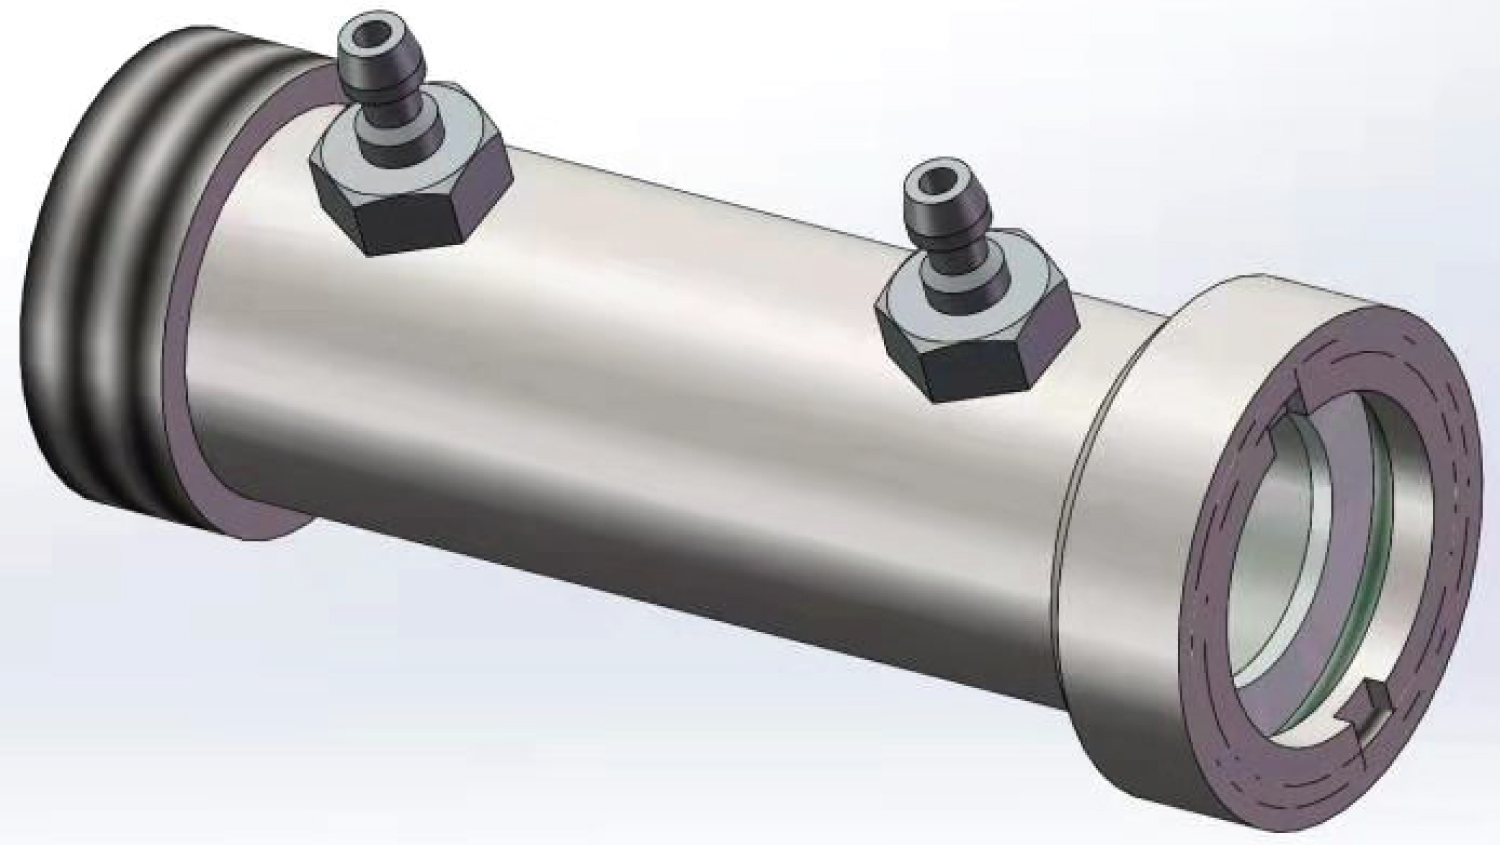
Figure 4: Three-dimensional stereogram of....
Three-dimensional stereogram of a single pitch air chamber.

Figure 5: (a) Structure of air chamber....
(a) Structure of air chamber pipeline, and (b) Pipeline section design drawing.
References
- Lisha L (2021) Study on the strategies to promote the international competitiveness of Chinese Baijiu. Tianjin University of Commerce, Tianjin, China.
- Fei C (2021) Study on liquor marketing strategy optimization of SJF company. University of Electronic Science and Technology of China, Chengdu, China.
- Wei X, Hong T, Na B, Jinlin H (2010) Rapid determination of alcohol content in distilled spirit by NIR spectroscopy. Chinese Agricultural Science Bulletin 26: 70-72.
- Chunpu S, Changwen L, Shan W, et al. (2013) Research progress of application of infrared spectrometry in Chinese liquor brewery manufactories. China Brewing 31: 76-79.
- Ortega IL, Gonzalez-Perez C, Revilla I, Hernandez-Hierro JM, Martín IG, et al. (2014) Potential of near infrared spectroscopy for the analysis of volatile components in cheeses. LWT - Food Science and Technology 55: 666-673.
- Sihai H, Yushan G, Xuan L, et al. (2018) Determination of ethanol in base liquor of Baijiu based on near infrared spectroscopy technology. China Brewing 37: 158-161.
- Razuc M, Grafia A, Gallo L, Ramírez-Rigo MV, Romañach RJ (2019) Near-infrared spectroscopic applications in pharmaceutical particle technology. Drug Dev Ind Pharm 45: 1565-5789.
- Mayerhöfer TG, Pahlow S, Popp J (2020) Cover profile: The Bouguer-Beer-Lambert law: Shining light on the obscure. Chem Phys Chem 21: 2029-2046.
- Ya-fu W, Li S, Wei H, Yun-Long W (2016) Simulation and experiment of the nonlinear response of the InGaAs p-i-n photodiode under high illumination. Optical Measurement Technology and Instrumentation 10155.
- Xu L, Li H, Li P, Ge C (2020) A high-voltage and low-noise power amplifier for driving piezoelectric stack actuators. Sensors 20: 6528.
- Hao L, Qianyu R, Jia L, Pinggang J (2021) Design of driving and acquisition circuit for infrared spectrum sensor based on FPGA. Electronic Measurement Technology 44: 159-164.
- Fadavi A, Salari S, Mansouri A, Hoseini S (2020) Effects of vacuum and juice concentration on electrical conductivity by the Ohmic method: A case study of sour cherry. Food and Bioprocess Technology 13: 1146-1153.
Author Details
Liao Tongqing1*, Zhang Ning1, Zuo Changyu2 and Zhou Gang2
1School of Electronics and Information Engineering, Anhui University, Hefei, China
2Anhui Qingyu Photoelectric Technology Co.Ltd, Hefei, China
Corresponding author
Liao Tongqing, School of Electronics and Information Engineering, Anhui University, Hefei, 23060, China.
Accepted: December 18, 2021 | Published Online: December 20, 2021
Citation: Tongqing L, Ning Z, Changyu Z, Gang Z (2021) Ethanol Gas Concentration Detection System Based on Infrared Spectrum. Int J Opt Photonic Eng 6:043.
Copyright: © 2021 Tongqing L, et al. This is an open-access article distributed under the terms of the Creative Commons Attribution License, which permits unrestricted use, distribution, and reproduction in any medium, provided the original author and source are credited.
Abstract
Based on the absorption mechanism of infrared spectrum of ethanol gas, a detection system is designed to detect the concentration of ethanol gas quickly and accurately. Based on the Beer-Lambert law and the absorption rate of ethanol gas in the near-infrared band, the LED with the center wavelength of 1300 nm is selected as the light source, and then the cascaded air chamber is designed, and the light source driving circuit and detecting circuit are designed and made. The results show that the system is simple in structure, stable in performance. The measurement error is within ±5.8%, which meets the current demand of ethanol concentration detection in the liquor industry.
Keywords
Infrared spectrum, Ethanol gas, Air chamber, Beer-Lambertlaw, Absorption rate
Introduction
Liquor is a unique beverage in China, which has both the characteristics of food and culture. According to statistics, China's total liquor production increased at a rate of at least 10% per year from 2012 to 2017. But, liquor production decreased slightly from 2018 to 2020 for the adjustment of production and sale [1,2]. And then, total liquor production increased at a rate of 6.51% from January to September in 2021, total output amounted to 501.17 ten thousand kiloliter.
Taking Anhui Province as an example, the output of liquor was 432,300 kiloliters in 2018, which ranked fifth in China. There are 6 large-scale liquor production enterprises, about 300 small and medium-sized liquor production enterprises, and more than 60,000 fermentation cellars in Anhui Province.
With the development of societal informatization, how to detect the concentration of ethanol gas in wine cellars quickly and accurately is important to reduce cost and improve product quality [3]. The liquor fermentation cellars are used as research and development break through, and spectroscopy technology is used to detect the alcohol concentration timely in this paper.
Near infrared spectrum (NIR) analysis technology is a rapid detection technology, with the advantages of good stability, rapid reaction [4], without destruction and non-pollution [5] compared to traditional chemical methods (Mohr's salt method, potassium dichromate colorimetry, iodometry, etc.) and physical methods (gas chromatography, density flask method, alcohol meter method) [6].
Firstly, a system based on near-infrared spectroscopy is designed to detect the concentration of ethanol gas in fermentation cellars quickly and accurately. And then, the related experiments are done and analyses are conducted.
Infrared Absorption Mechanism of Ethanol Gas
Ethanol has 21 fundamental vibrational modes absorbing in the infrared, but the spectrum extends to the NIR region with the overtones and combinations of these modes [7]. The NIR spectrum of ethanol from 800 to 1400 nm has been measured at 6 different concentrations. The spectral data of each sample was an average value of 10 times measured value, which has deducted the air background spectrum. In experiment, Fourier transform spectrometer which has been calibrated by linear regression method is used.
Figure 1 shows how the NIR absorption rates of ethanol, with peaks at 910, 1100 and 1300 nm, depend on concentration.
It can be seen from this figure that the absorption spectrums keep their peaks positions when the ethanol concentration increases up to 50%. This is because all these peaks positions are determined by intrinsic overtones of ethanol and combinations of these modes.
Figure 1 shows these spectrums have the best differentiation at 1300 nm. So this spectral range is used in this paper.
System Design
Overall design
Based on above analysis, the design of the ethanol gas detection system is shown in Figure 2. In this configuration, only one photo detector is used to detect the total output optical power which is determined by the injection optical power, concentration of sample in air chamber and the absorption optical path length.
This relationship can be described by the Beer-Lambert law, which can be rewritten as [8]:
Where, B(λ) is the absorption coefficient and cj is the concentration of the J-th sample, and L is the absorption optical path length. B(λ) is the absorption coefficient which is determined by intrinsic overtones of ethanol and combinations of these modes in essence. So, the minimum absorption coefficient is near to 1200 nm regardless the ethanol concentration just as shown Figure 1.
This is a universal equation applies to a series of n pipelines. In our experiment (as shown in Figure 3), for a constant concentration, the sum could be dropped out, and L would be the total length. So, Eq. (1) can be simplified as.
Therefore, it is necessary to increase the length of the gas chamber reasonably in the following experiment to improve the detection sensitivity of the system.
Air chamber design
The three-dimensional stereogram of single pitch air chamber is shown in Figure 4. Both ends of the pipeline are sealed by light transmitting windows. Thread design is used in the two ends which ensure two pipes can connect closely, so as to increase the length of the pipe. Parameters of chamber are listed in Table 1.
Figure 5a and Figure 5b are plan form and cross section drawn of a single pitch air chamber as shown above. Detailed design parameters of the air chamber are marked in the figure. As shown in Figure 3, two single pitch air chambers are linked into a double pitch air chamber.
Light source and detector
The QLF1335-AD model infrared diode, which has a peak emission wavelength at 1300 nm, is selected as the light source in this paper. The LSIPD-UL0.3 model In GaAsPIN photodiode is selected as detector, which has spectral reception range from 800 nm to 1700 nm, the photosensitive peak is 1300 nm, and the photosensitive diameter is 0.3 mm [9].
System circuit design
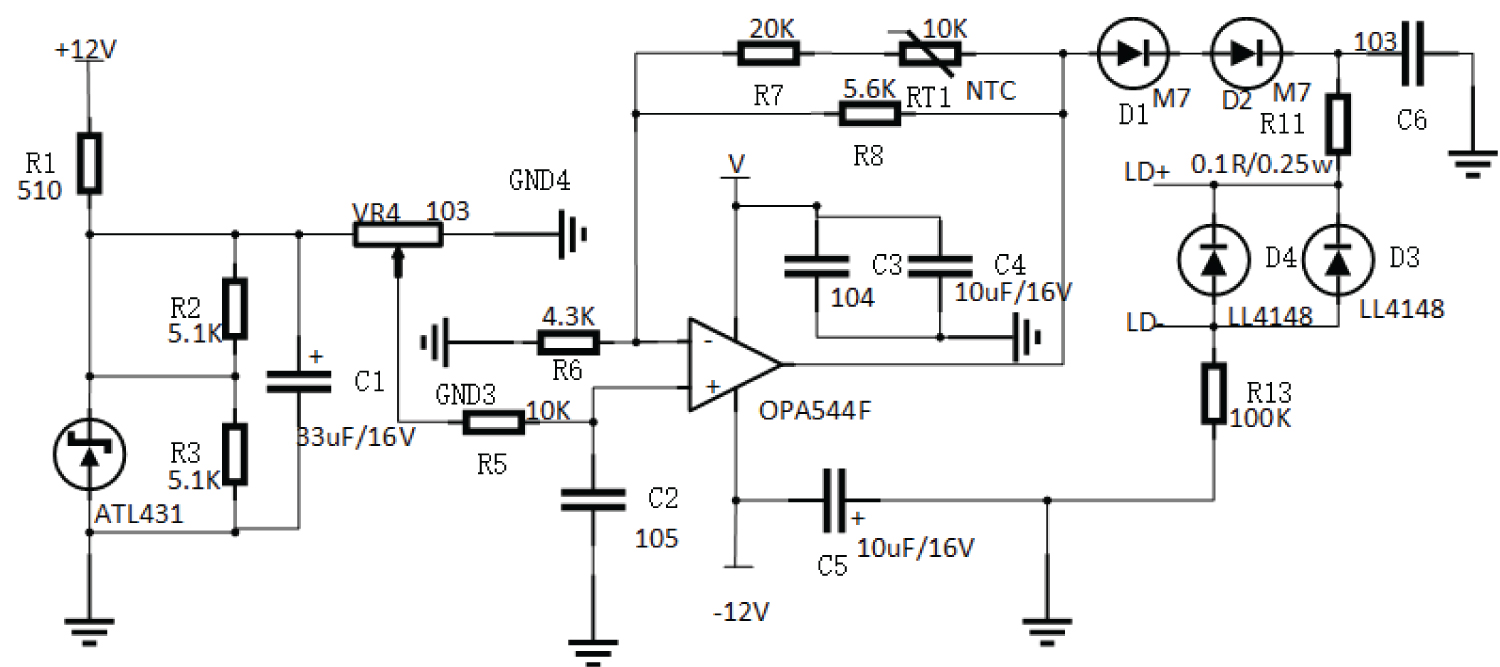
It is known that a detection system circuit mainly includes light source drive circuit and I/V conversion circuit. The light source drive circuit is shown in Figure 6. OPA544F is a power amplifier which amplifies the input small signal current. In order to reduce the amplifier loss, the input resistance R5 value is a large [10]. The thermistor RT1 is a kind of negative temperature coefficient resistor, whose resistance value decreases with the increase of temperature. The purpose of this resistor is to stabilize the output signal. The output port (LD+ and LD-) voltage drives the infrared light source to work normally. A circuit protection device is designed to prevent the circuit board damaged by improper operation in actual use.
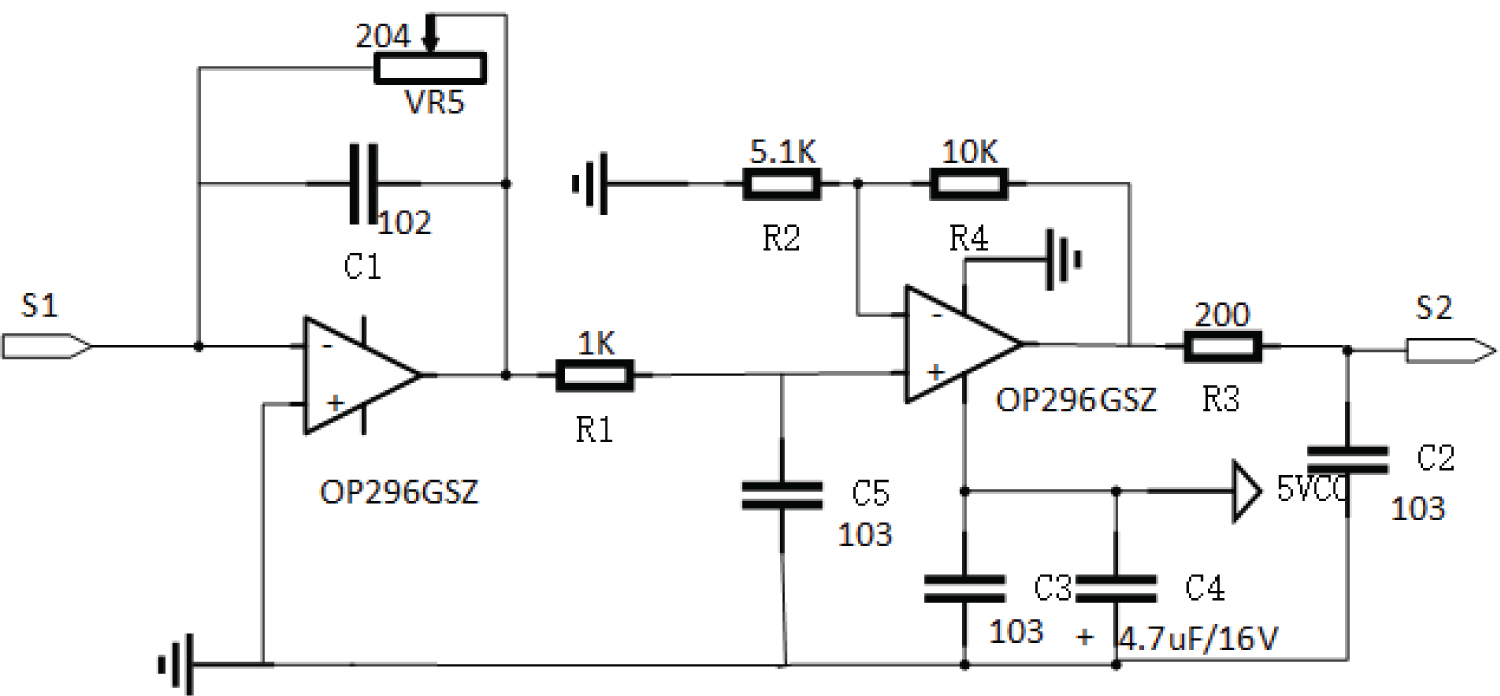
The circuit of I/V conversion is shown in Figure 7. The photodiode output current is input through S1 and amplified by operational amplifier (OP296GSZ). In order to adapt the change of light signal strength, the circuit uses variable resistor VR5 to adjust amplification factor [11]. The amplified signal is input to the amplify circuit on the right. A circuit consisting of R3 and C2 is used for filtering noise signal. The output voltage measured through S2.
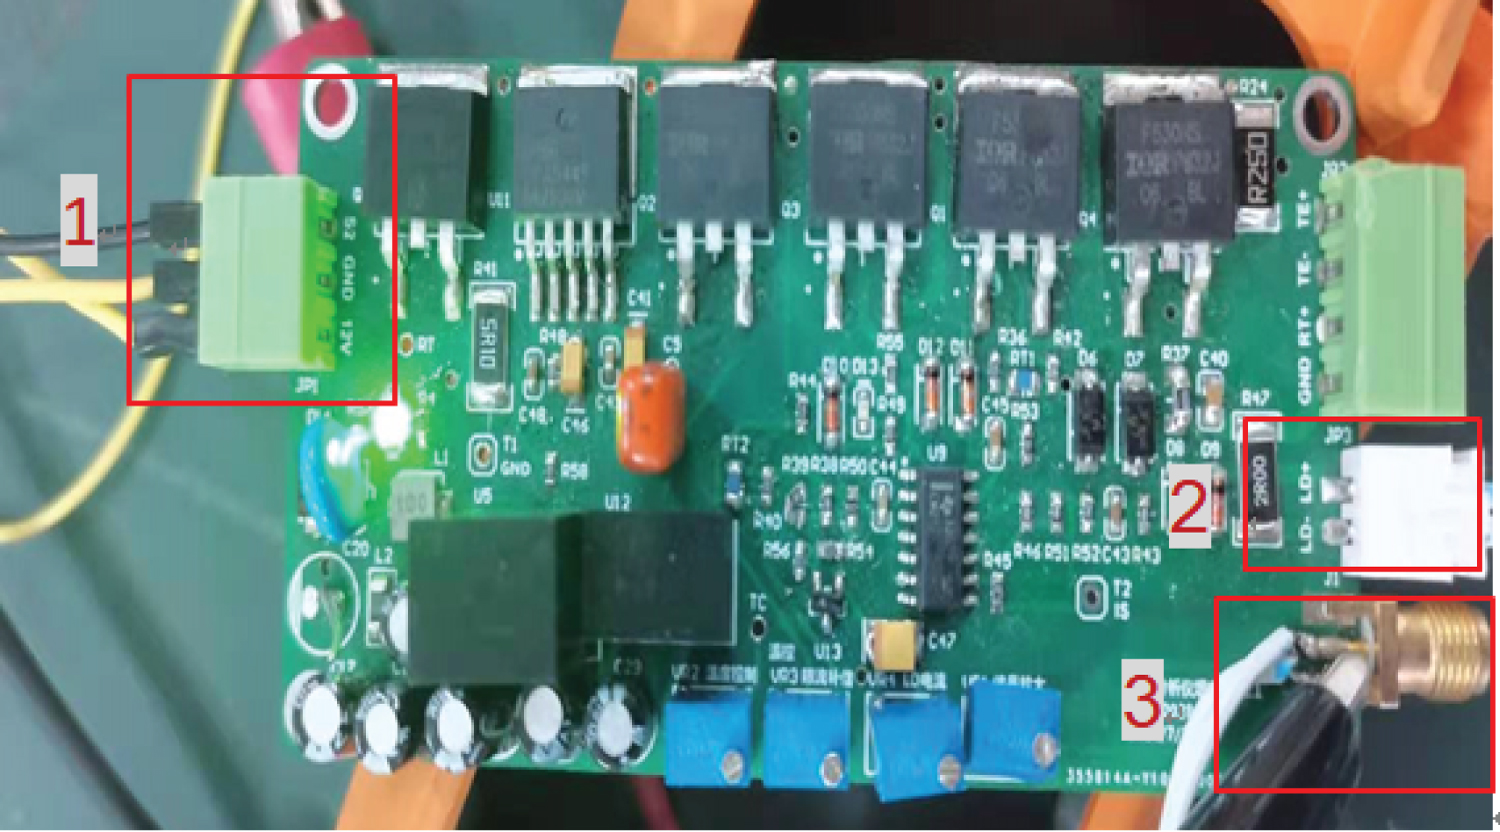
The infrared detection system circuit board is manufactured, as shown in Figure 8. The meaning of the red numbers portrayed in the Figure 8 are the port of 12 V input voltage and S2 output signal, the infrared light source interface and the photodiode interface respectively.
Experiment
The output voltages of S2 port in above mentioned system are obtained experimentally with 5-75% ethanol gas feeding in the air chamber. Then, eight groups average value of 6 times measured voltage values are listed in the third column of Table 2.
Ethanol gas concentration can be predicted according to the linear relationship between ethanol concentration and measure voltage [12]. The square of correlation coefficient R2 = 0.9986 is close to 1, and the prediction results are shown in Table 2. Relative errors are shown in the last column of Table 2. It can be seen from Table 2 that the maximumrelative error is 5.8%, which meets within ±10% of the engineering requirements.
Conclusion
An ethanol gas concentration detection system is put forward. First, QLF1335-AD model infrared diode is selected as the light source by taking advantage of good degree of discrimination in the 1300 nm band of the ethanol absorption spectrum. Then, cascading air chambers are designed to improve the detection sensitivity of the system. And then, the light source driving and detection circuits are designed and manufactured. The experiment results show that a stable detection system is obtained effectively with simple structure.
Acknowledgements
The subject is supported from the fund of Key research and development plan of Anhui Province (No.202104g01020005).