Optimization on Filtrating Process in Using the Integration of Statistical Method and Mathematical Programing
International Journal of Industrial and Operations Research
(ISSN: 2633-8947)
Volume 4, Issue 1
Research Article
DOI: 10.35840/2633-8947/6511

Article Formats
Optimization on Filtrating Process in Using the Integration of Statistical Method and Mathematical Programing
Table of Content
Figures

Tables
Table 1: The feasible process capability of filtrating parameters.
Table 2: Three levels of filtrating process for each factor.
Table 3: Response surface methodology experiment design for filtrating time and response.
Table 4: Response surface analysis for the filtrating time of filtration process.
Table 5: Response surface methodology experiment design for clarity and response.
Table 6: Response surface analysis for the filtrating time of filtration process.
Table 7: Optimal values.
References
- Mula J, Poler R, García-Sabater JP, Lario FC (2006) Models for production planning under uncertainty: A review. International Journal of Production Research 103: 271-285.
- Jeang A, Tsai CC, Chung CP (2009) Scheme for real-time process planning under process deterioration. Proceedings of the Institution of Mechanical Engineers, Part B: Journal of Engineering Manufacture 223: 1181-1192.
- Jeang A, Ko CP, Chung C-P (2019) Process mean of tolerance settings of CPU components via CAE simulation and response surface methodology. IEEE Transactions on Components, Packaging and Manufacturing Technology 9: 684-693.
- Zikmund WG, Carr JC, Babin B, Griffin M (2013) Business research methods. Nelson Education, Canada.
- Kleijnen JPC (2008) Response surface methodology for constrained simulation optimization: An overview. Simulation Modelling Practice and Theory 16: 50-64.
- Montgomery DC (2019) Design and analysis of experiments. (10th edn), John Wiley & Sons, New York, US.
- Montgomery DC (2019) Introduction to statistical quality control. (8th edn), John Wiley and Sons, New York, US.
- Box GEP, Behnken DW (1960) Some new three level designs or the study of quantitative variables. Technometrics 2: 455-475.
- Myers RH, Montgomery D, Geoffrey Vining G, Borror CM, Kowalski SM (2004) Response surface methodology: A retrospective and literature survey. Journal of Quality Technology 36: 53-78.
- Jeang A (2011) Robust cutting parameters optimization for production time via computer experiment. Applied Mathematical Modelling 35: 1354-1362.
- Myers RH, Montgomery DC, Anderson-Cook CM (2016) Response surface methodology - process and product optimization using robust design. (4th edn), Wiley, New York, US.
- Jeang A, Chung C-P, Ko CP (2020) Optimizing process parameters on the LGP molding stamper through Taguchi Method. IEEE Transactions on Components, Packaging and Manufacturing Technology 10: 487-493.
- Le, Tuan-Ho (2018) A literature review on RSM-based robust parameter design (RPD): Experimental design, estimation modeling, and optimization methods. J Korean Soc Qual Manag 46: 39-74.
- Hillier FS, Lieberman GJ (2015) Introduction to operations research. (10th edn), McGraw-Hill Publishing Company, New York, US.
- Arora JS (2016) Introduction to optimum design. McGraw-Hill, New York, US.
- Rosenthal RE (2012) GAMS: A user's guide. GAMS Development Corporation, Washington, US.
Author Details
Angus Jeang1, Chien-Ping Chung2* and Zih-Huei Wang1
1Department of Industrial Engineering and Systems Management, Feng Chia University, Taichung, Taiwan
2Executive Master of Business Administration, MingDao University, Changhua, Taiwan
Corresponding author
Dr. Chien-Ping Chung, Executive Master of Business Administration, MingDao University, No.369, Wen-Hua Rd., Pitou, Changhua, 52345, R.O.C., Taiwan, Tel: +886-4-8876660 ext.7553.
Accepted: August 12, 2021 | Published Online: August 14, 2021
Citation: Jeang A, Chung CP, Wang ZH (2021) Optimization on Filtrating Process in Using the Integration of Statistical Method and Mathematical Programing. Int J Ind Operations Res 4:011.
Copyright: © 2021 Jeang A, et al. This is an open-access article distributed under the terms of the Creative Commons Attribution License, which permits unrestricted use, distribution, and reproduction in any medium, provided the original author and source are credited.
Abstract
Conventionally, the process parameter determinations in producing rayon fiber are acquired through the trial-and-error method during the chemical reaction. However, the found parameter levels lack optimization. This study combined statistical method and mathematical programming to obtain the optimized production parameters for the filtrating process in the production of rayon fiber. The important factors of individual processes were identified in the process, and the factor and response equations were obtained by the experimental design. The process was comprehensively considered, including process and equipment constraints, the input and output balance in the process, and the heat balance of the system. Finally, with the minimization of the production cost of the filtrating process as the goal, the optimum production parameters were obtained using mathematical programming methods.
Keywords
Rayon fiber, Filtrating process, Production parameters, Response surface methodology, Mathematical programming
Introduction
The chemical process is the production process of converting or separating raw materials into useful products. They can be decomposed into a combination of many unit operations, including solid and liquid conveyance, heat transfer, evaporation, crystallization, and drying. Traditionally, chemical process improvement relies on the scientific principles of chemical reaction, the understanding of the unit operations of chemical engineering technology, and the accumulation of experience to obtain the optimization of individual process production parameters through the trial and error method. However, the output, production line balance, quality and cost of the process have not been considered, resulting in an imbalance in the production line output, the failure to optimize the process, and the relatively high cost of the overall procedure [1,2]. The market is highly competitive. This study discusses the filtrating process used in rayon fiber production and how to achieve the optimum production parameters in consideration of the process.
Jeang, et al. [3] have recently shown that the factors and levels were formulated within the equipment's adjustable parameter range, with the help of the accumulated experience; thus, they are not necessarily the optimum production parameters. Therefore, this study used the response surface methodology to develop the response equations relating to process quality, production time, temperature and output of the system. These equations were integrated into the process target equation. The feasibility ranges of the process parameters, the inter-process fluid flow, output, heat balance and quality consistent with the requirements were used as the constraints to obtain the optimal process production parameters using the mathematical programming method.
This study is divided into five sections. Section 1 is the introduction. Section 2 describes the background information needed in this research. Section 3 presents the proposed approach and application for illustration. Section 4 provides discussions. Finally, the conclusion is given in Section 5.
Background
Filtrating process in the rayon fiber production
Rayon fiber production can be divided into the viscose manufacturing system, the viscose regenerating system, and the coagulating bath recycle system. The viscose manufacturing system mainly consists of alkali cellulose and xanthation ripening processes. The viscose regenerating system mainly consists of spinning, post-processing (neutralization and purification), and drying processes. The coagulating bath recycle system mainly consists of filtration, evaporation, and crystallization processes.
The coagulating bath recycle system contains H2SO4, ZnSO4, Na2SO4 and water. While spinning the rayon fiber, xanthated cellulose viscose can spin the fiber by regeneration in the spinning machine spinneret. For the stable regeneration reaction of the fiber, the composition of the coagulating bath should be fixed. The coagulating bath flowing back from the spinning machine can produce sulfur, in addition to ZnS, viscose block, waste fiber, mechanic impurities and other impurities. Some of these impurities are dispersed in the coagulating batch as very fine particles, and others are combined into a gel that floats on the coagulating bath liquid surface. The coagulating bath contains tiny bubbles of CS2 and HS; these tiny bubbles can cause the coagulating bath to be in a muddy state and can easily result in broken fibers during spinning, thus reducing the spinning production stability and the quality of the finished fiber. Therefore, equipment is needed for filtration. During spinning, water produced by the acid-alkali reaction in the viscose is partially vaporized naturally or taken away by the tow. Most of the water remains in the coagulating bath and considerably increases its volume. To maintain the balance of the coagulating bath, the evaporation system should be used to vaporize the additional water. During spinning, the Na2SO4 produced by the chemical reaction remains in the coagulating bath. To keep the composition balance of the coagulating bath in the cycle, the additional Na2SO4 should be separated by the vacuum crystallization system.
Filtration is used to stop the particles in the fluid from forming a cake due to the driving force of the pressure gap between fluids on both sides of the filtering medium when the particle-containing fluid flows through the porous medium. As a result, the fluid will be clarified without particles after passing through the filtering medium. The filtering medium can deposit the particles of the dispersed phase on the surface or the inside of the medium to be separated from the particles of the continuous phase and form the porous substance. The filtering clothing's medium is a weaved medium. By naturally or artificially synthesizing spur-like materials, the filtering medium can be prepared by different weaving patterns. Such a filtering medium is widely used in industries. The filter aid is a powder or a fiber-like substance that can be evenly dispersed in a liquid. It can form a particle layer (filtration cake) with a great gap and a high-pressure resistance structure to enhance the filtrating velocity. The filter aid particle layer can also capture tiny particles floating in the air and prevent such particles from entering the filtering medium. The function of the filter aid is to promote the filtrating velocity (filtering rate) and filtrate clarity. Filtration methods that use filter aids include precoat filtration, admix filtration, and admix-precoat filtration methods. The liquid after filtration processing is called the filtrated liquid.
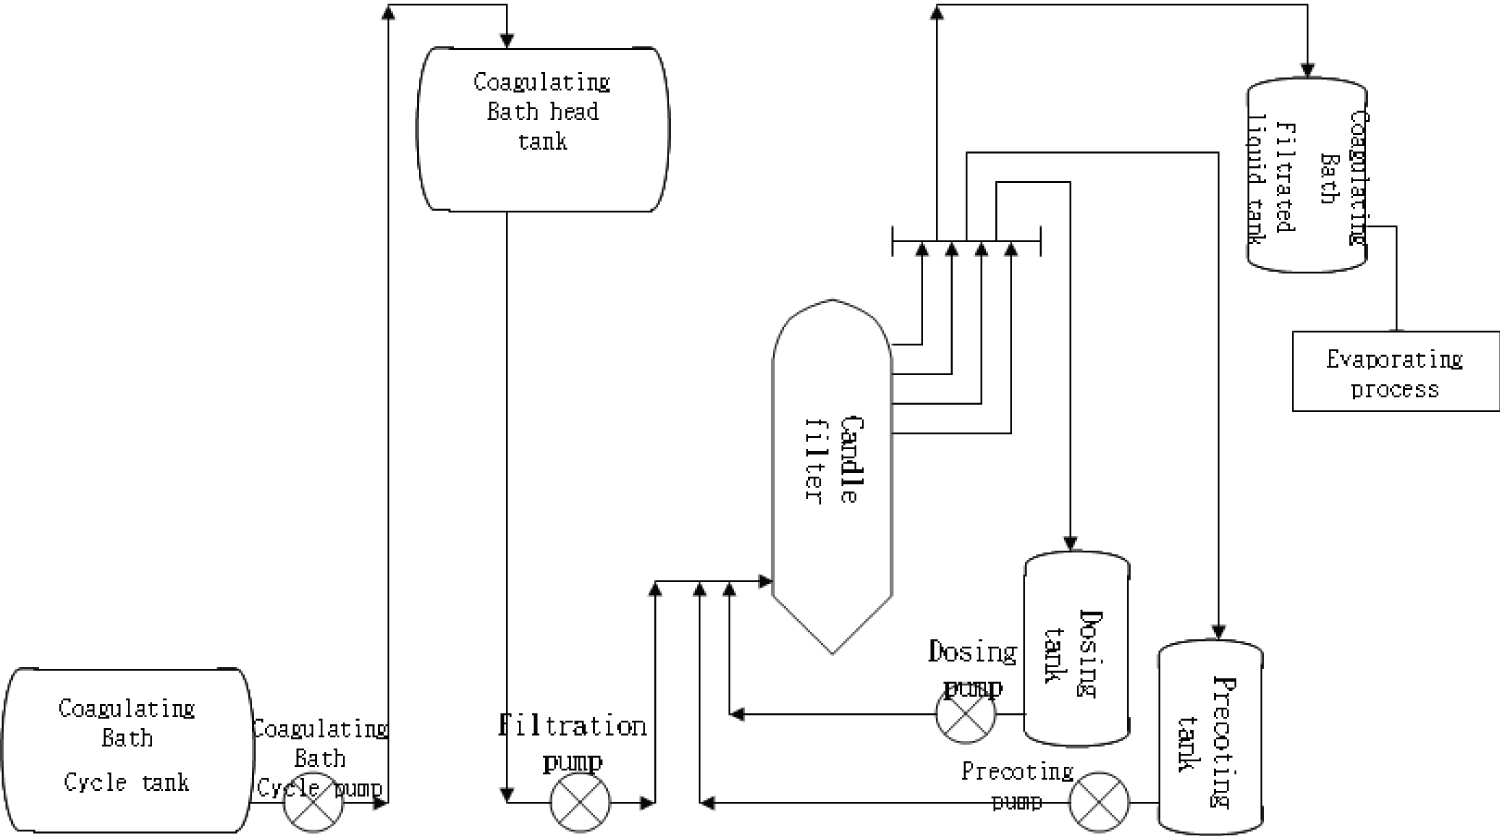
Cake filtration is used to deposit the sulfide impurities onto a filtration medium (PP filtering clothing) when the coagulating bath passes through the filtration medium to remove the sulfide solid particles. In this study, the filtration equipment used was a pressure-type spin bath filtration with candle filters. During filtration, the coagulating bath flowing back from the spinning machine was delivered into the candle filter at a fixed amount using an inverter pump. The clear liquid could pass through the filtrating cloth due to the pressure gap. There were 72 candle filter pipes inside the filter; they were externally installed with the PP filtering clothing. Before and during filtration, a filter aid made of diatomaceous earth was coated on the filtering cloth to form the particle layer to improve the filtration efficiency and prolong the filtration time. After the filtration of the coagulating bath, sulfide would gradually accumulate on the surface of the filtering cloth and increase the filter pressure to a certain level. Filtration would then be stopped to reversely wash the filtering cloth and remove the sulfide and impurities. The filtration process is shown in Figure 1.
During the filtration process, major factors influencing the cost include the time of filtration and the clarity of the filtrated liquid. The filtrated liquid clarity is the ratio of the spectrophotometer measurements of the filtrated liquids transparency to pure water. The process parameters that can affect the filtration time and filtrated liquid clarity include the filtrating velocity, the amount of filter aid on the filtering cloth due to precoat filtration, the amount of filter aid on the filtering cloth due to admix coagulating bath filtration, and the filtering cloth cleaning time.
Statistical method and mathematical programming
Design of experiment (DOE) is an appropriate experimental arrangement that uses the information of each factor level combination and the analysis of variance (ANOVA) to find the optimal process response value and its corresponding process parameter combination [4]. Moreover, it is hoped that the experiment can be performed with a minimum number of experiments to obtain the best experimental results for decision making. Response surface methodology (RSM) is a method that combines mathematics and statistics to become an effective tool for DOE [5-7]. RSM explores the relationship between independent variables and response variables, as well as fitting surface equations and optimizing response values.
Suppose there is a response variable y and n controllable variables x1, x2, ..., xn, the relationship between the reaction variable and the independent variable can be represented by an approximation function:
Where ε is the error term of the response variable y, and it is generally assumed that ε is followed normal distribution and independent, and its expected value is zero. If E(y) = f (x1, x2, ..., xk) = η represents the expected value of the response, then η = f (x1, x2...., xk) is the so-called response surface.
RSM first provides a linear function composed of independent variables for the relationship between the independent variable and the response variable to match the unknown relation. This first-order mode approximation function can be expressed as:
Among them, are constant terms. Then, if there is a curvature, a higher order polynomial, such as a second-order polynomial, must be used to analyze to find the optimal response value. This second-order polynomial approximation function can be expressed as:
In addition, the Box-Behnken design (BBD) in the response surface method uses the combination of axial points and center points to effectively estimate the squared term in the model. It is a reasonable choice for estimating second-order polynomials [8]. The BBD is characterized by a small number of experimental data, which can estimate the nonlinear polynomial of the first-order, second-order and interaction terms. It is an efficient RSM method [9-13].
Hillier and Lieberman [14] provided non-linear planning problems required the maximization of x = (x1, x2, ..., xn):
Max f(x) (4)
which is limited by:
gi(x) ≦ bi, i = 1, 2, ..., n (5)
and
x ≧ 0 (6)
where, f(x) and gi(x) are the functions of n decision variables.
Currently, there are no single algorithm that can solve each of the specific problems mentioned above [15]. However, by making various assumptions of these functions, solution methods have been developed, and relevant studies are being continuously implemented.
Non-linear planning numerical analysis computer software is very common, and examples include LINDO, LINGO, ILOG, and MATLAB (optimization tool box), which can be used to find the numerical solutions of various non-linear optimization problems. This study used the commercial computer numerical analysis software GAMS to find the numerical solutions to non-linear optimization problems. Rosenthal [16] was noted for its clear and easy to use interface and robust and stable numerical computational capabilities.
Proposed Approach
Production system status analysis
The production system status analysis stage consisted of attempting to understand the status of the production system. The analysis focused on the production line procedure, production system input and output, production processes input and output, output quality and quantity requirements, production line flow balance, production line heat balance, and production equipment production capabilities and limitations.
Production system process improvement
The proposed production system improvement procedure is shown in Figure 2. Applied to the important factors that have been obtained in the factorial design, it is reasonable to suspect that there is curvature in the experimental area. This study uses Box-Behnken Design (BBD) to build more complex models for factors and response values in a specific area to obtain the best factor settings. According to the process design data, operational principles and engineering experience, it was possible to find the response variables and controllable factors while setting the upper and lower limits of the controllable factors as high, medium and low levels.
The factors and response variables of the processes of the production system were integrated into the production system cost target equation before considering the use of the production line output, flow and heat balance, and process quality level requirements as the constraints. Afterwards, mathematical programming methods were used to find the production system cost optimization factors' levels and the response variables. Finally, the factor levels of optimization were confirmed in the production system.
Optimization of the process
There were three filtration machines in the filtration process: two in operation and one at a standby state. The pressure inside the tank of the filtration machine could reach the control end point of 4.5 Kg/cm2, and the filtration machine in the standby state began the operational procedure to complete the pre-filtration task before starting the filtration of the coagulating bath. The controllable factors that affected the filtration time and filtrated liquid clarity of the filtration machine included the coagulating bath flow (the filtrating velocity represented by X11), the pre-filtration task (the amount of pre-deposited diatomaceous earth on the filtering cloth represented by X12), the amount of diatomaceous earth for admix filtration during filtration (represented by X13), and the time needed by the filtration machine to clean the filtering cloth (represented by X14). The range of controllable factors of the filtration process is shown in Table 1, and the high, medium and low levels of the factors are shown in Table 2.
The experimental design matrix of four factors of the response curve is shown in the Appendix. According to the response curve experimental design matrix, the 27 experiments and responses combinations of the four control factors and the high, medium and low levels are shown in Table 3. The filtration time response curve's analysis results are shown in Table 4. The filtration time (h/each time) equation is as shown below:
Y1 = 425.523333-3.305375X11 + 0.341250X12 + 0.424167X13 + 0.787917X14
+ 0.005398X11X11 + 0.008388X12X11 - 0.027808X12X12 - 0.001550X13X11
+ 0.005050X13X12 + 0.034867X13X13 + 0.006462X14X11 - 0.009200X14X12
- 0.009750X14X13 - 0.025233X14X14 (7)
The following can be learned from the response curves of filtrating velocity and diatomaceous earth pre-deposition amount against filtration time: (1) When the filtrating velocity is 200 M3/h and diatomaceous earth pre-deposition amount is 10 Kg/time, the filtration time is 36.92 h; (2) When the filtrating velocity is 200 M3/h and diatomaceous earth pre-deposition amount is 30 Kg/time, the filtration time is 50.54 h; (3) When the filtrating velocity is 240 M3/h and diatomaceous earth pre-deposition amount is 10 Kg/time, the filtration time is 10.20 h; (4) When the filtrating velocity is 240 M3/h and diatomaceous earth pre-deposition amount is 30 Kg/time, the filtration time is 30.53 h; (5) When the filtrating velocity is 190 M3/h and diatomaceous earth pre-deposition amount is 31 Kg/time, the filtration time is 58.26 h.
The following can be learned from the response curve of filtrating velocity and the filtering cloth cleaning time against filtration time: (1) When the filtrating velocity is 200 M3/h and the filtering cloth cleaning time is 20 minutes, the filtration time is 41.14 h; (2) When the filtrating velocity is 200 M3/h and the filtering cloth cleaning time is 40 minutes, the filtration time is 46.84 h; (3) When the filtrating velocity is 240 M3/h and the filtering cloth cleaning time is 20 minutes/time, the filtration time is 15.19 h; (4) When the filtrating velocity is 240 M3/h and the filtering cloth cleaning time is 40 minutes, the filtration time is 26.06 h; (5) When the filtrating velocity is 190 M3/h and the filtering cloth cleaning time is 35 minutes, the filtration time is 55.53 h.
The following can be learned from the response curve of the diatomaceous earth pre-deposition amount and the filtering cloth cleaning time against filtration time: (1) When the diatomaceous earth pre-deposition amount is 10 Kg/time and the filtering cloth cleaning time is 20 minutes, the filtration time is 13.82 h; (2) When the diatomaceous earth pre-deposition amount is 10 Kg/time and the filtering cloth cleaning time is 40 minutes, the filtration time is 23.94 h; (3) When the diatomaceous earth pre-deposition amount is 30 Kg/time and the filtering cloth cleaning time is 20 minutes, the filtration time is 32.64 h; (4) When the diatomaceous earth pre-deposition amount is 30 Kg/time and the filtering cloth cleaning time is 40 minutes, the filtration time is 39.08 h; (5) When the diatomaceous earth pre-deposition amount is 34 Kg/time and the filtering cloth cleaning time is 36 minutes, the filtration time is 39.91 h.
The 27 experiments and responses of the four control factors, as well as the high, medium and low levels of the filtration process, are shown in Table 5, and the filtrated liquid clarity response curve analysis results are shown in Table 6. The filtrated liquid clarity (%) prediction equation is shown below:
Y2 = 109.127500-0.343292X11 + 0.677750X12 + 1.203500X13 + 1.231917X14
+ 0.000771X11X11 - 0.000700X12X11 - 0.004304X12X12 - 0.004825X13X11
+ 0.003650X13X12 - 0.005917X13X13 - 0.003588X14X11 - 0.010050X14X12
+ 0.000650X14X13 - 0.003017X14X14 (8)
The following can be learned from the response curve of the filtrating velocity and diatomaceous earth pre-deposition amount against the filtrated liquid clarity: When the filtrating velocity was 200 M3/h and the diatomaceous earth pre-deposition amount was 10 Kg/time, the filtrated liquid clarity was 88.31%. When the filtrating velocity was 200 M3/h and the diatomaceous earth pre-deposition amount was 30 Kg/time, the filtrated liquid clarity was 90.32%. When the filtrating velocity was 240 M3/h and the diatomaceous earth pre-deposition amount was 10 Kg/time, the filtrated liquid clarity was 81.63%. When the filtrating velocity was 240 M3/h and the diatomaceous earth pre-deposition amount was 30 Kg/time, the filtrated liquid clarity was 83.08%. When the filtrating velocity was 190 M3/h and the diatomaceous earth pre-deposition amount was 32 Kg/time, the filtrated liquid clarity was 88.31%.
The following can be learned from the response curve of the filtrating velocity and the filtering cloth cleaning time against the filtrated liquid clarity: When the filtrating velocity was 200 M3/h and the filtering cloth cleaning time was 20 minutes, the filtrated liquid clarity was 88.06%. When the filtrating velocity was 200 M3/h and the filtering cloth cleaning time was 40 minutes, the filtrated liquid clarity was 90.83%. When the filtrating velocity was 240 M3/h and the filtering cloth cleaning time was 20 minutes, the filtrated liquid clarity was 82.53%. When the filtrating velocity was 240 M3/h and the filtering cloth cleaning time was 40 minutes, the filtrated liquid clarity was 82.44%. When the filtrating velocity was 190 M3/h and the filtering clothing time was 50 minutes, the filtrated liquid clarity was 90.32%.
The following can be learned from the response curve of the diatomaceous earth pre-deposition amount and the filtering clothing time against the filtration time: when the diatomaceous earth pre-deposition amount was 10 Kg/time and the filtering cloth cleaning time was 20 minutes, the filtrated liquid clarity was 82.68%. When the diatomaceous earth pre-deposition amount was 10 Kg/time and the filtering clothing time was 40 minutes, the filtrated liquid clarity was 86.04%. When the diatomaceous earth pre-deposition amount was 30 Kg/time and the filtering cloth cleaning time was 20 minutes, the filtrated liquid clarity was 86.43%. When the diatomaceous earth pre-deposition amount was 30 Kg/time and the filtering cloth cleaning time was 40 min, the filtrated liquid clarity was 85.76%. When the diatomaceous earth pre-deposition amount was 13 Kg/time and the filtering cloth cleaning time was 40 minutes, the filtrated liquid clarity was 87.37%.
The filtration process production costs included: 1) The amount of filter aid used in the pre-deposition of the diatomaceous earth on the filtering cloth before filtration; 2) The amount of admix diatomaceous earth in the coagulating bath during filtration; and 3) The cost of manually cleaning the filtering cloth when the filtration machine reached the pressure point each time. The cost rates were as follows: C1 = 46 NTD/Kg (diatomaceous earth price); C2 = 685 NTD/time (filtration machine cleaning cost). The equipment specifications, process conditions and parameter data were as follows: V2 = 2 (number of filtration machines in operation); and V2 = 6 M3 (the volume of the admix diatomaceous earth mixing tank). The admix diatomaceous earth mixing solution flowed into the filtration machine at a filtrating velocity of 0.004 (= V3) 30 d per month, 24 h per day. The filtration time prediction equation consisted of inputting Y1 to obtain the filtration process monthly production cost function, as shown below:
Cf = (24*30/Y12)X1C1)V1 + ((24*30/(V2/V1V3X11))X13C1) + (24*30/Y1)V1C2 (9)
The filtration process's monthly production cost mainly consisted of three parts: The cost of the filtering cloth precoat used to filter the diatomaceous earth during pre-processing, the admix diatomaceous earth cost during filtration, and the filtering cloth cleaning cost. The coagulating bath filtration amount needed to be up to 400 M3/h to provide a sufficient amount of filtrate for the use of the evaporation process and the spinning process. The upper limit of the filtrating velocity was 250 M3/h. The filtration equipment manufacturer's recommended values were 10-30 Kg/time of diatomaceous earth on the filtering cloth due to precoat filtration, 5-15 Kg bag/time of admix filtration diatomaceous, and 20-40 minutes of filtering cloth cleaning time. Due to the requirements of the spinning process and the evaporation process, the coagulating bath clarity needed to be above 85%.
In summary of the above, the mathematical planning model for the filtration process production cost was as shown below:
Minimise Cf
subject to
200 ≦ X1 ≦ 240 M3/Hr (10)
10 ≦ X2 ≦ 30 Kg/each time (11)
5 ≦ X3 ≦ 15 Kg/each time (12)
20 ≦ X4 ≦ 40 minutes (13)
Y2 ≧ 85% (14)
The results of using the mathematical planning software GAMS are shown in Table 7.
Discussion
Traditionally, rayon fiber production process improvement has been based on optimizing the production parameters using the trial and error method, and therefore it could not achieve the optimization of the process production parameters. In this study, by using RSM statistical analysis, two response equations were obtained for the filtration time and filtrated liquid clarity. With the minimized production cost of the process as the target, this study used mathematical programming methods to find the optimum production parameters. The proposed method could be summarized into the following steps:
Step 1: Analyze the production system and identify the important factors of various processes.
Step 2: Select the appropriate experimental design matrix and determine the process factorial level combinations.
Step 3: Test according to Step 2.
Step 4: Find the individual process response equations using RSM statistical analysis.
Step 5: Establish the production system cost optimization model and use mathematical planning to find solutions.
Conclusion
Traditionally, the process parameters for producing rayon fiber are determined by trial and error in the chemical reaction process. However, the level of the parameters found lacks the optimization of consideration. This study combines experimental design and mathematical planning methods to obtain the optimization of the production parameters of the overall process of the coagulating bath recycle system in the production of rayon fiber. The response surface methodology was used provide an approximate mathematical equation to reflect the impact of various factors on the response. Meanwhile, the ranking priorities of the factors of the processes of the production system and the mutual relationships of factors could be identified. As for the regression equations obtained using response surface methodology, this study applied the mathematical programming method to find the solutions and derives the optimal values of the factors to minimize the costs under process conditions that were in line with the product requirements. Through the establishment of the process, it was possible to optimize the production parameters of the process rather than the production parameters of individual processes.