
International Journal of Earth Science and Geophysics
(ISSN: 2631-5033)
Volume 7, Issue 2
Research Article
DOI: 10.35840/2631-5033/1852

Article Formats
Sedimentation Rate Estimation and Tracing Organic Carbon and Nutrients Sources in Sediment of Ha Long Bay (Vietnam)
Table of Content
Figures

Figure 1: A sketch showing the study area....
A sketch showing the study area: Ha Long Bay in Quang Ninh, a northeastern coastal province of Vietnam. In the Figure 6 sampling sites (HL1 through HL6) are also shown.
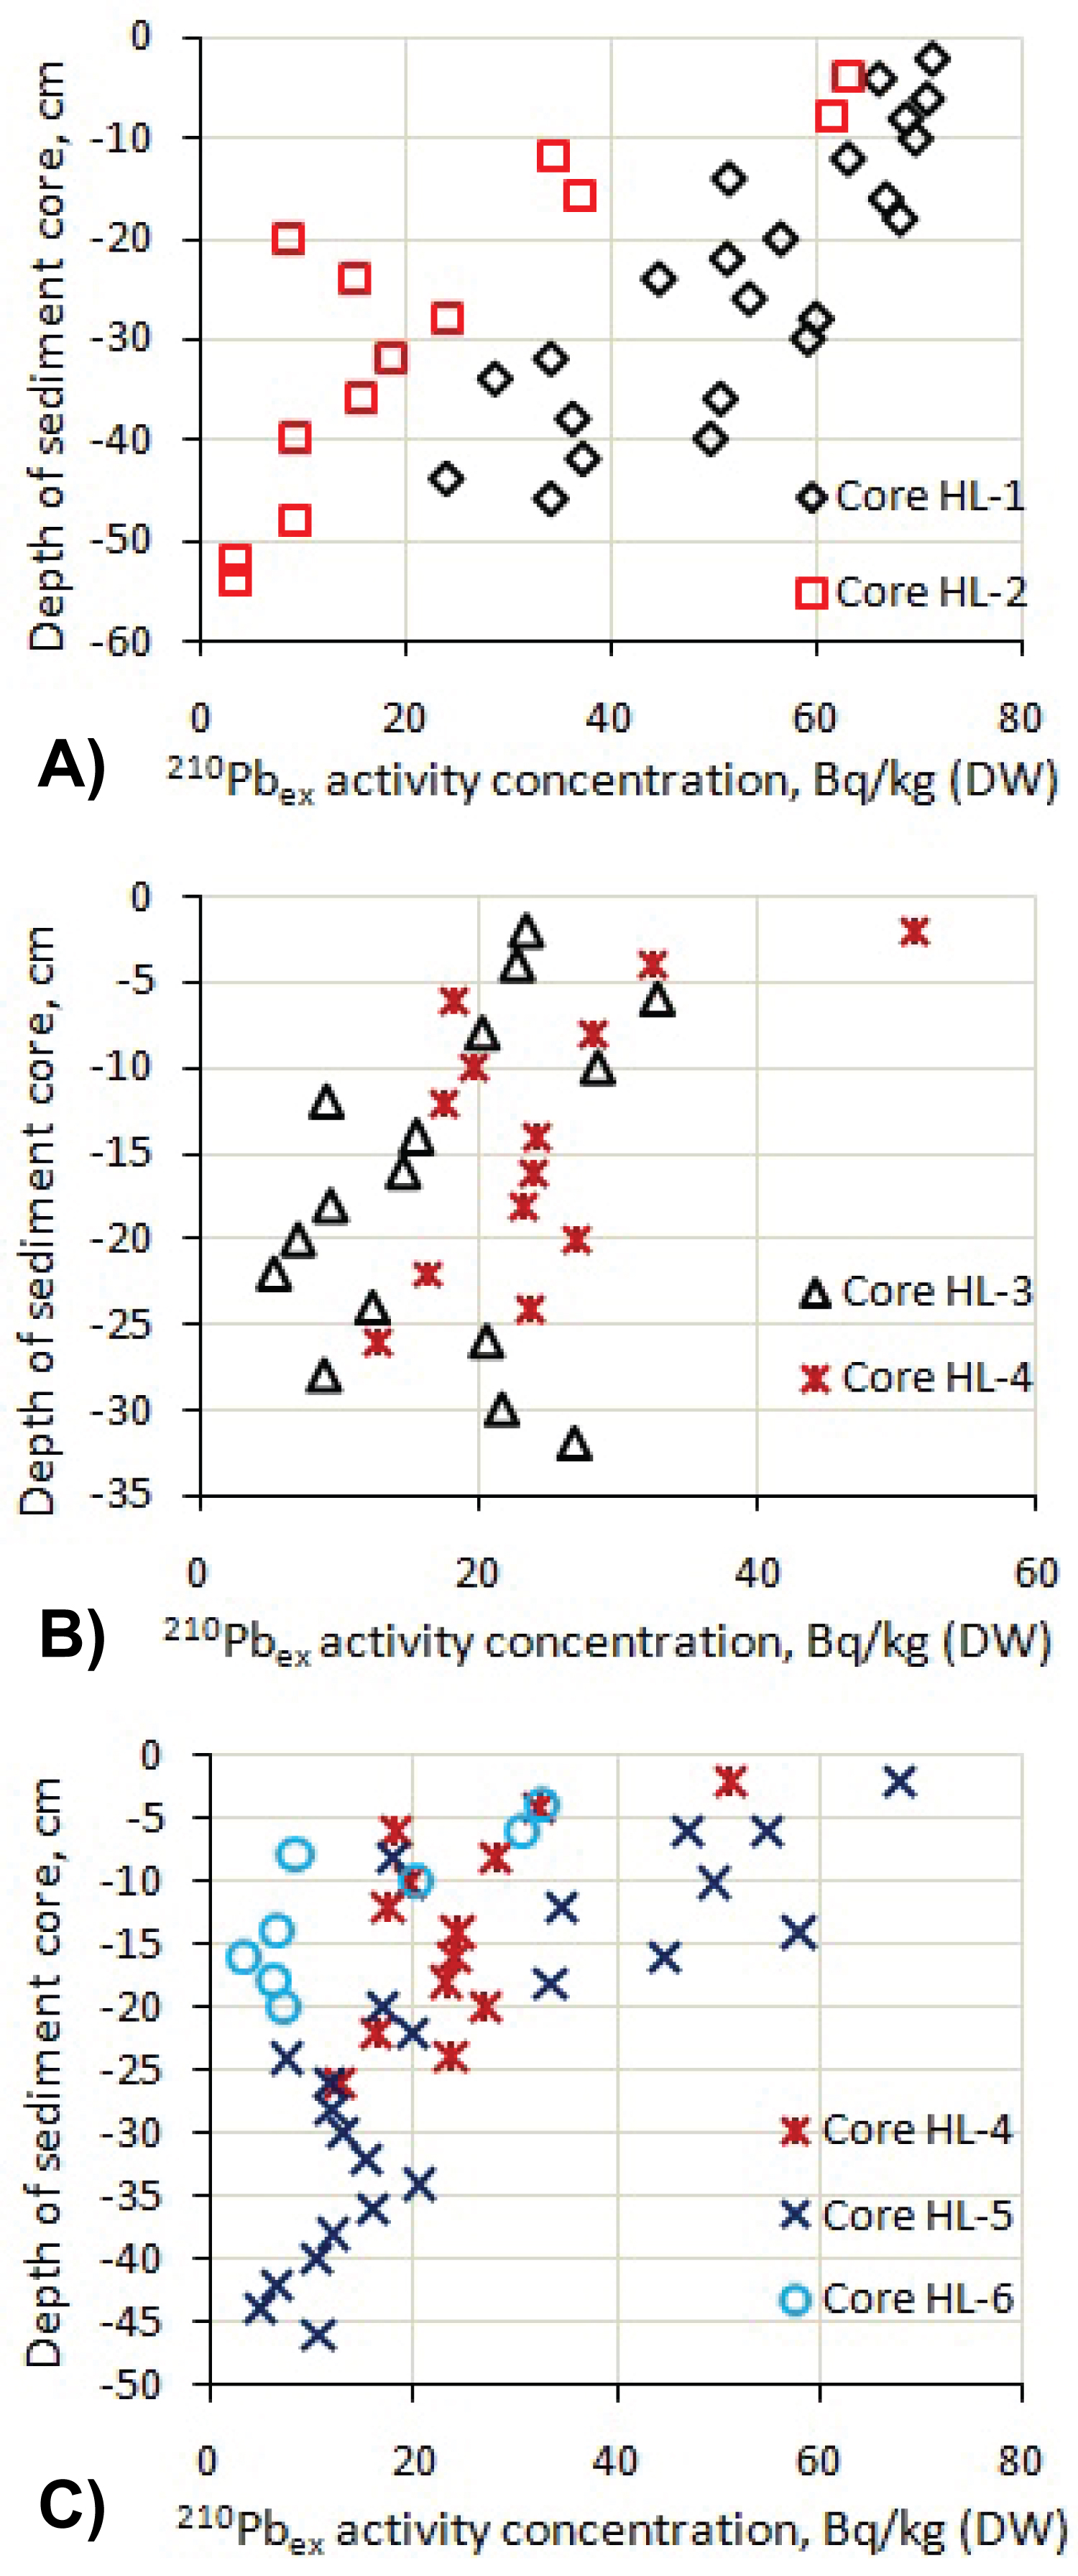
Figure 2: Variation of 210Pbex activity concentrations.....
Variation of 210Pbex activity concentrations along the depth of sediment cores taken along two transects: W-E (a) and (b) and SW-NE (c). Data in Figures are mean values with standard deviation (1σ) for counting rate not exceeded 10% (See Figure 1 for sampling sites).
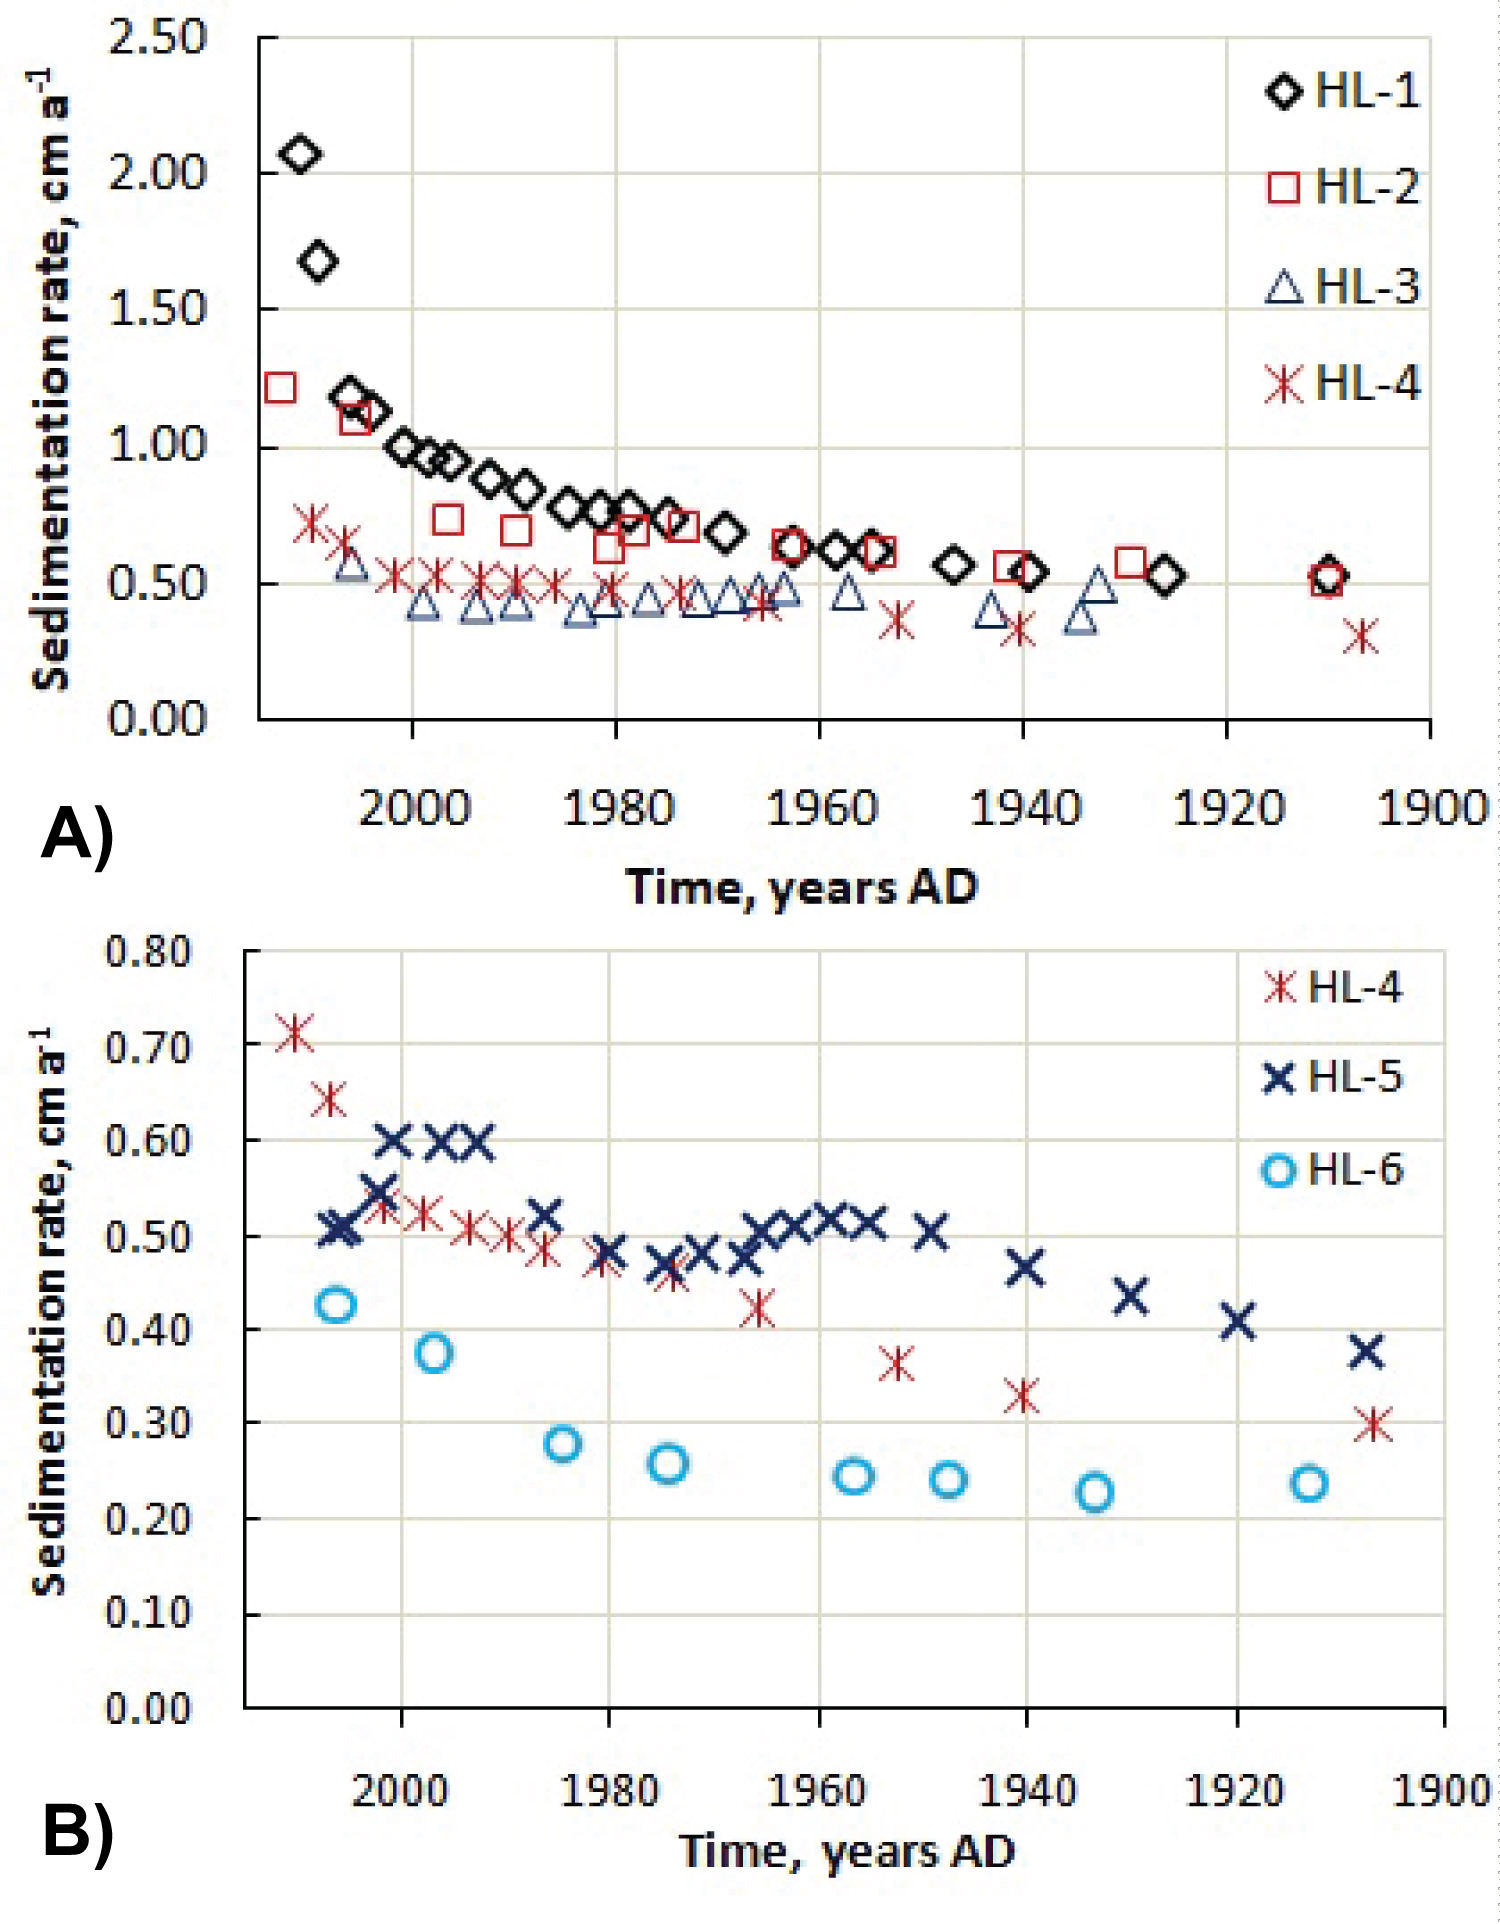
Figure 3: Temporal variation of SR in Ha....
Temporal variation of SR in Ha Long Bay along the W-E (a) and SW- NE transects (b) which was estimated by the 210Pbex-dating method.
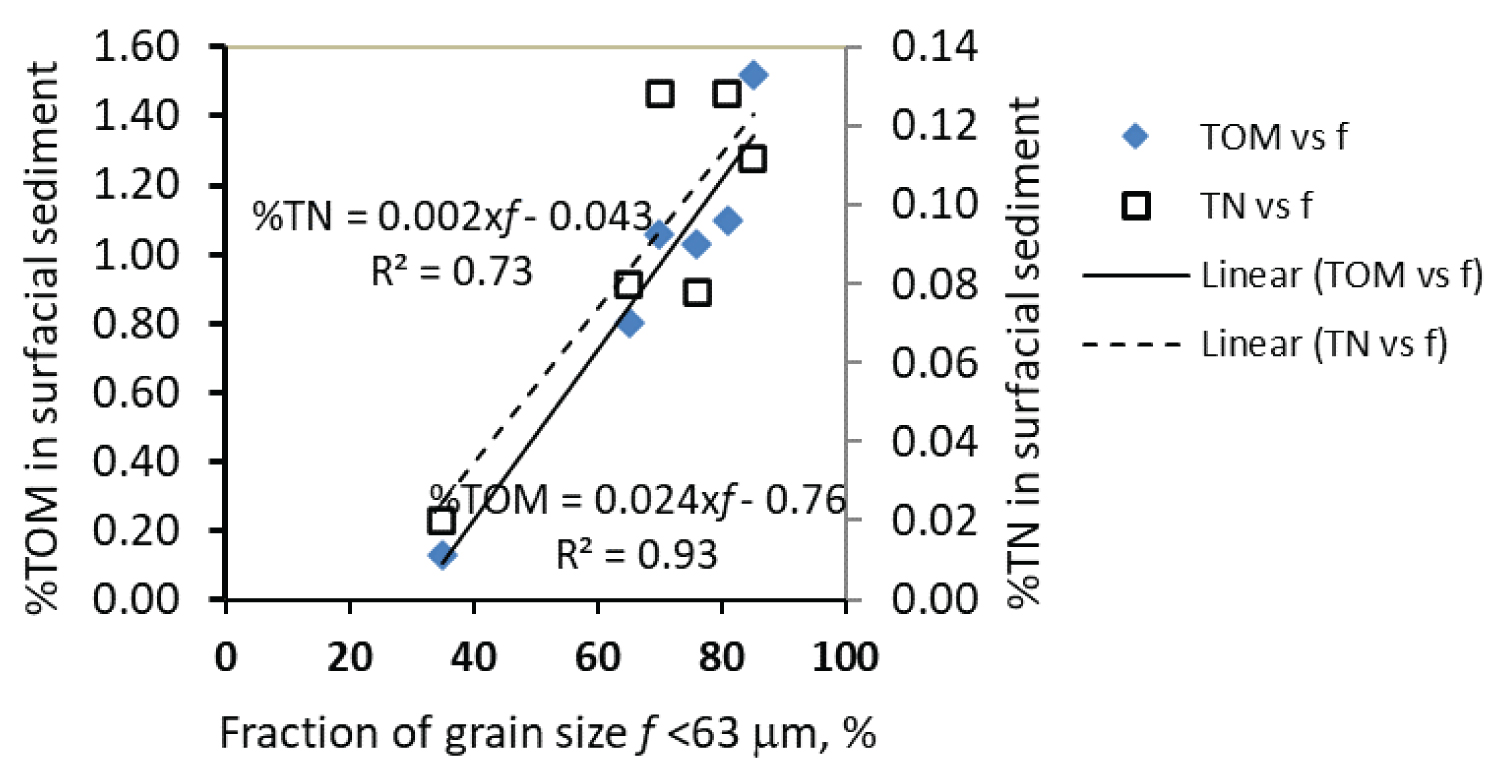
Figure 4: Correlation between %TOM....
Correlation between %TOM and %TN in the surficial sediment layer (0-4 cm depth) and the fraction (f) of fine-grain size, GS ≤ 63 μm.

Figure 5: New buildings have been constructed.....
New buildings have been constructed after bulldozing land from the coast of Ha Long Bay (Photo: F.P. Carvalho-a Portugish visiting scientist to study the ecology of Ha Long Bay).

Figure 6: Unstabilized coal tailings created.....
Unstabilized coal tailings created by the pit coal mining in the past around Ha Long-Hon Gai cities that could facilitate SR in Ha Long Bay due to erosion (Photo: F.P. Carvalho-a Portughish visiting scientist to study the ecology of Ha Long Bay).
Tables
Table 1: Content of nutrients (%TN, %P2O5), total organic matter (%TOM), elemental C:N ratios and isotopic signatures of carbon (δ13C) and nitrogen (δ15N) in TOM in surficial sediment layer (0-4 cm depth) of 6 sampling sites in Ha Long Bay (March, 2012). Standard deviations of %TN, %P2O5 and TOM was less than 15%, 20% and 10%, respectively, from the mean values.
Table 2: Sedimentation rate determined by the 210Pbex technique in the marine coastal regions of several Asian countries.
Table 3: A comparison of δ13C, δ15N in TOM in surficial sediment layer and estimated terrigenous carbon contribution (TC, %) to the marine coastal environment in Asian region.
Table S1: (Supporting material) Data of activity concentration of 210Pbex in 6 sediment cores taken from Ha Long Bay in dry season (Mar 2013) and the SR estimate of in different sites.
References
- Zhou Y, Jeppensen E, Li J, Zhang J, Zhang X, et al. (2016) Impacts of three Gorges reservoir on the sedimentation regimes in the downstream-linked two largest Chinese freshwater lakes. Scientific Reports 6: 35396.
- Kozerski H (1994) Possibilities and limitations of sediment traps to measure sedimentation and resuspension. Hydrobiologia 284: 93-100.
- Bloesch J (1994) A review of methods used to measure sediment resuspension. Hydrobiologia 284: 13-18.
- Krishnswami LD, Martin JM, Meybeck M (1971) Geochronology of lake sediments. Earth Planet Sci Lett 11: 407-414.
- Appleby PG, Oldfield F (1978) The calculation of lead-210 dates assuming a constant rate of supply of unsupported 210Pb to the sediment. Catena 5: 1-8.
- McCall PL, Robbins JA, Matisoff G (1984) 137Cs and 210Pb transport and geochronologies in urbanized reservoirs with rapidly increasing sedimentation rates. Chem Geol 44: 33-65.
- Ravichandran M, Baskaran M, Santschi PH, Bianchi TS (1995) Geochronology of sediments in the Sabine-Neches estuary, Texas, U.S.A. Chem Geol 125: 291-306.
- Mabit L, Klik A, Bennansour M, Toloza A, Geisler A, et al. (2009) Assessment of erosion and deposition rates within an Austrian agricultural watershed by combining 137Cs, 210Pbex and conventional measurements. Geoderma 150: 231-239.
- Mabit L, Benmansour M, Abril JM, Walling DE, Meusburger KAR, et al. (2014) Fallout 210Pb as a soil and sediment tracer in catchment sediment budget investigations: A review. Earth-Sci Review 138: 335-351.
- Zapata F (2002) Handbook for the assessment of soil erosion and sedimentation using environmental radionuclides. Kluwer, Dordrecht, The Netherlands 219.
- Frey DG (1969) Evidence for eutrophication from remains of organisms in sediments. In: Eutrophication, Causes, Consequences, Correctives. Natl Acad Sci, Washington, DC, USA, 594-613.
- Lei G, Daoji L, Zhan Y (2012) Nutrients and particulate organic matter discharged by the Changjiang (Yangtze River): Seasonal variations and temporal trends. J Geophys Res 117.
- Prahl FG, Ertel JR, Goni MA, Sparrow MA, Eversmeyer B (1994) Terrestrial organic carbon contributions to sediments on the Washington margin. Geochim Cosmochim Acta 58: 3035-3048.
- Wu Y, Zhang J, Liu SM, Zhang ZF, Yao QZ, et al. (2007) Sources and distribution of carbon within the Yangtze River system. Estuar Coast Shelf Sci 71: 13-25.
- Zhang J, Wu Y, Ittekkot-Jennerjahn V, He Q (2007) Distribution of organic matter in the Changjiang (Yangtze River) estuary and their stable carbon and nitrogen isotopic ratios: Implications for source discrimination and sedimentary dynamics. Mar Chem 106: 111-126.
- Ramaswamy V, Gaye B, Shirodkar PV, Chivas AR, Wheeler D, et al. (2008) Distribution and sources of organic carbon, nitrogen and their isotopic signatures in sediments from the Ayeyarwady (Irrawaddy) continental shelf, northern Andaman Sea. Mar Chem 111: 137-150.
- Meyers PA (1994) Preservation of elemental and isotopic source identification of sedimentary organic matter. Chem Geol 114: 289-302.
- Fengling Y, Zong Y, Lloyd JM, Huang G, Leng MJ, et al. (2010) Bulk organic d13C and C/N as indicators for sediment sources in the Pearl River delta and estuary, southern China. Estuar Coast Shelf Sci 87: 618-630.
- Struck U, Emeis K-C, Vossa M, Christiansen C, Kunzendorf H (2000) Records of southern and central Baltic Sea eutrophication in d13C and d15N of sedimentary organic matter. Mar Chem 164: 157-171.
- Emeis K-C, Neumann T, Endler R, Struck U, Kunzendorf H, et al. (1998) Geochemical records of sediments in the Gotland Basin-products of sediment dynamics in a not-so stagnant anoxic basin? Appl Geochem 13: 349-358.
- Vuong BV, Liu Z, Thanh TD, Huh C-A, Nhon DH, et al. (2016) Initial results of study on sedimentation rate, sediment source to the Ha Long Bay: Evidence for the 210Pb and 137Cs radiotracer. J Mar Sci and Technol 16: 46-53.
- Thu TQ, Son LT, Long NT, Ha DT, Luan TV (2013) Assessement of water quality at fish cages in the North of Vietnam. J Sci Devel 11: 996-1004.
- Li H, Song C, Cao XY, Zhou YY (2016) The phosphorus release pathways and their mechanisms driven by organic carbon and nitrogen in sediments of eutrophic shallow lakes. Sci Total Environ 572: 280-288.
- Mbabazi J, Inoue T, Yokota K, Saga M (2019) Variability of particulate bioavailable phosphorus, particulate organic carbon and nitrogen in agricultural and urban rivers. J Environ Chem Eng 7: 103086.
- Coble AA, Marcarelli AM, Kane ES (2015) Ammonium and glucose amendments stimulate dissolved organic matter mineralization in a Lake Superior tributary. J Great Lakes Res 41: 801-807.
- HLBMD (2000) Ha Long Bay introduction.
- Nguyen DN, Nguyen TH (2004) Climate and climate resources in Vietnam. Agri Publ House, Hanoi, Vietnam, 155.
- Uu DV, Huong HT, Lam PH (2007) Development of system of hydrodynamic environmental models for coastal area. Case study in Quang Ninh - Hai Phong region. Vietnam Natl Univ J Sci- Earth Sci 23: 59-68.
- Huynh S (2002) Hydrodynamic study of Ha Long Bay. Bc. Thesis, The University of Western Australia, Australia.
- JICA (2013) Project completion report on the project for environmental protection in Ha Long Bay. NIPPON Kokei Co., Ltd.
- L'Annunziata MF (1998) Handbook of radioactivity analaysis. Academic Press, San Diego, California, USA, 177-179.
- Nhan DD, Huy NQ, Quang NH (2014) Radioactivity measurement in environmental studies. Sci and Tech Pub House, Hanoi, Vietnam, 328.
- EPA method No. 1687, (2001) Total Kjeldahl nitrogen in water and biosolids by automated colorimetry with preliminary distillation/digestion. U.S. Environmental Protection Agency, Office of Water, Office of Science and Technology, Engineering and Analysis Division (4303), 1200 Pennsylvania Ave. NW, Washington, D.C. 20460, US.
- TCVN 8661 (2011) Soil quality-determination of available phosphorus-Olsen method. The Ministry of Sci Technol, Viet Nam Hanoi, Vietnam.
- Ogrinc N, Fontolan G, Faganeli J, Covelli S (2005) Carbon and nitrogen isotope compositions of organic matter in coastal marine sediments (the Gulf of Trieste, N Adriatic Sea): Indicators of sources and preservation. Mar Chem 95: 163-181.
- Keil RG, Montlucon DB, Ptalh FG, Hedges JI (1994) Sorptive preservation of labile organic matter in marine sediment. Nature 370: 547-552.
- National Institute for Urban and Rural Planning (2014) City development strategy for Ha Long. Final Report No. 68758, City Alliances-World Bank- Ministry of Construction of Vietnam, Hanoi, Vietnam, 204.
- World Bank in Vietnam (2011) Vietnam urbanization review. Technical Assistance report, Hanoi, Vietnam, 239.
- Nhon DH, Hanh VTT, Matthews J, Vuong BV, Huy DV, et al. (2016) Sediment deposition rate and sources of sediment materials supplied to Ha Long Bay within the last 150 years. J Vietnam Natl Univ Earth Sci Environ 32: 46-56.
- Hung GW, Yuchia C (1994) Sedimentation rates on the continental slope off eastern Taiwan. Mar Geol 119: 99-109.
- Huh C-A, Su C-C (1999) Sedimentation dynamics in the East China Sea elucidated from 210Pb, 137Cs and 239,240Pu. Mar Geol 160: 183-196.
- Taoyuan W, Zhongyuan C, Lingyun D, Wei J, Yoshiki S, et al. (2007) Sedimentation rates in relation to sedimentary processes of the Yangtze Estuary, China. Estuar Coast Shelf Sci 71: 37-46.
- Wang A, Gao S, Jia J (2007) Sedimentation rates in the Wanggang salt marshes, Jiangsu. J Geogr Sci 15: 199-209.
- Che Abd R, Mohamed, Mahmood ZUW, Ahmad Z (2008) Recent sedimentation of sediment in the coastal waters of Peninsular Malaysia. Poll Res 27: 27-36.
- Joseph B, Adiana G, Shazili NAM, Ong MC, Juahir H, et al. (2018) The Evaluation of Brunei Bay Sediment Cores Sedimentation Rate Using 210Pb Radiometric Dating Technique. Intl J Eng Technol 7: 107-114.
- Lamb AL, Wilson GB, Leng MJ (2006) A review of coastal paleoclimate and relative sealevel reconstruction using d13C and C/N ratios in organic material. Earth-Sci Review 75: 29-57.
- Hedges JI, Clark WA, Quay PD, Richey JE, Devol AH, et al. (1986) Composition and fluxes of particulate organic material in the Amazon River. Limmo Oceanogr 31: 717-738.
- Wu Y, Zhang J, Li DJ, Wei H, Lu RX (2003) Isotope variability of particulate organic matter at the PN section in the East China Sea. Biogeochem 65: 31-49.
- Hu J, Peng P, Jia G, Mai B, Zhang M (2006) Distribution and sources of organic carbon, nitrogen and their isotopes in sediment of the subtropical Pearl River estuary and adjacent shelf, South China Sea. Mar Chem 98: 274-285.
- Ruttenberg KC, Goni MA (1997) Phosphorus distribution, C:N:P ratio, and d13Coc in Arctic, temperate, and tropical coastal sediment: Tool for characterizing bulk sedimentary organic matter. Mar Geol 139: 123-145.
- Hedges JI, Oades JM (1997) Comparative organic geochemistries of soils and marine sediments. Org Geochem 27: 319-361.
- Middelburg JJ, Nieuwenhuize J (1998) Carbon and nitrogen stable isotopes in suspended matter and sediments from the Schelde estuary. Mar Chem 60: 217-225.
- Kendall C, Elliott EM, Wankel SD (2007) Tracing anthropogenic inputs of nitrogen to ecosystems. In: Michener R, Lajtha K, Stable Isotopes in Ecology and Environmental Science. Blackwell Publishing, 375-449.
- Barth JAC, Veizer J, Mayer B (1998) Origin of particulate organic carbon in the upper St. Lawrence: Isotopic constraints. Earth Plant Sci Lett 162: 111-121.
- Brandes JA, Devol AH (2002) A marine global marine-fluxed nitrogen isotopic budget: Implication for Holocene nitrogen cycling. Glob Bigeochem Cycles 67: 67-14.
- Altabet M (1996) Nitrogen and carbon isotopic tracers of the sources and transformation of particles in deep sea. In: Intekkot, Schaefer, Honjo, Depetris, Particles flux in the ocean. Wiley & Sons, Chishester, England, 155-184.
- Philipps DL, Gregg JW (2001) Uncertainty in source partitioning using stable isotopes. Oecologia 127: 171-179.
- Appelo CA, Postma D (2007) Geochemistry, groundwater and pollution. (2nd edn), A Balkema Publisher, Amsterdam, 649.
- Galy V, France-Lanord C, Lartiges B (2008) Loading and fate of particulate of organic carbon from Hymalaya to the Ganga-Brahmaputra delta. Geochim Cosmochim Acta 72: 1767-1787.
- Jia G, Peng P (2003) Temporal and spatial variations in signatures of sedimented organic matter in Lingding Bay (Pearl estuary), southern China. Mar Chem 82: 47-54.
- Gao X, Yang Y, Wang C (2012) Geochemistry of organic carbon and nitrogen in surface sediments of coastal Bohai Bay inferred from their ratios and stable isotopic signatures. Mar Poll Bull 64: 1148-1155.
Author Details
Dao Dinh Thuan1, Nguyen Quang Long2, Duong Van Thang2, Dang Duc Nhan2*, Ha Lan Anh2 and Nguyen Thi Oanh2
1Ha Noi University of Mining and Geology, North Tu Liem dist., Ha Noi, Vietnam
2Institute for Nuclear Sciences and Technology, 179 Hoang Quoc str., Ha Noi, Vietnam
Corresponding author
Dang Duc Nhan, Institute for Nuclear Sciences and Technology, 179 Hoang Quoc str, Ha Noi, Vietnam, Tel: (++)84-913-53-54-48.
Accepted: August 10, 2021 | Published Online: August 12, 2021
Citation: Thuan DD, Long NQ, Thang DV, Nhan DD, Anh HL, et al. (2021) Sedimentation Rate Estimation and Tracing Organic Carbon and Nutrients Sources in Sediment of Ha Long Bay (Vietnam). Int J Earth Sci Geophys 7:052.
Copyright: © 2021 Thuan DD, et al. This is an open-access article distributed under the terms of the Creative Commons Attribution License, which permits unrestricted use, distribution, and reproduction in any medium, provided the original author and source are credited.
Abstract
Sedimentation rate (SR) and sources of organic carbon, nitrogen and phosphorus nutrients in sediment of the Ha Long Bay (Vietnam) were estimated and assessed by the use of the 210Pbex technique and based on isotopic signatures of carbon and nitrogen (δ13C and δ15N) in organic matter presents in sediment. It was revealed that SR in Ha Long bay varied temporally and spatially. In the early 1900, SR ranged from 0.25 to 0.40 cm a-1, but it gradually increased up to 0.5-2.1 cm a-1 in recent years. SR in the Bay decreased from the coast seawards. The temporal variation of SR was attributed to anthropogenic causes whilst spatial variation of SR was attributed to the difference of sediment sources supplied to the Bay. Concentrations of nitrogen and phosphorus in sediment are correlated with each other (R2 = 0.86) implying the nutrients were from the same source. The δ13C in total organic matter (TOM) ranges from -26.58‰ to -24.78‰ and δ15N ranges from 4.45 to 5.56‰. The results obtained suggested significant contribution of terrestrial carbon of C3 plants into the aquatic environment of the Bay. The contribution of terrigenous organic carbon into the Bay was estimated to be as high as from 65 to 92%.
Keywords
210Pbex excess technique, δ13C, δ15N, terrigenous organic carbon, Ha Long Bay, Vietnam
Introduction
Nitrogen and phosphorus nutrients in the surface water environment exist in soluble ammonium (NH4+), nitrate (NO3-) and phosphate (PO43-) forms. Additionally, phosphate appears to be preferable to adsorbing onto sediments since it binds to Fe, Al, or Ca in the sediment that can be transported with the sediments to streams and ultimately to the estuaries or bays. Hence, sedimentation is usually associated with eutrophication in a receiving water body. In addition to the eutrophication, high sedimentation rate would facilitate aging process during which a lake, estuary, or bay evolves into a bog or marsh and eventually disappears. Therefore, determination of sedimentation rate was particularly essential in assessing the life expectancy of reservoirs, e.g., of hydro-power plants, and interval of time needed to dredge navigation channels in marine harbours.
There are several methods currently applied to estimate sedimentation rate (SR) in lakes or estuaries. These are traditional non-tracer and tracer methods. The traditional non-tracer methods are based on sediment budgets of streams which supplied sediment to lakes or estuaries [1] or by sediment traps installed within water columns [2,3]. The tracer technique in assessing sedimentation processes involves the use of fall-out radio-nuclides 210Pb, 137Cs, 7Be [4-9]. In this method, the radioactive isotopes are used as tracers to determine the age of a given sediment layer. Nulcide 210Pb is often applied in the SR estimation as it has a half-life of 22.3 years, long enough for monitoring sedimentation processes spanning up to century. The 210Pb method of sediment dating is based on the decay of the nuclide enclosed, i.e., unsupported by it's mother isotope, in a sediment core. Knowing the deposition time and depth of a certain sediment layer one could calculate the SR [10]. The tracer method has advantages over the traditional ones as it requires shorter time (during months) than those of the traditional methods (within years) to get results of the measurement.
Nutrients come to receiving water bodies from both natural and anthropogenic sources. Natural sources of nutrients in the aquatic environment could be from the decomposition of submerged plants or dead organisms in sediment [11]. However, the anthropogenic sources of nutrients that are usually related to people living in the coastal zone are of most concern because human-related inputs are much greater than natural inputs. Because there are increasingly more people living in coastal areas, there are more nutrients entering the coastal waters from wastewater treatment facilities, runoff from land in urban areas during rains, and from farming [12]. Understanding the sources of nutrients pollution inputs and their impacts on ecosystems is a major environmental concern in terms of the development of a long-term strategy for management of the aquatic environment along the coastal zones.
Isotopic compositions of carbon and nitrogen (δ13C and δ15N, respectively) and carbon to nitrogen (C:N) ratios have been widely used to elucidate the source and fate of organic matter in the marine environment [13-16]. The use of these tracers relies on the existence of gross differences among natural abundances of stable carbon isotopes, stable nitrogen isotopes and C:N ratios in organic matters from terrigenous and anthropogenic inputs and marine and freshwater in-situ inputs [17]. Yu, et al. [18] used δ13C and C:N ratios as indicators for sourcing organic matters in deltaic and estuarine sediments of the Pearl River (Southeastern China). Struck, et al. [19] used sedimentary records of the variation in organic carbon accumulation rates and δ13C and δ15N in the organic matters as proxy indicators for their study of the eutrophication and pollution in Baltic Sea. This approach has also previously been shown to be suitable for monitoring decadal to interannual trends of anthropogenic metal loads in Gotland Basin [20].
Investigating the mineralogy of bottom sediment in Ha Long Bay, Bui Van Vuong, et al. [21] have shown that the sediment accumulating in bottom of Ha Long Bay was derived not only from the local soil, but also from soil eroded inland and carried by the Red River and Thai Binh River systems. However, the temporal and spatial variations of sedimentation rate in the Bay were not systematically studied yet.
Tran Quang Thu, et al. [22] conducted surveys for the concentrations of N-nutrient and dissolved oxygen in water of the Bay. Results of these surveys revealed that water in the Bay is being contaminated with nutrients and concentration of dissolved oxygen has declined compared to that during early 2000. However, sources of nutrients as well as organic matter present in water and bottom sediment of the Bay were not yet identified. It is well known that organic matter in aquatic environments can be easily degraded under the sun light due to the light absorbing properties of the fraction of the colored dissolved organic carbon (CDOC) [23,24]. During the degradation of organic matters, a large amount of oxygen dissolved in water is consumed, and N and P are simultaneously released, thus leading to the eutrophication as well [23,25].
The aims of this study are to examine the SR in Ha Long Bay (Vietnam) and to trace sources of organic carbon and nutrients inputs in the Bay during the last century.
Materials and Methods
Study area and sampling sites
Study area: The study area was Ha Long Bay which is located in Quang Ninh, a northeastern province of Vietnam. The Bay is situated in the Gulf of Tonkin, in between latitude 20°43N to 20°56N and longitude 106°59E to 107°20E as its extremities (Figure 1). The overall area of Ha Long Bay is approximately 1,553 km2, within which 1,969 islands with a total land area of 562 km2 are located [26]. The Bay is relatively shallow with an average depth of 5-15 m during the neap tide and up to 8-20 m during the spring tide.
The climate in the study region is subtropical with a rainy season from May to October and a dry season from November to April. During the rainy season, precipitation ranges from 1,400 to 1,750 mm and from 150 to 300 mm during the dry season. The potential annual evaporation in the region is in the range of 700-800 mm [27]. The monthly average temperature varies between 16 ℃ and 35 ℃ with the lowest temperature in January and the highest in July [27].
The hydrodynamic regime of Ha Long Bay was studied by several researchers [28,29]. The Bay itself can be described as being relatively open indicating that water enter and exit through many pathways, maneuvering between many islands (Figure 1). However, it was shown that there are two large separate openings, one to the east and southeast, and another to the southwest, where tidal waters enters the Bay and exists from the nearby sea. The east and southeast opening has two deep channels: Lach Mieu and Cua Van, respectively (Figure 1), with approximately 15 km width and from 14 meters to 26 meters depth, by which ocean liners come in to ship coal for export. The southwest opening is the Cat Hai strait (Lạch Huyen channel in Figure 1) which is a comparatively narrower and shallower opening into Ha Long Bay. This single channel is approximately 12 meters to 14 meters deep spanning an estimated 2 km wide. The southwest opening is apparently under the influence from the hydrodynamics of the Red River and Thai Binh River systems (Figure 1) that discharge fresh water from inland contained in average as high as from 5.4 g m-3 and up to 145 g m-3 of suspended matter, in the dry and rainy seasons, respectively, carrying agrochemicals, nutrients as well as other contaminants to the Eastern (former South China) Sea [28].
Before 1980, Ha Long city was a small town with around 200,000 inhabitants living along the coast of the Bay. The main economy of the local inhabitants was fishing on the Bay and coal mining deeper inland. The income of the local inhabitants was very low, less than 50 USD a month per capita. However, since 1980 the policy of the country has been reformed creating new conditions for economic change in the city. The main economy in the region at present mainly relies on tourism services. The Bay was recognized by UNESCO as a World Heritage, so it became one of the famous places to visit for Vietnameses and foreigners. However, the fast tourism development but without appropriate measures for the environment management could cause deterioration of water quality in the Bay. It was reportedly that total 5 existing water waste treatment plants in the Ha Long City currently could treat only 15,100 m3 a day that is equal to around 41% of the total urban water waste release daily, but the rest amount of the waste was discharged directly into public water bodies after primary treatment by septic tanks [30].
Aquaculture with shrimp, oyster, clams and fish farming has been rapidly developed in Ha Long Bay since the last decades which likely has released a lot of excess feed and waste from the organisms that caused dissolved oxygen in water to decrease from 6.5 mg L-1 in 2005 to < 5 mg L-1 in 2012 [24]. During the same time period the concentration of nitrate and phosphate in the water increased from 0.03 mg L-1 to 0.08 mg L-1 and from 0.02 mg L-1 to 0.06 mg L-1, respectively [22].
Sampling sites and sampling procedure: Sampling campaigns were conducted along two transects. The first transect was West-Easterly (W-E), from Binh Huong creek mouth towards Cat Ba Island encompassing HL1, HL2, HL3 and HL4 sites (Figure 1). The second transect was Southwest-Northeasterly (SW-NE) along the coast from the Cat Ba island towards Cua Ong town encompassing HL4, HL5, HL6 sites (Figure 1). The site HL1 and HL2 were in the Binh Huong creek and it's mouth, respectively, whereas sites HL3, HL4, HL5, HL6 were from 3 to 5 km away from the coast. The distance from site HL4 to HL6 is around 40 km.
Sediment was taken from the sea bottom using a corer made from Popyvinylchloride (PVC) resin (outer diameter 60 mm, length 650 mm). After retrieving from the floor, the corers were washed out of the sediment adhered outside then wrapped in polyethylene (PE) bags. The sediment cores were preserved at -24 ℃ and transported to the laboratory in Ha Noi for further processing.
Laboratory treatment of samples
In the laboratory sediment cores have been first cut into slices of 2 cm thickness right before the ice thawed. Periphery sediment layers of 1 cm thickness was removed to avoid the cross mixing between sediment in the outermost layer of lower slices and those of upper slices during pushing the corers into the sea bottom. The samples were allowed to thaw at room temperature and then sieved through a silk sieve of 1 mm mesh with deionized water to remove large gravels and leaves. Sediment was allowed to settle and supernatant then decanted. This washing procedure was continued till the water was not turbid when 2-3 drops of silver nitrate solution was added indicating the salt in the samples was completely removed. This is necessary in order to avoid the correction for salt content in the report for the concentrations of nutrients and total organic matter (TOM) in samples analyzed. Samples were again allowed to dry at room temperature, then subjected to dry at 70 ℃ till unchanged weight. Subsequently, the samples were allowed to cool down then subjected to grind to particle size < 1 mm. These samples were stored in high density polyethylene (HDPE) bottles tightly capped and preserved at 4 ℃ till the analysis for 210Pbex activity concentration, nutrients and TOM. A portion of the dry sediment samples (~10 g) was wet sieved through a 63 mesh sieve to separate fractions of fine grain particles (≤ 63 μm) from coarse (> 63 μm) ones. The fine (< 63 μm) and coarse (> 63 μm) fractions were then dried and weighed to determine the proportion of the fine sediment fraction to the total amount of sediment.
Analytical methods
Sedimentation rate estimation: Because the Bay is bustling with marine transport, so it is expected that intensive disturbance of suspended matters would be occurred, i.e., deposition and resuspension, hence the model of constant rate supply (CRS) developed by [5] was adapted to estimate the sediment deposition time. According to the CRS model, the age (tz, a) of sediment layer at a depth z from the surface, in years, was determined as:
In Eq. (1) the number 32.18 is the quotient of the half-life of 210Pb (T1/2 (210Pb) = 22.3 a) to ln2; is the integrated excess lead-210 (210Pbex) in sediment core from surface to bottom; is the integrated 210Pbex below depth z to the bottom.
Sedimentation rate (SR) was estimated as:
SR (cm a-1) = Lz/tz, (2)
Where Lz and tz are the length (cm) and age (a) of the sediment section from surface to the depth z, respectively.
The term "excess" or "unsupported" lead-210 (210Pbex) is understood as the fraction of 210Pb in sediment that came into the sea bottom only from fall out, excluded the fraction of 210Pbsup"supported" from the decay of its progenitor, i.e., 226Ra eroded from rocks and incorporated into sediments. So
Activity concentration of supported 210Pbsup (Eq.3) in sediment was derived from the activity of 226Ra (T1/2 = 1,600 a) because the radioactivity measurement was managed by such a way that the two radionuclide could attain their secular equilibrium.
226Ra activity concentration determination
The activity concentration of 226Ra in sediment was quantified by γ-spectrometry via it's 214Pb and 214Bi progenies which emit photons of 609 keV and 352 keV (after β- decays) with half-lives of 26.8 min and 19.9 min, respectively. For this, the salt-free and dried sediment samples were tightly sealed off by epoxy resin in HDPE boxes for 3 weeks to attain the secular equilibrium between 226Ra and it's progenies then subject to gamma-activity counting on a γ-spectrometer equipped with a high purity germanium detector (HPGeD, Canberra, USA) possessing an energy resolution of 1.8 keV at the 1.33 MeV peak of 60Co. The counting time was 24 hours to ensure the counting error was not higher than 10%. The activity concentration of 226Ra in samples was calculated as the arithmetic mean of counting rate at the 609 keV and 352 keV energy lines then corrected for the counting efficiency of the detector.
Determination of total activity concentration of 210Pbtotal
The total activity concentration of 210Pbtotal, i.e. (210Pbex + 210Pbsup) in a sediment slice (Eq.3) was determined via the activity concentration of it's progeny, 210Po (T1/2 = 138 d). The analysis was carried out using α-spectrometry method as 210Po is a pure alpha emitter. The analytical procedure for determining 210Po activity concentration was described in detail elsewhere, e.g., in [31,32]. Briefly, it was as follows:
Twenty (20) mBq of 209Po-carrier free in HCl solution (Amersham, England supplier) as internal standard was spiked to 1-2 g dried at 70 ℃ and salt-free sediment samples. Note that the dry temperature must be kept below 100 ℃ because Po is easily volatile at temperatures higher than 80 ℃. Add 50 ml aqua-regia (HCl + HNO3, 3:1 v:v) and mix the content well then heat it on a hot sand plate at a temperature around 70-80 ℃ for 2 hours. Subsequently, add another 10 ml concentrate HF (PA grade, Merck, Damstardt, Germany) and continue to boil for 5-7 min. Finally, add 1 ml of concentrate HClO4 (PA grade, Merck, Damstardt, Germany) and boil away to dryness. The residue obtained was dissolved in 5 ml of HCl 0.5M, then heated the content at 50-55 ℃ for 15 min. The Fe3+ ions that were dissolved during the digestion were reduced by slowly adding ascorbic acid till the brown colour of the solution disappeared. The acidic solution was decanted to separate the silica residue that was not dissolved in the acids. The residue was rinsed thrice, each with 5 ml of deionized water. All the rinse water was combined with the digestive solution.
Polonium was separated from impurities such as Bi, Pb, Ra, U, Th and Ac by extraction with solvent containing 0.1% of Diethylammonium Diethyldithiocarbamate (DDTC, PA, Merck, Damstardt, Germany) in Chloroform (PA, Merck, Damstardt, Germany) and then back extracted with 5 ml of concentrated HNO3 (65%, PA, Merck). Evaporate the extract to dryness and dissolve the residue in 5 ml HCl 0.5M. Record the date of the Po separation and bring the solution into an electrolytic cell mounted with a fine polished silver planchet. Rinse the beaker thrice each with 5 ml of deionized water to ensure all polonium was completely transferred into the electrolytic cell. Put the cell into a warm water bath (70-80 ℃) and allow Po to self-deposit onto the silver substrate for 3 hours, occasionally agitate the content in the cell. After the electrolysis completed, the silver planchet with Po deposited on the surface (Po source) was taken out from the cell. Rinse the source with iso-propanol, dry it in a desiccator waiting for alpha activity counting. The activity of polonium was measured on an α-spectrometer (ORTEC, USA) equipped with a passivated implanted planar silicon (PIPS) detector with an active area of 450 mm2 for 24 hours. The activity concentration of 210Po in the sample was calculated by comparing it's activity at the 5.30 MeV peak with those at 4.88 MeV of 209Po internal standard. The radiochemical recovery of the procedure was estimated as high as from 90% to 103%. The minimum detectable activity of the procedure was as low as 2 mBq kg-1.
Determination of nitrogen, phosphorus nutrients and total organic matter contents in sediment: Total nitrogen (TN) in salt-free and dry sediment was analyzed by the Kjeldhal method [33]. An aliquot of 2-3 g of dry salt-free sediment from each slice was subject to wet digestion with concentrated H2SO4 (PA, Merck) in presence of CuSO4.5H2O as the catalyst, then the mixture was made alkaline by adding NaOH pellets (PA, Merck) to pH = 10-11. Ammonia formed was distilled out by allowing hot vapour to pass through the digestion flask and trapped it in boric acid solution of 0.1M. The excess of the acid was titrated against by NaOH 0.01N solution. Results were reported in percent of %TN.
Available phosphorus in dry salt-free sediment was determined using the Olsen method [34]. Five gram of the samples was subject to extraction with 100 ml solution of NaHCO3 0.5M (pH = 8.5) for 30 min on a horizontal shaker. The extract was separated from sediment by filtration through a GF/F Whatman filter. If the filtrate was not clear, add some grams of activated carbon to it and agitate for 30 min till the filtrate becomes clear. The concentration of P in an aliquot of the extract was quantified by spectrophotometric method using solutions of molybdate ammonium, antimony potassium tartrate and ascorbic acid (pH = 4) to develop the color. The spectrophotometry was carried out at λ = 882 nm and the content of P in sediment samples were reported in percent of P2O5 (% P2O5). Calibration curve for this analysis was made by the use of K2HPO4 (PA, Merck) solutions of different concentrations.
Total organic matter content (TOM) in sediment was determined based on the loss on ignition (LOI). About 5 g of the dry and salt-free sediment was subject to combustion at 500 ℃ for 2 hours. The TOM content was determined by the weight loss and expressed in %TOM. Data of %TOM and %TN in surficial sediment layers (0-4 cm depth) were used to calculate the C to N ratios in each sampling site.
Determination of isotopic signatures of nitrogen and carbon in TOM: Prior conducting analyses for isotopic signatures of carbon and nitrogen in TOM, the salt-free dry sediment samples were treated with HCl 1M until effervescence had ceased to completely eliminate calcite (CaCO3) then washed with deionized water and finally dried at 105 ℃ overnight. Isotopic signatures of 13N and 13C were expressed in the delta notation (δ15N and δ13C) and determined as:
Where 15Rsample, 13Rsample are relative concentrations of heavier to lighter isotopes of nitrogen ([15N]/[14N]) and carbon ([13C]/[12C]) in a sample under the analysis, and 15Rstd, and 13Rstd are the same ratio but in standards, respectively. The standards used in the nitrogen isotopic signature determination is the ambient air but that for carbon it is VPDB (Vienna PeeDee Belemnite), it is a marine carbonate mineral of the PeeDee formation from the Cretaceous age taken from South Carolina (USA) and supplied by the International Atomic Energy Agency in Vienna, Austria.
A continuous flow isotope ratio mass spectrometer (CF IRMS, IsoPrime, GV Instruments, UK) equipped with an Eurovector elemental analyzer (EA 3000, Eurovector, Italy) was used in this study to measure the δ15N and δ13C in TOM present in sediment samples. Procedures applied for analyzing the stable isotopic signatures of N and C were implemented as per the supplier's manual. Briefly, it was as follows:
Around 100 μg of the dry, salt- and calcite-free sediment samples were wrapped in tin capsules and loaded into the autosampler of the IRMS and then were lowered into the EA for combustion at 1050 ℃ with oxygen to convert organic matters in the samples into CO2 and N2. The EA was packed with chromium oxide and cobaltous silver oxide as the catalysts. Nitrogen and CO2 gasses formed in the combustion tube were carried by a continuous flow (CF) of He-carrier gas through a chromatographic column (GV Instruments, UK) to purify from contaminants presented and to separate N2 from CO2 before it entered the ionization chamber of the CF IRMS where the gases were ionized. The flow of He-carrier gas carried the N2+ and CO2+ ions into the mass separator of the IRMS where masses 28 (14N2+) and 29 (15N14N+) as well as masses 44 (12CO2+) and 45 (13CO2+) were separated from each other. The ions with different masses were collected and counted by the respective Faraday cups installed on the exit from the mass separator. As controls, tins were run to detect and, if needed, correct for background δ13C and δ15N values. The isotopic ratio analyses were carried out in parallel for samples and the standard under the same combustion conditions. The computer program MassLynx (GV supplier) was used to calculate the ratios of [15N14N] to those of [14N2] and [13C16O2] to [12C16O2], i.e., and for sample and standard based on the counting numbers of ions with masses 29 and 28, and 45 and 44 relative to nitrogen and carbon dioxide, respectively. The δ15N and δ13C were then calculated using the same MassLynn software based on the Eq. (4) and Eq. (5), respectively.
The isotopic signatures analyses were conducted at the Institute for Nuclear Sciences and Technologies, Ha Noi, Vietnam. Samples of an internal reference material were analyzed after every eight samples to calibrate the system and to compensate for drift over time. The internal reference material used was Bovine Liver (BL) Standard (1577b; US Department of Commerce, National Institute of Standards and Technology, Gaithersburg, MD 20899, USA) with known values of δ13C, δ15N. The analytical precision was based on the standard deviation of replicates of the internal standard (BL) and was better than 0.2‰ for both δ13C and δ15N.
Results of the δ15N and δ13C analyses in this study were reported in per mill (‰) relative to the ambient air and VPDB standards, respectively.
Results
Figure 2 depicted the variation of 210Pbex activity concentrations along the depth of sediment cores taken from the W-E and NE-SW transects. Based on results shown in Figure 2a, Figure 2b, and Figure 2c the sedimentation rate (SR, cm a-1) in each sampling site was calculated based on the Eq. (2). Results of the calculation were presented in Figure 3a and Figure 3b for transect W-E and NW-SE, respectively. Data to build Figure 2a, Figure 2b, Figure 2c and Figure 3a, Figure 3b are shown in separate Supplementary Table S1.
As seen from Figure 3a and Figure 3b, SR in the Ha Long Bay has gradually increased since early of the XX century. During this time period, from 1910 to 1945, SR in locations HL1, HL2, HL3, HL4 along transect W-E was as low as around 0.50 cm a-1 (Figure 3a). Along transect SW - NE, SR in sites HL5 and HL6 was 0.50 and 0.25 cm a-1, respectively (Figure 3b). Yet, in recent years the SR increased up as high as 2.10 cm a-1 in site HL1, 1.21 cm a-1 in HL2, 0.71 cm a-1 in sites HL3 and HL4. In sites HL5 and HL6, SR increased up to around 0.60 and 0.50 cm a-1, respectively.
Figure 4 presented the relationship between %TOM and %TN and fraction (f, %) of fine-grain size sediment (≤ 63 μm). Results in Figure 4 represent for the surficial sediment layer from 0 to 4 cm depth. As seen from Figure 4 the %TOM and %TN were closely correlated with the f indicating a fact, that organic carbon and materials containing nitrogen nutrient associated with fine grained sediment particles. This result was in good agreement with those found by other researchers, e.g., [16,35]. Organic matters are known to associate with fine-grained sediment because of its larger surface area which provides good binding sites for organic matters [17,36].
Table 1 presents contents of %TN, %P2O5, %TOM, C:N ratios, δ13C and δ15N values in TOM for the surface (0-4 cm depth) sediment layers. In this study, the C:N ratios and δ13C as well as δ15N in TOM in sediment layers deeper than 4 cm were not determined. This is because hydrogeochemical processes as well as microbial mineralization of organic matter under anaerobic conditions in deep sediment layers would occur at different rates compared to those in the surface (fresh sediment) layers. The difference in the rate of mineralization leads to the so-called kinetic effect of isotopic fractionation which could make the δ13C and δ15N values as well as C:N ratios in TOM in deep sediment layers to deviate from the trend observed in the surface layer, so that the effect could blur the sources of nutrients and organic matters in the past.
Discussions
Temporal and spatial variation of sedimentation rate in the Ha Long Bay
It was a clear trend that SR in Ha Long Bay was gradually increased during the last century (Figure 3a, Figure 3b and Figure 3c). The increase in SR in the Bay could be due to several reasons. Firstly, it could be the poor land use management inland. The intensification of crops farming associated with frequent soil tillage that was often practiced by Vietnamese farmers could facilitate soil erosion from agricultural lands, particularly under the tropical conditions with heavy rain falls in the rainy season. This soil carried by the Red River and Thai Binh River and discharged the estuaries, but partly the Bay.
The second reason for the SR increase in the Bay could be due to the deforestation around the bay area. A significant temporal variation of SR was found in location HL1 where it increased gradually from 0.50 cm a-1 in 1910 up to 2.10 cm a-1 in 2010, i.e., 4 times during the century (Figure 3a). The site HL1 is surrounded by forests. It seems that deforestation in slope hills facilitated runoff carrying sediment into Binh Huong creek and building up the area of site HL1. It was reported that in 1990 the area of natural forest around Ha Long city (Figure 1) was about 5,000 ha but it was decreased to less than 1,200 ha in 2010 [37].
The third reason causing SR in Ha Long Bay to increase could be the intensive urbanization in that area during the last decades. Recent surveys conducted with the support from the World Bank in Vietnam showed that the average urbanization rate in whole Vietnam was 3.04% a year during the 1980-2010 period, while during the same time period in the Ha Long city (Figure 1) this rate was 3.5% [38]. The urbanization needs to bulldoze land for construction, this would result in the increase of soil erosion. Figure 5 shows a new urban area which has been constructed after bulldozing land from the coast of Ha Long Bay.
Results in Figure 3a showed that in recent years SR along the W-E transect decreased seawards from site HL1 to site HL4 implying important contribution of terrigenous sediment sources to the sediment budget in the Bay. Along the SW-NE transect SR in site HL5 was higher than that in site HL6. Site HL5 is in front of a coal mining area (Figure 1) while HL6 is far outside that area and around this site there is no agricultural activity. This indicates a fact that open pits coal mining, that was practised in the past, contributed soil from the unstabilized tailings into the Bay (Figure 5).
Interestingly to note that for site HL5 it was observed two peaks of SR, the first was within 1960-ies and the second was within 2000-ies (Figure 3b). Within the 1960-ies there was the heavy time of the Vietnam-America War and the coal mining activity in that region was dropped, consequently the SR in the Bay was decreased. The SR has been increased again since 1980-ies because this time the economic policy of the country was changed to the so-called "open door" that needed more coal for energy production leading to the SR increase. However, since the 2000-ies coal mining technology has been shifted from open pits to underground that would reduce the amount of coal tailings to be eroded to the Bay.
Studying SR in the center of the Bay (cross point in Figure 1) using the 210Pbex technique, Dang Hoai Nhon, et al. [39] have found a SR range there to be 0.21-0.78 cm a-1 with an average of (0.45 ± 0.17) cm a-1, that was comparable to that found in this study for site HL4, around 3 km from the cross marked site. A comparison of SR found in other marine coastal regions in Asia revealed that the SR in the Ha Long Bay was within the same range as shown in Table 2.
Relation between nutrients and organic matter in sediment
From results presented in Table 1 one can build a relationship between %TN and %P2O5 in surficial sediment layers of 0-4 cm depth for 6 sampling sites. It was revealed that contents of the two nutrients closely correlated with each other as shown in (Eq. 6).
[%TN] = 1.43 × [%P2O5) + 0.013, R2 = 0.86 (6)
The positive correlation between %TN and %P2O5 (Eq. 6) implies that nitrogen and phosphorus nutrients in sediment of the Bay originated from similar sources. Similarly, results in Table 1 also showed that %TN and %P2O5 closely correlated with %TOM following the models (Eq. 7) and (Eq. 8), respectively.
[%TN] = 0.018 × [%TOM] + 0.055, R2 = 0.77 (7)
[%P2O5] = 0.009 × [%TOM] + 0.032, R2 = 0.64 (8)
The close and positive correlations of %TN and %P2O5 with %TOM (Eqs. 7, 8) imply a fact that nutrient-containing materials associated with organic matters.
Sources of organic matter in Ha Long Bay
C:N ratios: The elemental C:N ratio of undegraded marine phytoplankton is generally close to 7 while vascular plants inland are N-depleted and have C:N ratios exceeding 12 [46]. Terrestrial materials can have a wide range of C:N ratios; characteristic ranges are 175-400 for wood, 20-50 for tree leaves, and 25-80 for grass and herbaceous plants [47]. In Ha Long Bay the range of C:N ratios for surficial sediment in sites HL1, HL2, HL3, HL4 (see Figure 1 for locations) are within 12.4 to 30.4 (Table 1) indicating the contribution of organic matters of terrestrial origin in these sites is dominant. On the other hand, in site HL5 and HL6 (see Figure 1 for locations) the C:N ratios are 12.5 and 6.8, respectively, suggesting the contribution of marine organic matter be likely dominant. However, the C:N:P ratios for sediment in sites HL5 and HL6 are much lower than the Redfield Ratio of 106:16:1 characterized for marine phytoplankton. Sediment with C:N:P lower than the Redfield Ratio has also been reported from other tropical river mouths [48,49]. The low C:N ratios in these areas have been ascribed to anthropogenic or natural causes like preferential sorption of inorganic N or bacterially derived components of organic matter in the sediment [50]. The low C:N ratios in sites HL5 and HL6 could also be due to the supply of suspended sediment having low C:N ratios by springs or runoff. Hedges and Oades [51] suggest that organic matters derived from soils can have low C:N ratios because soil microbes are nitrogen rich and bacterial and fungal dominated populations can have C:N ratios of 5:1 and 15:1, respectively. It could be true that soil supply from runoff to sites HL5 and HL6 is a major cause making the C:N ratios there to be low.
Carbon stable isotope signature (δ13C) in TOM: The δ13C values for marine particulate organic matters typically range from -22‰ to -18‰ [52,53] whilst fluvial δ13C is a mixture of freshwater phytoplankton having values from -25‰ to -30‰ and δ13C in particulate terrestrial organic matters range from -25‰ to -33‰ [52-54]. Results of δ13C in TOM presented in Table 1 indicate a significant terrestrial source of organic matters in sediment, the influence of which decreases away from the coast. Along the W-E transect, δ13C in TOM are -27.53‰, -25.21‰, -24.18‰ and -21.32‰, respectively, in sites HL1, HL2, HL3, and HL4. For sites HL5 and HL6 the δ13C in TOM are -24.58‰ and -22.22‰. The carbon stable isotope signatures in TOM found in Ha Long Bay are distinctly depleted compared to typical marine values indicating influence of terrestrial organic matter over the study area.
Nitrogen stable isotope signature (δ15N) in TOM: Marine organic matters usually have mean δ15N values of 5 to 7‰ as derived from phytoplankton which normally use dissolved nitrate [46,55]. Some marine phytoplankton like Trichodesmium use nitrogen fixed from the atmosphere, hence the δ15N value of the organic matter derived from them is close to zero [56]. Organic matter derived from nitrogen fixing land plants has δ15N values around zero, whereas plants using only mineral N from soil (NO3-, NH4+) usually have δ15N values of 2.5‰ to 5‰ [53]. In Ha Long Bay the δ15N values in TOM were found for the surficial sediment layer to vary within a narrow range, from 3.26 to 4.68‰ (Table 1) that is distinctly lower than that normally found in marine sediment (5-7‰) but comparable with those in soil, indicating the contribution from soil inland.
Contribution of terrestrial carbon
To assess the relative proportions of terrestrial and marine organic carbon present in the sediment, a simple δ13C-based two end-members mixing model based on the model developed by Philipps and Gregg [57] has been applied to this study area. The equation used is as follows:
Where TC(%) is the terrestrial carbon contribution, in %
δ13Corg is the δ13C measured of a given sediment sample, in ‰
δ13Cmarine is the δ13C of marine end-member, in ‰
δ13Cterrestrial is the δ13C of terrestrial end-member, in ‰
As the data of carbon stable isotope signature in marine phytoplankton within Ha Long Bay area were not available, so the δ13Cmarine (in Eq. 9) was taken to be -20.5‰ from the report of [16]. This is possible because the hydrological regime and climate over the Ayeyarwady shelf (Myanmar) are expected to be similar to that in Ha Long Bay. Appelo and Postma [58] reported that organic matter from C3 plants in tropical regions, like Vietnam, have an average δ13C of -27‰. This value was taken as the δ13Cterrestrial for the calculation in the Eq. 9.
The contributions of terrigenous organic carbon to TOM in marine sediment of Ha Long Bay estimated based on the Eq. (9) with the given δ13Cmarine of -20.5‰, δ13Cterrestrisl of -27‰ and measured δ13Corg (Table 2) show as high as 92.8%; 80.2%; 70.5%; 63.4%; 82.3% and 60.8% for sites HL1, HL2, HL3, HL4, HL5 and HL6, respectively. This finding confirms the suggestion on the importance of terrigenous organic carbon in sediment based on the C:N ratios and δ15N values discussed previously. This means that nutrients from allochthonous sources also have an important contribution to the aquatic environment in the Bay as it is strongly associated with organic matter bound to fine-grained sediment particles. Table 3 presents a comparison of the δ13C, δ15N values in TOM and terrigenous carbon contribution to the marine coastal environment in the Asian region.
Conclusion
Sedimentation rate in Ha Long Bay was temporally and spatially varied during the last century, from 0.25 cm a-1 in early 1900 up to 2.1 cm a-1 in recent years. The variation in SR was affected by improper farming practices, deforestation or coal mining combined with the intensive urbanization. Total nitrogen content in sediment of Ha Long Bay is closely correlated with P-nutrient content as well as with TOM indicating the same sources of nutrients which are associated with organic matter. The organic matter content closely correlated with the fractions of fine-grained sediment. This made the organic matter and nutrients to be able to transport far away from its sources and ultimately it was buried in the ocean. The organic matter in sediment of Ha Long Bay was determined to be generated mostly, from 65 to 91%, from terrigenous sources.
Acknowledgement
The financial support from the Ministry of Science and Technology of Vietnam under grant No. DTCB/11/04-03 is acknowledged.
Declaration of Interest Statement
The authors declare no conflict of interest.