
International Journal of Earth Science and Geophysics
(ISSN: 2631-5033)
Volume 6, Issue 2
Research Article
DOI: 10.35840/2631-5033/1842

Article Formats
Assessing the Impact of Rainfall Variability on Teff Production and Farmers Perception at Gubalafto District, North Eastern, Ethiopia
Table of Content
Figures
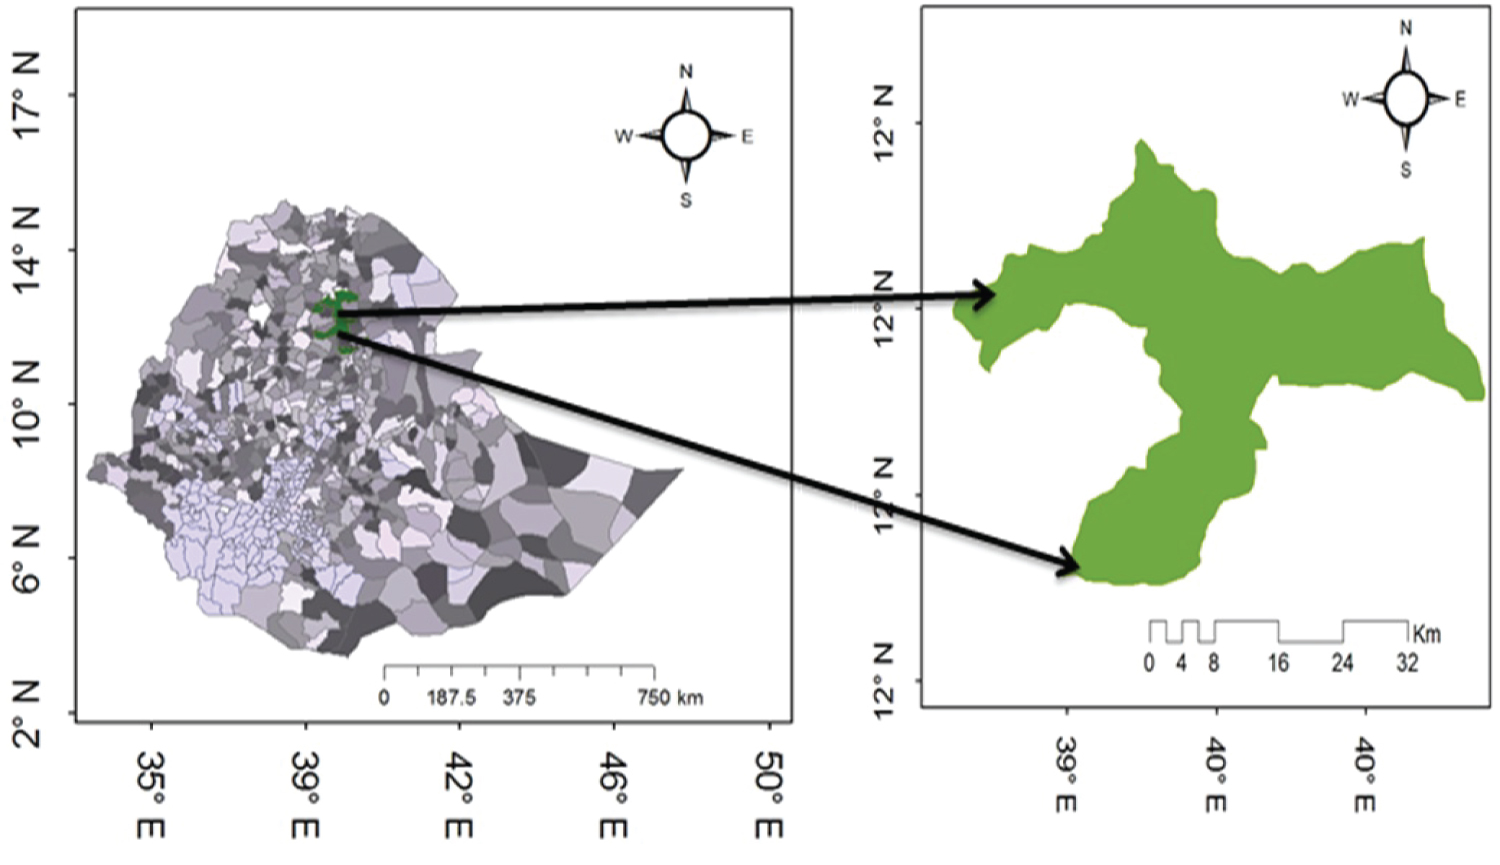
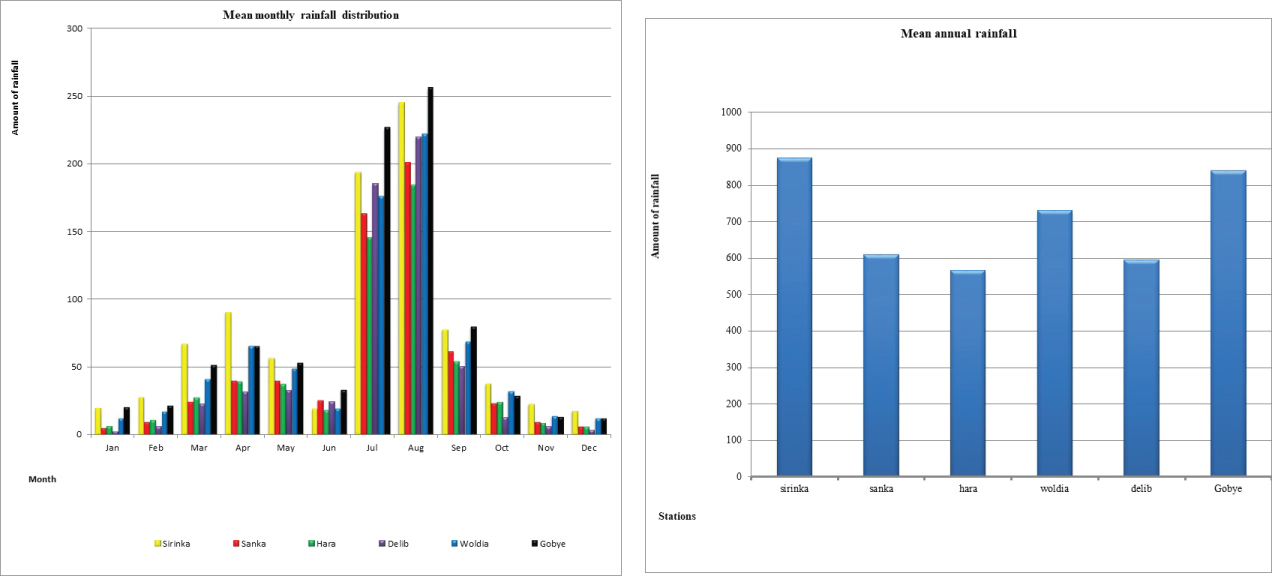
Figure 2: The mean monthly and annual rainfall.....
The mean monthly and annual rainfall at Gubalafto district.
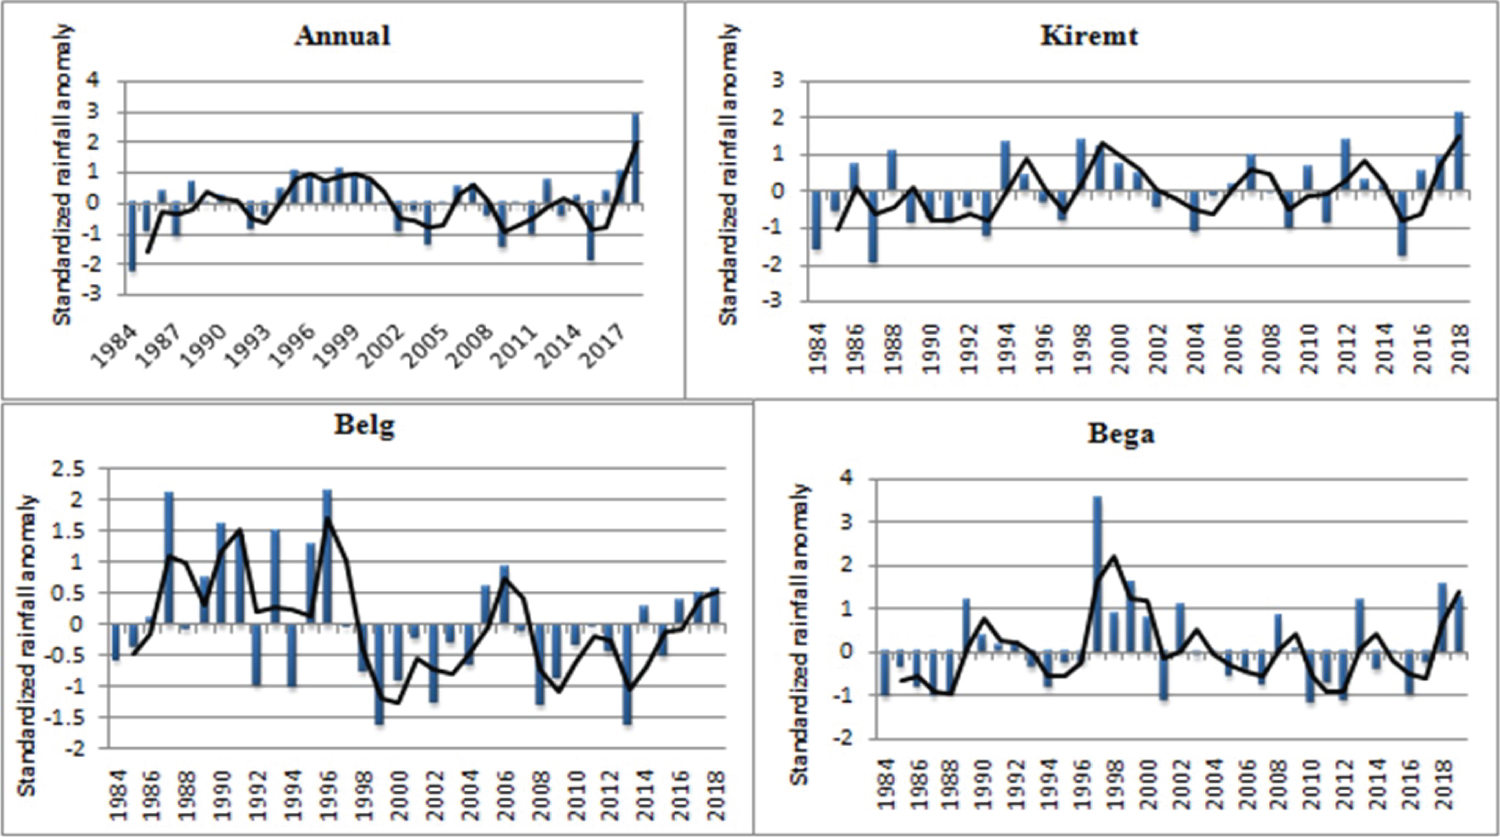
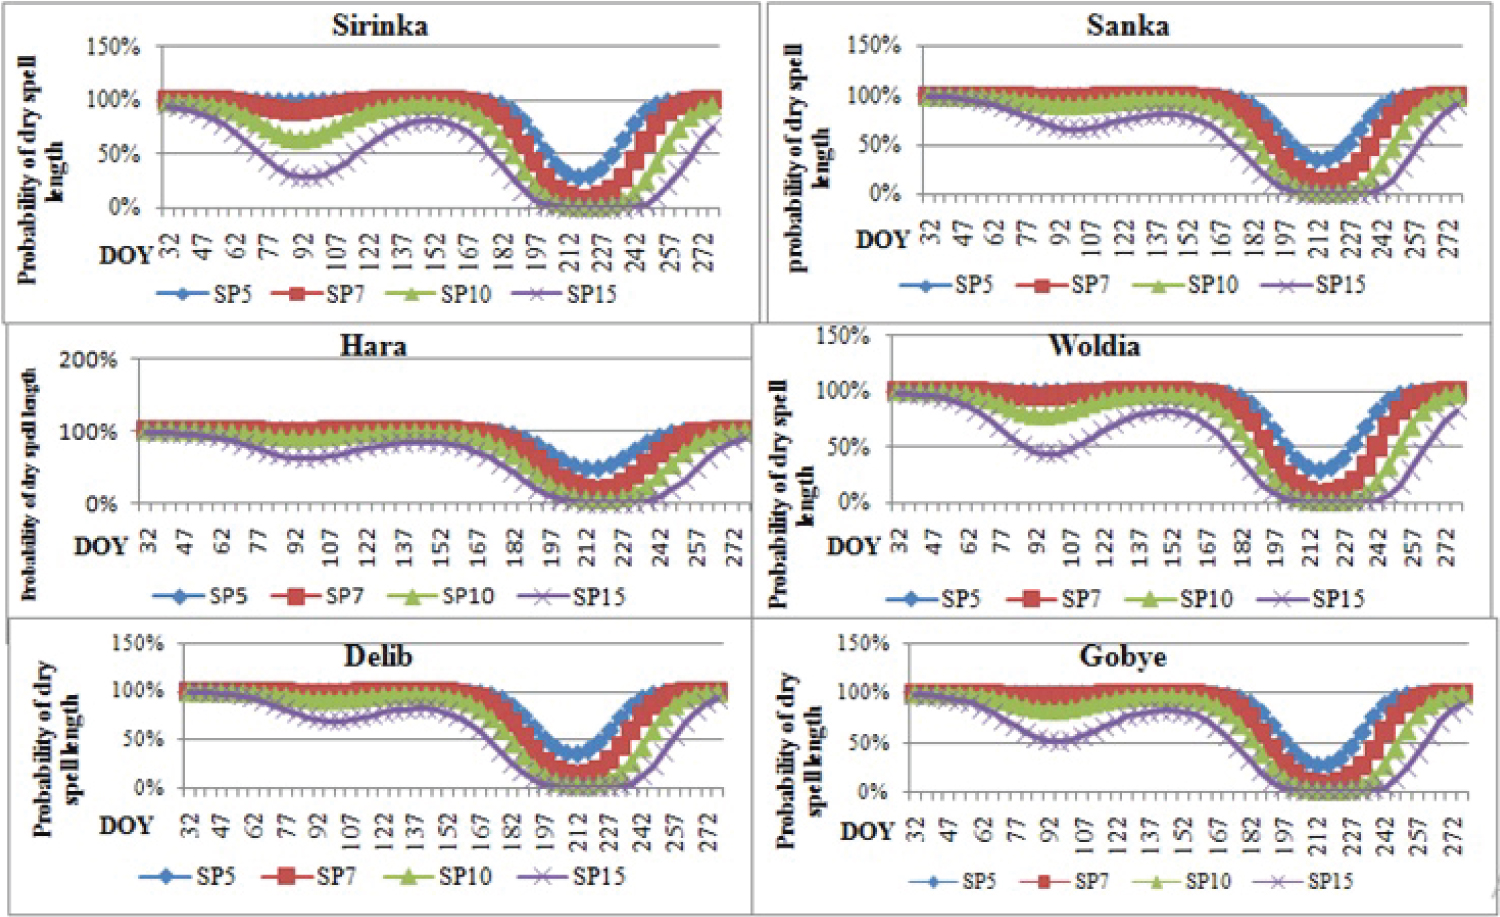

Figure 5: The spatial distribution of annual and seasonal....
The spatial distribution of annual and seasonal rainfall distribution in the study area.

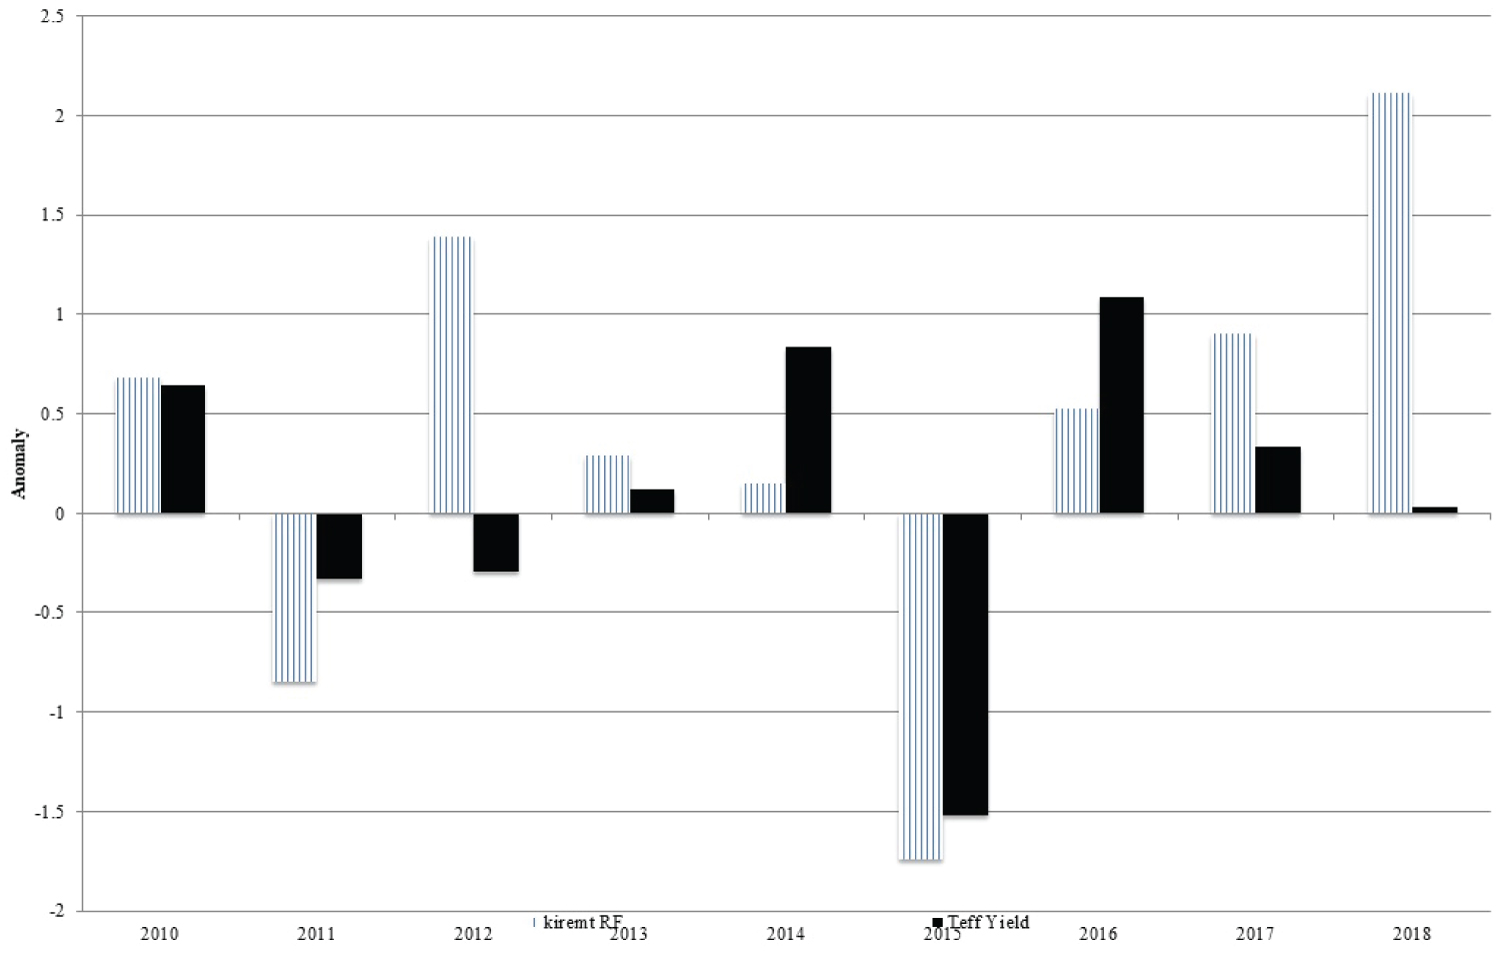
Figure 7: Teff yield and kiremt rainfall departure...
Teff yield and kiremt rainfall departure from long term mean in the Gubalafto area.
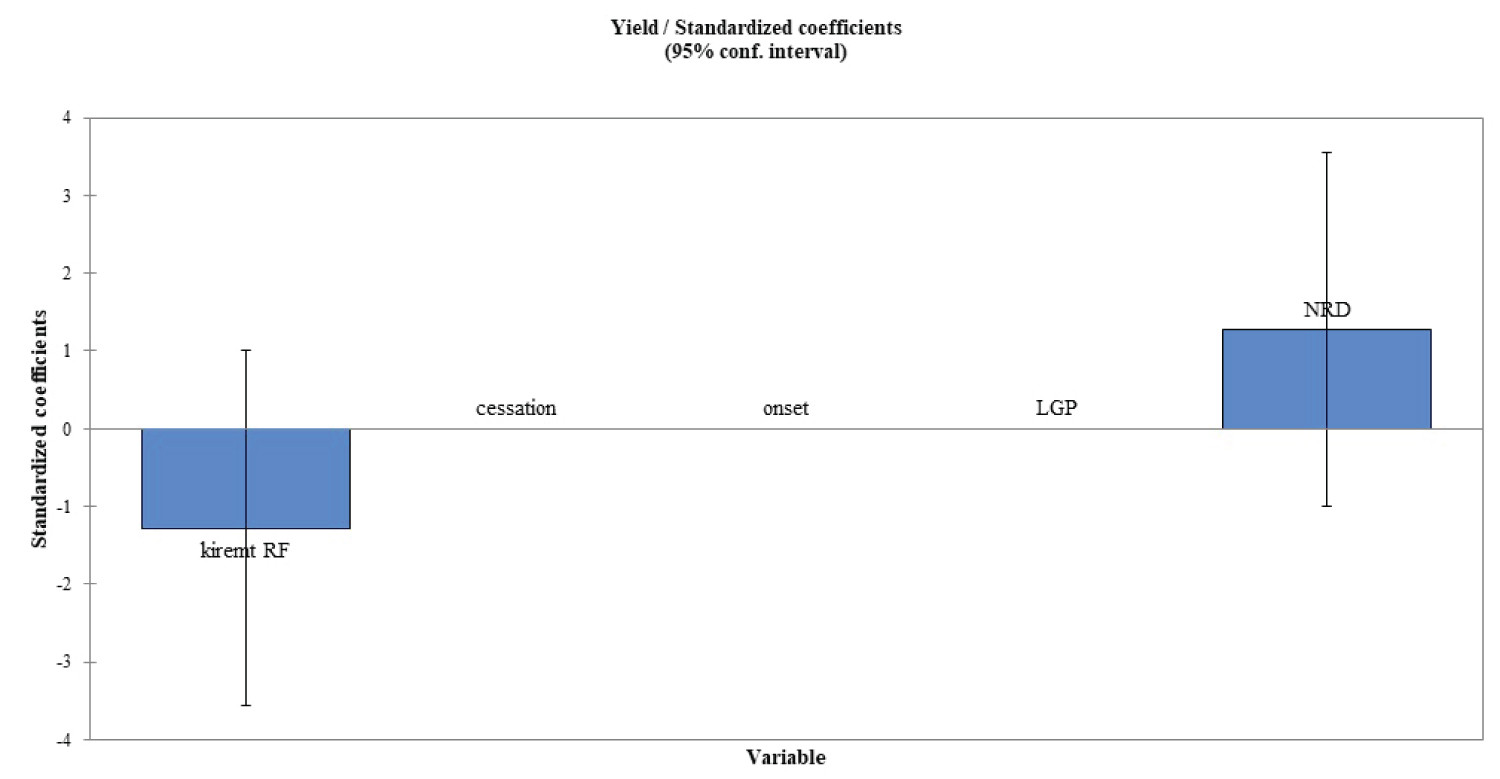
Figure 8: The correlation between rainfall characteristics...
The correlation between rainfall characteristics and teff yield over the study area.

Figure 9: Farmers perception on amount and distribution ...
Farmers perception on amount and distribution of kiremt and belg season rainfall variability and trends.
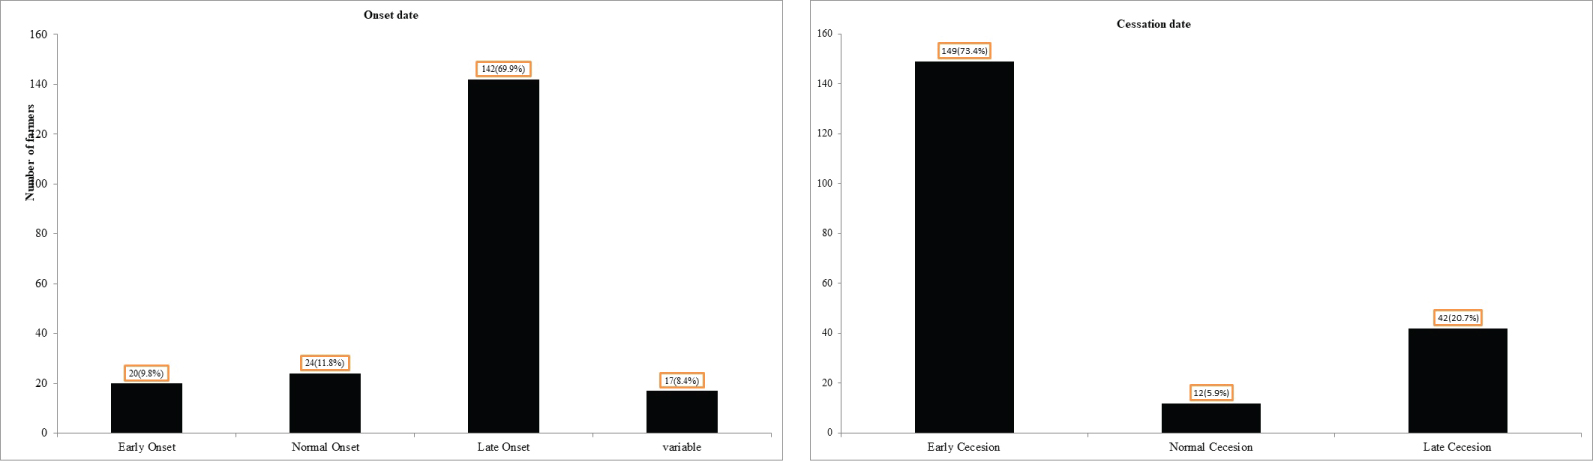
Figure 10: Farmers perception about onset and cessation...
Farmers perception about onset and cessation date variability and trends.
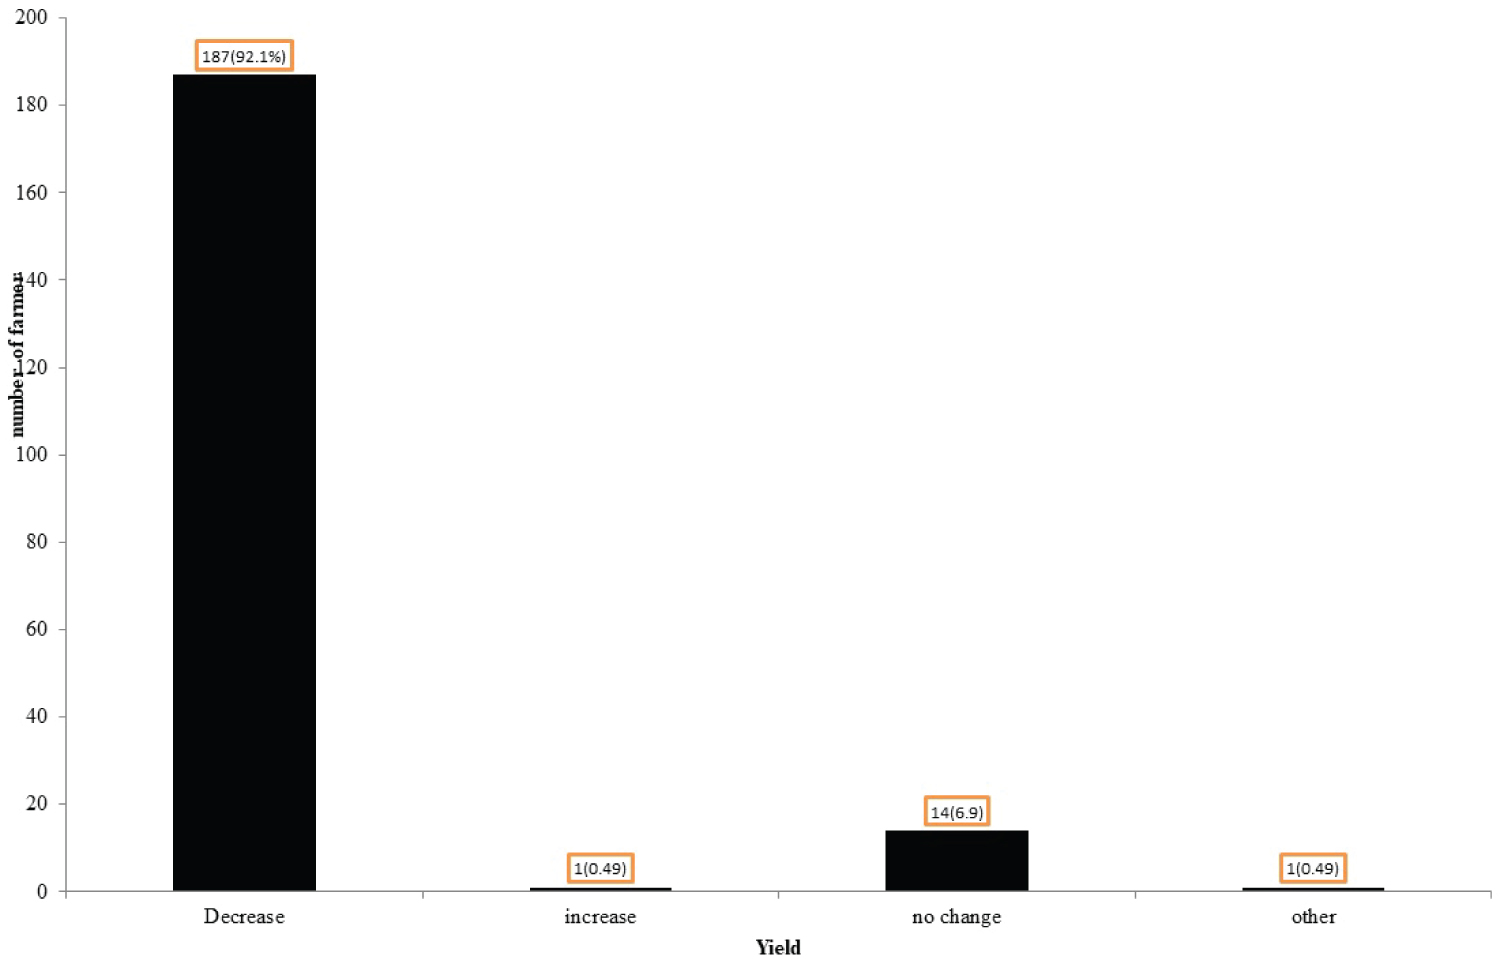
Figure 11: Farmers perception on the trend of...
Farmers perception on the trend of Teff yield in the study area.

Figure 12: The reduction of Teff yield in...
The reduction of Teff yield in the study area by farmers perception.
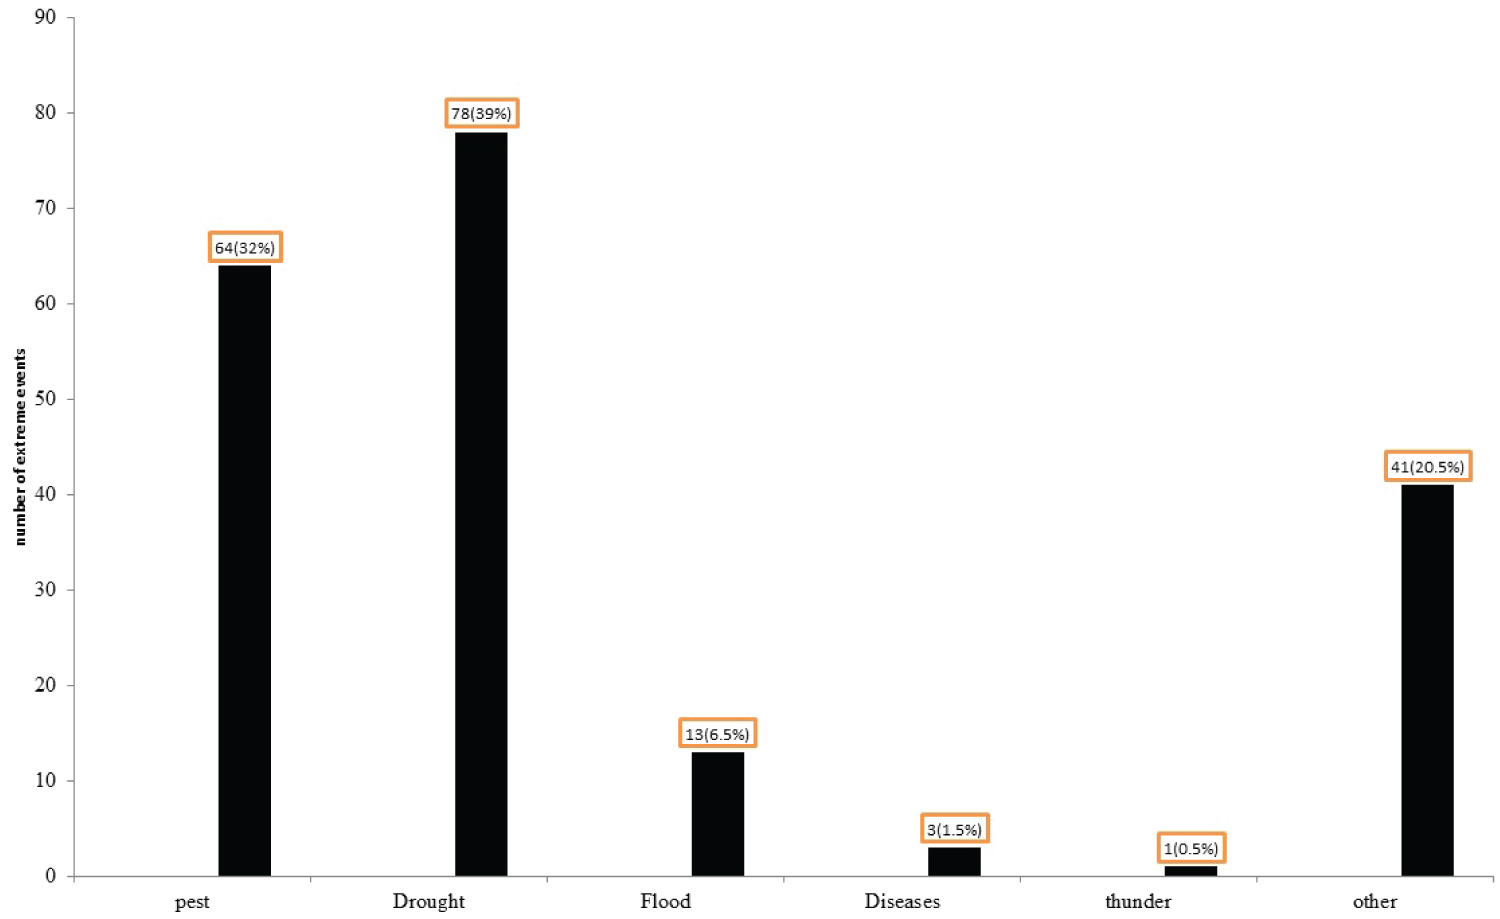
Figure 13: Local community perception on extreme....
Local community perception on extreme climate event and natural risks.
Tables
Table 1: Geographical locations of six weather stations for the study area.
Table 2: Mean annual and seasonal rainfall (mm), coefficient of variation (CV%) and contribution of seasonal rainfall to the annual rainfall (CT%) for six meteorological stations.
Table 3: Descriptive statistics of the onset, cessation and length of the kiremt rainy season during 1984-2018.
Table 4: Trends of annual and seasonal (Belg and Kiremt) rainfall totals at six stations.
Table 5: Trends of onset date, cessation date and length of growing period during kiremt season at six stations for the period 1984-2018.
Table 6: Summary of statistics of yield (Qt/ha) of Teff yield in the study area (2010-2018).
Table 7: Trends of Teff yields in the study area for the period 2010-2018.
Table 8: The Correlation between rainfall characteristics and Teff production.
Table 9: Analysis of variance (ANOVA) of Teff yields with rainfall characteristics.
Table 10: Summary of demographic characteristics of the respondents in the study area.
References
- Kisaka MO, Ngetich FK, Mugwe JN, Mugendi D, Mairura F, et al. (2014) Rainfall variability, drought characterization, and efficacy of rainfall data reconstruction: Case of Eastern Kenya. Advances in Meteorology 2015: 16.
- Deepak KR, James SG, Graham KM, Paul CW (2015) Climate variation explains a third of global crop yield variability. Nature Communications 6.
- Viste E, Korecha D, Sorteberg A (2013) Recent drought and precipitation tendencies in Ethiopia. Theoretical and Applied Climatology 112: 535-551.
- Conway D, Lisa E, Schipper F (2011) Adaptation to climate change in Africa: Challenges and opportunities identified from Ethiopia. Global Environ Change 21: 227-237.
- Hammouri N, Al-qinna M, Salahat M, Adamowski J, Prasher SO (2015) Community based adaptation options for climate change impacts on water resources: The case of Jordan. Journal of Water and Land Development 26: 3-17.
- Godswill M, Dawit K, Dejene A (2007) A comparative analysis of rainfed and irrigated agricultural production in Ethiopia. Irrigation and Drainage Systems 21: 35-44.
- Bewket Weldeamlak (2009) Rainfall variability and crop production in Ethiopia; Case study in the Amhara region. In: Proceeding of the 16th International Conference of Ethiopian Studies, Addis Ababa, Ethiopia.
- Ayalew D, Tesfaye K, Mamo G, Yitaferu B, Bayu W (2012) Variability of rainfall and its current trend in Amhara region, Ethiopia. Journal of African Agricultural Research 7: 1475-1486.
- Hadgu Gebre, Tesfaye Kindie, Mamo Girma, Kassa Belay (2013) Trend and variability of rainfall in Tigray, Northern Ethiopia: Analysis of meteorological data and farmers' perception. Academically Journal Environmental Science 1: 88-100.
- Hadgu Gebre, Tesfaye Kindie, Mamo Girma (2014) Analysis of climate change in Northern Ethiopia: Implications for agricultural production. Theoretical and Applied Climatology 121: 733-747.
- Mandal KG, Kumar A, Ghosh S, Kundu DK, Panda RK, et al. (2013) Analysis of rainfall and soil characteristics of Kuanria canal command for water resource management. Research Bulletin.
- Yemenu F, Chemeda D (2013) Dry and wet analysis of two rainy seasons for decision support in agricultural water management for crop production in central highlands of Ethiopia. Journal of Biological and Agricultural Health care 3: 1-6.
- Hagos F, Makombe G, Namara RE, Awulachew SB (2009) Importance of irrigated agriculture to the Ethiopian economy: Capturing the direct net benefits of irrigation. Int Water Manage Inst, Colombo, Sri Lanka.
- Central Statistical Agency (2015) Agricultural sample survey Report on area and production of major crops, Central statistical Agency of Ethiopia. Statistical Bulletin V.1 584, Addis Ababa, Ethiopia.
- North Wollo Zone Agriculture Office (2018) Meher season pre-yield assessment report (Amharic Version). Woldia, Ethiopia.
- Central Statistical Agency of Ethiopia (2007) Population and housing census of Ethiopia summery section.
- Reek T, Doty SR, Owen TW (1992) A deterministic approach to the validation of historical daily temperature and precipitation data from the cooperative network. Bulletin of the American Meteorological Society 73: 753-762.
- Abbas FA, Ahmed M, Safeeq A, Ali F, Saleem HM, et al. (2013) Analysis of a historical (1981-2010) temperature record of the Punjab Province of Pakistan. Earth Interact 17: 1-15.
- Tukey J (1977) Exploratory data analysis. Reading. MA: Addison-Wesley.
- Yamane T (1967) Statistics, an introductory analysis. (2nd edn), Harper and Row, New York.
- Alemu MM, Bawoke GT (2019) Analysis of spatial variability and temporal trends of rainfall in Amhara region, Ethiopia. Journal of Water and Climate Change 1-16.
- Gocic M, Shamshirbands, Razakz, Petkovic D, Chs, et al. (2016) Long-term precipitation analysis and estimation of precipitation concentration index using three support vector machine methods: Advances in meteorology 2016: 11.
- Nicholson S (1985) Sub-Saharan rainfall 1981-84. J Climate Appl Meteorolo 24: 1388-1391.
- Tung YK (1983) Point rainfall estimation for a mountainous region. J Hydraulic Engine 109: 1386-1393.
- Watson DF, Philip GM (1985) A refinement of inverse distance weighted interpolation. Geo-Processing 2: 315-327.
- Abebe M (2006) The onset, cessation and dry spells of the small rainy season (Belg) of Ethiopia. Meteorological Research and Studies Department, National Meteorological Agency, Addis Ababa, Ethiopia.
- Tesfaye K, Walker S (2004) Matching of crop and environment for optimal water use: The case of Ethiopia. Physics and Chemistry of the Earth, Parts A/B/C 29: 1061-1067.
- Stern R, Dennett M, Dale I (1982) Analyzing daily rainfall measurements to give agronomically useful results. I. Direct methods. Experimental Agriculture 18: 223-236.
- Mamo G (2005) Using Seasonal climate outlook to advice on sorghum production in the central rift valley of Ethiopia. PhD thesis, University of the Free State, Bloemfontein, South Africa.
- Sivakumar MVK (1988) Predicting rainy season potential from the onset of rains in Southern Sahelian and Sudanian climatic zones of West Africa. Agricultural and Forest Meteorology 42: 295-305.
- Mupangwa W, Maize I, Walker S, Africa S (2011) Start, end and dry spell of the growing season in semi539 arid southern Zimbabwe. Journal of Arid Environments 75: 1097-1104.
- Ati OF, Stigter CJ, Oladipo EO (2002) A comparison of methods to determine the onset of growing season in Northern Nigeria. J Climatol 22: 731-742.
- Mugalavai EM, Kipkorir EC, Raes D, Rao MS (2008) Analysis of rainfall onset, cessation and length of 533 growing season for western Kenya. Agricultural and Forest Meteorology 148: 1123-1135.
- RD Stern, PJM Cooper (2011) Assessing climate risk and climate change using rainfall data acase study from Zambia. Journal of Experimental Agriculture 47: 241-266.
- Pohlert T (2020) Non-parametric trend tests and change-point detection. 1-18.
- Partal T, Kahya E (2006) Trend analysis in Turkish precipitation data. Hydrological Process 20: 2011-2026.
- Yenigun K (2008) Trends in streamflow of the Euphrates basin, Turkey. Water Management. 161: 189-198.
- Sen P (1968) Estimates of regression coefficients based on Kendall‘s Tau. Journal of the American Statistical Association 63: 1379-1389.
- Lemi A (2005) Rainfall probability and agricultural yield in Ethiopia. Eastern Africa Social Science Review 21: 57-96.
- Rowhani P, Lobell DB, Linderman M, Ramankutty N (2011) Climate variability and crop production in Tanzania. Agricultural and Forest Meteorology 151: 449-460.
- Akinseye F (2013) Assessing the impacts of climate variability on crop yield over Sudano-Sahelian zone in Nigeria. Int J Agric Sci 1: 91-98.
- Bewket, Conway (2007) A note on the temporal and spatial variability of rainfall in the drought-prone Amhara region of Ethiopia. International Journal of Climatology 27: 1467-1477.
- Hare F (1983) Climate and desertification: A revised analysis. World Meteorological Organization (WMO), Geneva, Switzerland, 5-20.
- Agnew CT, A Chappel (1999) Drought in the Sahel. GeoJournal 48: 299-311.
- Bokretsion K (1999) Climate Change and Forecast in Ethiopia. In: Amharic. Paper Presented at a meeting organized by the DPPC on Climate Change, Drought and Disaster Prevention in Ethiopia, Addis Ababa, Ethiopia.
- Abegaz WB, Abera EA (2020) Temperature and rainfall trends in north eastern Ethiopia. J Climatol Weather Forecast 8: 1-6.
- Sivakumar M (1991) Empirical analysis of dry spells for agricultural applications in West Africa. Journal of Climate 5: 532-539.
- Taley SM, Dalvi VB (1991) Dry spell analysis for studying the sustainability of rainfed agriculture in India. The case study of the Vidarbha region of Maharashtra state Large Farm Development.
- Belachew A (2002) Dry-spell analysis for studying the sustainability of rain-fed agriculture in Ethiopia: The case of Arbaminch Area. International Commission on Irrigation and Drainage, Institute for the semi-Arid Tropics.
- Mohammed Y, Yimer F, Tadesse M, Tesfaye K (2018) Variability and trends of rainfall extreme events in north east highlands of Ethiopia. Int J Hydro 2: 594-605.
- Abiy Gebremichael, Shoeb Quraishi, Girma Mamo (2014) Analysis of seasonal rainfall variability for agricultural water resource management in Southern region, Ethiopia. Journal of Natural Sciences Research 4.
- Wagaye BA, Antensay M (2020) Rainfall variability and trends over central Ethiopia. Int J Environ Sci Nat Res 24.
- Muluneh Getaneh Tegegn (2015) Analysis of past and future intra-seasonal rainfall variability and its implications for crop production in the North Eastern Amhara Region, MSc. Thesis, Haramaya University, Haramaya, Ethiopia.
- Tuffa A, Mekonen A, Gebre egziabher Z, Seyoum A (2012) Climate convention and Africa/Ethiopia. Ethiopian Development Research Institute.
Author Details
Wagaye Bahiru*, Endalamaw Wende, Lubaba Mohammed, Yimer Mohammed, Hassen Adem and Yilma Demmisie
East Amhara Meteorological Service Center, Kombolcha, Ethiopia
Corresponding author
Wagaye Bahiru, East Amhara Meteorological Service Center, Kombolcha, P.O. Box 94, Ethiopia, Tel: +251905117215; +251335510378.
Accepted: December 29, 2020 | Published Online: December 31, 2020
Citation: Bahiru W, Wende E, Mohammed L, Mohammed Y, Adem H, et al. (2020) Assessing the Impact of Rainfall Variability on Teff Production and Farmers Perception at Gubalafto District, North Eastern, Ethiopia. Int J Earth Sci Geophys 6:042.
Copyright: © 2020 Bahiru W, et al This is an open-access article distributed under the terms of the Creative Commons Attribution License, which permits unrestricted use, distribution, and reproduction in any medium, provided the original author and source are credited.
Abstract
Rainfall variability adversely impacts crop production and imposes a major constraint on farming planning, mostly under rain fed conditions across developing countries. Rainfall variability from season to season greatly affects soil water availability to crops, and thus poses crop production risks to agriculture which is a major economic activity in Gubalafto District, Ethiopia. It was observed that farmers tend to rely on their accumulated experience about weather conditions in the schedule of their farm operations. Therefore, this study was designed to examine the impact of rainfall variability on teff production and farmers perception in Gubalafto district, Ethiopia. The Primary data were obtained through questionnaire administration and field observations among the farmers in Gubalafto district. Stratified random sampling technique was employed in the selection of sample size and a total of 203 farmers were randomly selected for the study. The secondary data was obtained from National Meteorological Agency of Ethiopia (daily rainfall between 1984 and 2018) and Teff yield was collected from North Wollo Agricultural Office (2010-2018). Coefficient of variation, standardized anomaly index (SAI), precipitation concentration index (PCI) were used to evaluate rainfall and Teff yield variability. Sen's slope estimator and Mann-Kendall's test were used to determine the magnitude and trends of changes, respectively. The analysis revealed that rainfall in the district is highly variable both in space and time for the last years. The coefficient of variation showed that seasonal rainfall distribution is highly variable than annual time scale. The rainfall trends showed decreasing non-significantly in both belg and bega season while increasing non - significantly in both annual and kiremt time scale over the study area. Significant correlations exist between amount of rainfall and Teff production. Hence small changes in amount and distribution of seasonal rainfall causes significant negative impacts on Teff production that varies from reduced yield to the total loss of the crop. The result of the regression analysis shows rainfall characteristics contributed 86% in explaining the variations in the yield of Teff per hectare in the study area. Both farmers' perceptions and meteorological data show that rainfall is much more unreliable in the study area. Most farmers reported that Teff yield is a decreasing pattern over time due to shortage of rainfall, frequent irregularity of rainfall and other factors. Therefore, specific adaptation strategies are needed for the study area to cope with the risks, sustain farming and improve food security.
Keywords
Rainfall variability, Teff production, Local community perception, Gubalafto district
Introduction
Climate change and variability are perceived as being the greatest threats to agricultural production and food security in sub-Saharan African countries, particularly for regions that depend on rain-fed agriculture [1]. According to Deepak, et al. [2] averaged globally over Africa, find that 32-39% of the maize, rice, wheat and soybean year-to year yield variability was explained by rainfall variability. Ethiopia, like other countries in the region, is highly exposed to climate change and variability and has experienced several food crises during the last decade [3].
Rainfall is the most important climatic element for rain-fed agriculture and the general socio-economic development of Ethiopia [4]. The spatial and temporal distribution of rainfall is important in hydrology, water resource management, agriculture, as well as policy making and planning with regards to climate change [5]. The uneven distribution of rainfall may result in a mismatch between water availability and demand in which case irrigation structures are required to redistribute water in accordance with the requirements of a specific region.
Studies in Ethiopia have shown that the causes for rainfall variability are erratic nature of rainfall; distribution; late onset and early offset contribute to decline in crop yields with reasonable amount in almost all parts of the country [6]. Similarly, Bewket [7] stated that rainfall variability has historically been found as a major cause of food insecurity in Ethiopia. Crop yield varies from season to season owing to variation in rainfall during the growing seasons [7-9]. The main weather parameter affecting crop growths are rainfall [10]. Having knowledge on sequences of rainfall variability, events can assist acquiring specific information for agricultural planning [11]. Within variable seasonal rainfall patterns, understanding the events of the occurrence of rain features like; onset and end date of rainy season, dry spells are crucial to decrease the adverse effects and exploit opportunities [12]. According to [9] the study of inter seasonal rainfall variability in terms of onset, end date and length of rainy season, number of rainy days, length of dry spell within the growing period and its trend is important for agricultural purposes in the dry land area than annual and seasonal totals.
Other study examined the impact of rainfall variability on the Ethiopia economy, and found that rainfall variability in the country led to a production deficit of 20% and increase in poverty rates by 25% which coasted by the economy over one-third of its growth potential [13].
In Ethiopia, teff is the first in terms of area coverage produced by 6.6 million holders and its production is 44.7 million quintals from 2.9 million hectares of land. Teff yield gives the national average grain yield of 15.4 qt/ha [14]. In Guba-lafto district, teff is the first produced production covers 4,345.5 hectares and produce 69,790.3 quintals [15]. The main objective of the study was to investigate the impact of rainfall variability on teff production and local community perceptions in the Gubalafto districts, Ethiopia. Therefore, investigation of rainfall pattern and possible trends as functions of spatial and temporal scale over the study area is necessary and also helps in deriving mitigation measures and evaluating ecosystem resilience towards such variability.
Materials and Methods
Description of the study area
The study was conducted in Gubalafto District, North Eastern, Ethiopia (see Figure 1). It is located in between 11.57°-11.99° N latitude, and 39.2°-39.8° E longitudes with an area of about 900.49 km2. It is bordered on the south by the DebubWollo Zone, on the west by Delanta and Wadla, on the northwest by Meket, on the north by Gidan, on the northeast by Kobo, on the East by Afar region and on the southeast by Habru District.
The topography of the District is mostly characterized by a chain of mountains, hills and valleys ranging from 1379-3809 meter above sea level. It is also characterized by 20% flat, 30% undulating, 35% mountainous and 15% valleys. Based on the national Census Conducted by the Central Statistical Agency of Ethiopia [16] Gubalafto district has a total population of 139,825 out of which 70,750 are men and 69,075 are women.
Gubalafto district has three agro ecological zones, lowland that ranges from 1500 m-1800 m, mid-altitude ranges from 1900 m-2200 m and highland ranges 2300 m-3300 meter above sea level district agricultural office (2012). Agro ecological distribution of the study area accounts 17% of lowland, 37% of highland and 46% of land. The District has bimodal rainfall pattern. Kiremt which extends from June to September is the main rainy season with its peak in July and August and the short rainy season Belg occur between February to May. Bega season is the dry season and covers the period from October to January. The study area is highly prone to frequent shortage of rainfall and receives an annual rainfall ranging between 300-400 mm on average. Teff (Ergo teff) is a cool weather crops cultivated at an altitude of 1800m to 2200 meters. Teff, indigenous to Ethiopia, forms the staple diet of many Ethiopians and it furnishes the flour to make injera, an unleavened bread that is consumed in the highlands and in urban centers throughout the country including Gubalafto district (Table 1).
Data sources and method of analysis
Sources of data: Both primary and secondary data were used in this study. The primary data include information sourced from administration of structured interview to the rural farmers in the study area while the secondary data (Rainfall and crop yield) were also collected. Observed daily rainfall data was obtained from the National Meteorological Agency of Ethiopia (NMA) for the period 1984-2018 and Teff yield was collected from North Wollo Agricultural Office (2010-2018). The Wheat yield data for the study area covers for the period 2010-2018 due to lack of available crop yield data only 9 years data were collected for analysis. The production data is generated from a sample survey of smallholder farmers with area cultivation in hectares and total production in Quintals (a Quintal is 100 kg).
Data quality check: Validity checks (quality control) were undertaken for the historical time series climate data prior to undertaking the analysis. In this study, errors due to data digitization and reporting and data internal inconsistency, which rainfall values less than zero (0 mm) [17] were evaluated and managed. On the other hand, outliers in a time series data were detected carefully to check that whether the values are really outliers or naturally extreme values [18]. Outliers were detected using the Turkey fence approach [19]. The rules of this approach are that inner fence are located at a distance 1.5 times interquartile range below the lower and above the upper quartiles and outer fences are located a distance 3 times the interquartile range below the lower and above the upper quartiles. Values outside the turkey fences are considered as outliers.
Sample size and sampling technique: Sampling technique was used to select the representative sample from the total population under the study and from the total household of the farmer's and kebeles administration of Gubalafto district. Dorogibir and Gubarji kebeles have been selected from the district using stratified random sampling technique; the 2 kebeles have been stratified into two agro climatic zones Dorogibr from the low land (Kola agro ecology) and Gubarjja from the weynadega (mid-altitude) agro ecology have been selected randomly. The villages provide an opportunity to study the impact of rainfall variability on Teff production because there is a frequent rainfall irregularity and post-harvest crop failure in Gubalafto district. The sampling of the population had been as follows that is 203 households from all kebeles. A sample size of 7% of the total households was sampled for the study. The sample size is determined by using the formula provided by [20] to determine the required sample size at 95% confidence level, and level of precision (5%).
Where "n" is the sample size, "N" is the population size (total household heads size), and "e" is the level of precision. To collect primary data from sampled households/farmers through structured questionnaire with closed and open-ended option questions.
Method of data analysis
Coefficient of variation (CV), Standardized Rainfall Anomaly (SRA) and Precipitation Concentration Index (PCI) were computed to see annual and seasonal rainfall variability over the observed periods.
Where, CV is coefficient of variation in percent, and are mean and standard deviation values. The degree of variability in rainfall is classified as less (CV < 20%) moderate (CV = 20% to 30%) and highly variable (CV > 30%) according to the estimated CV values [21].
The drought severity classes are extreme drought (SRA < -1.65), Severe drought (-1.28 > SRA > -1.65), moderate drought (-0.84 > SRA > -1.28), and no drought (SRA > -0.84).
When a PCI value is less than 10, indicated a uniformity of monthly rainfall distribution in a year, a PCI value from 11-15 indicates a moderate precipitation concentration and PCI from 16-20 indicates irregular distribution a monthly in a year. APCI value > 20 shows a strong irregularity in rainfall distribution. The PCI indicates the distribution of monthly rainfall and can be used as an indicator of hydrological hazard risks such as floods and droughts [22].
The areal average of rainfall and temperature for the study location is calculated using the below formula [23].
Where Rj is a real integrated rainfall/temperature for year j; Xijis rainfall/temperature at station i for year j and nj is the number of stations available for year j. Variability and trend in areal rainfall and temperature is also examined using the same methods. The spatial variability of rainfall and temperature for seasonal and annual time scale across stations has been analyzed and mapped using Inverse Distance Weighting (IDW) technique using QGIS software Tung [24] and Watson and Philip [25].
Moreover, the determination of start, end and length of the growing season, and the pattern of dry spells during the season is useful information for the planning of land preparation and planting activities. Onset date and Cessation date of the rainfall is so vital, particularly agricultural activities are highly dependent on rainfall i.e., the planting/sowing and harvesting dates are depends on the onset and cessation of the rain fall. The onset of rainy season was determined as the date when 20 mm or more rainfall accumulated over three consecutive rainy days after a starting date (1st of June for the Kiremt season and 1st of February for the Belg season) with no dry spell length greater than 7 days in the next 30 days as used in [26,27]. The end of the rainy season was defined as any day after 1st of September for Kiremt and 1st of May for Belg seasons when the soil water balance reaches zero [28]. Since the dominant soil for all locations studied is Vertisols with high clay content (> 50%), a 100 mm/meter of the plant available soil water and site-specific daily reference evapotranspiration (Eto) values were considered. Length of Kiremt and Belg growing season was determined as the difference between the end and onset of rainy season [10,26,29].
A delay in the onset of rains causes a short growing season and an early onset leads to a longer growing season [30,31]. Yield may be significantly affected by late onset or early cessation of the season as well as damaging dry spells during the season [32,33].
The information on the length of dry spells could be used for deciding a particular crop or variety, supplementary irrigation water demand and for others agricultural activities. The different classes of dry-spell length are defined depending their duration 5 days (short length), 7 days (medium length), 10 days (long duration) and 15 days (extreme length). Dry spell length is the maximum number of consecutive dry days with rainfall less than 1 mm per day exceeding 5, 7, 10, and 15 [27]. Dry spell length was analyzed by Markov Chain analysis Stern & cooper [34] and using INSTATv3.37 software. The longer dry spells pose greater adverse impacts for crops whereas the intensity of the impact depending on the sensitivity of crop types and varieties to water deficit, at any of their critical growth stages', whereas the shorter dry spells may not exert significant adverse impact for most.
Trend analysis
To detect the trend and magnitude of rainfall and temperature patterns in a time series, Mann-Kendall's trend test and Sen's slope estimation method were employed. According to Pohlert [35], Mann-Kendall's test is a common method employed to detect monotonic trends in series of environmental, climate and/or hydrological data. Mann-Kendall's method is less sensitive to outliers in a time series without considering whether the trend is linear or nonlinear [36,37].
Where xj and xi are the sequential precipitation or temperature values in months j and i (j > i) and N is the length of the time series. A positive S value indicates an increasing trend and a negative value indicates a decreasing trend in a time series. Variance of S, for the situation where there may be ties (i.e., equal values) in the x values, is given by
Where, m is the number of tied groups in the data set and ti is the number of data points in the ith tied group. For n larger than 10, the standard normal ZMK test statistic is computed as follows [36].
The presence of a statistically significant trend is evaluated using the ZMK value. In a two-sided test for trend, the null hypothesis Ho should be accepted if │ZMK│< Z1-α/2 at a given level of significance. Z1-α/2 is the critical value of ZMK from the standard normal table. E.g., for 5% significance level, the value of Z1-α/2 is 1.96.
Sen's slope estimator test: The magnitude of trend is predicted by the Sen's estimator. The slope (Ti) of all data pair computed as [38]. This test is applied in cases where the trend is assumed to be linear, depicting the Quantification of changes per unit time.
Where Xj and Xk are considered as data values of time j and k (j > k) correspondingly. The median of these N values of Ti is represented as Sen's estimator of slope which is given as
Positive value of Qi indicates an upward or increasing trend and a negative value indicates downward or decreasing trend in the time series.
To summarize the daily rainfall data, Instat + v3.7, GenStat and XLSTAT software packages were used. QGIS was also come into action to interpolate and map seasonal and annual rainfall distribution of the study region using inverse distance weighting interpolation approach.
Correlation and regressions techniques are important in showing the relationship between rainfall parameter and crop production, and to identify the most predictor variable. Lemi [39]; Bewket [7]; Rowhani, et al. [40], and Akinseye, et al. [41] used the same methodology in their study of the relationship between climate variables and crop production. The Pearson correlation coefficient (r) was analyzing to evaluate the linear relationship between rainfall and the crop yields (Teff). Pearson's correlation coefficient (r) which was calculated by in the below equation:
Where is Pearson's correlation coefficient, y is the observed yield, x is rainfall characteristics and n is number of observation.
Regression analysis is a form of predictive modeling technique which investigates the relationship between a dependent (target) and independent variable (predictor). Multiple regression analysis was used to determine the contribution of the rainfall characteristics to crop yield. The analysis described the effects of the independent variables jointly on the yields of the crops. Regression model for the study was also computed as:
Y = a + b1x1 + b2x2 + b3x3 + b4x4 + bnxn + e…………………………. (12)
Where; Y = the value of the dependent variable (Teff yield/ha);
a = Y intercept b1, b2, b3, b4, ••• bn = regression coefficients (each b represents the amount of change in Y (Teff yield/ha) for one unit of change in the corresponding x-value when the other x values are held constant; x1, x2, x3, x4, ••• xn = the independent variables (i.e. rainfall onset, cessation, duration, Kiremt total rainfall and number of rain days respectively); and e = the error of estimate or residuals of the regression.
Result and Discussions
Rainfall variability and trends
The mean annual and seasonal rainfall variability at the 6 stations is presented in Table 2.
The study area is characterized by bimodal rainfall pattern and much of the rainfall is concentrated in the kiremt season (June-September). On other hand small rains during belg season which begin from February and extends to May. The area receives a mean annual rainfall ranging from 566.3 mm at Hara to 876.4 mm at Sirinka station with areal mean annual rainfall of 703.3 mm. The variability of annual rainfall was lowest at Sirinka (CV = 19.9%) and highest at Hara (CV = 35.8%). This implies that the annual rainfall was more unreliable and unpredictable at Hara areas due to erratic and uneven distribution of rainfall.
At the seasonal level, the mean kiremt total rainfall varies from 402.9 mm at Hara to 596.2 mm at Gobye areas with areal mean rainfall of 489.2 mm. The contribution of kiremt rainfall to the average annual rainfall across station is also very high, it ranges from 61.1% at Sirinka to 83.3% at Delib areas (Table 2). This is supported by [8,42]. During Belg season, Sirinka received the highest rainfall amount of 241.9 mm while Delib received the lowest rainfall amount of 92.9 mm with areal mean rainfall of 154.5 mm. It also contributes a considerable amount (15.6%-27.6%) for the annual total rainfall at Delib and Sirinka stations respectively. In line with this in the Amhara regional state of Ethiopia belg rainfall had contributed 8 to 24% to the annual rainfall totals [8,42]. The result also indicated that Belg rainfall variability for all stations were extremely high variable (CV > 40%). This implies that during Belg season the rainfall is highly variable according to the classifications given in Hare [43]. It is therefore, the study area has been vulnerable to drought during belg season (CV > 30%). Additionally, during Bega season (October-January) the mean total rainfall was ranging from 12.5 mm at Woldia to 75.7 mm at Gobye for the last 35 years. Its contribution to the annual rainfall is less which varies from 1.7% at Woldia to 9% at Gobye areas. The coefficient of variation of rainfall also shows extremely variable (CV = 50%) in all stations. Likewise, the mean monthly rainfall of the stations in the Gubalafto district varied from 9.7 to 221.4 mm (see Figure 2). Comparatively the monthly rainfall was low from October to February but started to increase in June. Moreover, relatively intensive rainfall was received between June and August. The minimum monthly rainfall was recorded at Delib in January while that of maximum monthly rainfall was recorded at Gobye in Agust. Generally, rainfall in Gubalafto district showed moderate inter-annual variability as shown by the coefficients of variations (Table 2). The seasonal rainfall was highly variable than the annual rainfall amount. Also, both Belg and Bega rainfalls are found much more variable than the Kiremt rainfall in which their coefficient of variations are greater than 30%. A similar conclusion that Belg and Bega rainfalls are more variable than Kiremt rainfall was arrived at by Bewket and Conway [42].
Annual and seasonal rainfall anomaly: The standardized rainfall anomalies (SRA) were also calculated to assess the inter-annual rainfall fluctuations at the study area. The rainfall in the Gubalafto district was characterized by sporadic fluctuation of wet and dry years in a periodic pattern (Figure 3). The result of the standardized rainfall anomaly on the annual basis showed 42.8% dry tendency dominates while 57.1% dominates wet tendency over the study area. Likewise, the standardized anomalies of kiremt rainfall revealed that 48.6% weak to strong negative departure from the long term mean rainfall and 51.4% recorded above the long-term average rainfall. According to drought assessment method by Agnew and Chappel [44], there have been seven driest years in the Gubalafto, with varying severity. During kiremt there were two extreme (1987 and 2015), one severe (1984) and four moderate (1989, 1992, 2004 and 2009) dry years. In contrast, years like 1994, 1998 and 2012 were experienced severe wet while that of 2018 was showing extremely wet and two moderate wet years were observed (1988 and 1999 in the district over the period of record.
The onset, cessation date and length of growing period: Agricultural productivity heavily depends on onset and cessation of rainfall and Length of Growing Period (LGP). Determining these variables are useful for early warning and preparedness. However, in Ethiopia, an onset and cessation of seasonal rainfall vary considerably within few kilometers distance due to altitudinal variations, orientation of mountain chains and their physical influence on atmospheric flow [45].
The mean onset date was varied from 2nd week of July (184.4 DOY) at Gobye to July 11th (193.8 DOY) at Woldia areas with areal mean onset date is July 7th (189.7 DOY) see Table 3. In a study conducted in northern Ethiopia, Hadigu, et al. [9] found the onset date of Kiremt growing areas to be between the 1st and 3rd week of July.
The observed variability of Kiremt onset was varied from 7.2% at Sirinka to 15% at Woldia areas. This shows that the onset date of Kiremt growing season have been experienced dependable patterns across Sirinka while at Woldia the patterns couldn't be easily understood and consequently decisions pertaining to crop planting and related activities should be taken with great care. The mean cessation date also ranged from September 21st (265 DOY) at Hara to September 29th (273.4 DOY) at Gobye areas with areal mean cessation date is September 25th (269.9 DOY). This study is supported by Abegaz WB, et al. [46]. Therefore, the end of the season is extended more at Gobye compared to other areas. The Coefficient of Variation of cessation of the main rainy season (Kiremt) over the study area is less variable which is 4.9% shown in (Table 3). The average value of length of growing period during main rainy season over Gubalafto district was 78 days cited in Table 3. The length of growing period has variability with values ranging from 72.6 days at Hara to 126 days at Gobye areas. Likewise, the coefficient of variation of length of growing period ranging from 22.3% to 28.3% at Sirinka and Hara areas respectively. Higher coefficients of variation in LGP, gives less confidence in crop selection based on maturity period.
The number of rainy days and probability of dry spell lengths: For Kiremt season, the number of rainy days observed in the given duration varied from 48.2 days at Sirinka to 53.7 days at Delib with areal mean of 51.2 days. The inter annual variability of number of rainy days varied from 21.9% at Sirinka to 36.4% at Hara areas (See Table 3). This result is supported by Hadigu, et al. [9].
The probability of dry spell occurrence for Belg (DOY = 32- 152) and Kiremt (DOY = 153-274) seasons for six selected stations is shown in Figure 4; dry spell lengths of 5,7,10, and 15 days were considered. Dry spell length is the maximum number of consecutive dry days with rainfall less than 1 mm per day exceeding 5, 7, 10, and 15 [27].
The information on the length of dry spells could be used for deciding a particular crop or variety, in a given location and for breeding varieties of various maturity durations [47]. Similarly, information on dry-spell lengths could be used in decision making with respect to supplementary irrigation and field operations in agriculture [48]. Rainfall being a prime input and requirement for plant life in rain-fed agriculture, the occurrence of dry-spells has particular relevance to rain-fed agricultural productivity [49]. Prolonged dry-spells during cropping seasons directly impact the performance of crop production. As indicated in the Figure 4, the probability of dry spell occurrence during belg and kiremt seasons is different among stations. Observations of climatic data illustrate that the probability of dry spells occurring within the growing seasons varies from month to month. To consider the intensity of dry-spells, we further assessed the probability that dry spells will exceed specific numbers of consecutive days. Moreover, the probability of the occurrence of dry spells of 5, 7, 10, and 15 days were above 60% in all areas during the small (belg) rainy season. The probability of 7, 10, and 15 days dry spell occurrence starting from end of June until the peak rainy period (July and August) becomes zero at all areas where as the probability of 5 day dry spells occurrence were more than 30% at all stations during the main rainy season. The probabilities of 5, 7 days dry spell occurrence rapidly increases after the first decade of September (245 days of the year) while 10 and 15 days dry spells were gradually increase from the first decade of September to end of September.
Generally, the shorter dry spell events have higher probability of occurrence, compared to the longer ones in general. The Belg (FMAM) season has higher probability of dry spells than the Kiremt (JJAS) and is liable to meteorological drought. The challenges of risk of dry spell were more at Hara, Delib, Gobye, and Sanka areas as compared to other areas. Hence crop production during this particular period needs a due attention and monitoring of planted crops. This implies that the risk of planting long cycle before June is above 65%.
The number of very heavy rainfall and simple daily rainfall intensity: Very heavy rainfall days are count of days where rainfall ≥ 20 mm while simple daily rainfall intensity is mean rainfall amount in wet days [50].
The average number of days with very heavy rainfall per year varies from 1.7 days at Hara to 8.5 days at Gobye with areal mean very heavy rainfall 4.8 days. The coefficient of variation revealed that extremely variable in the number of very heavy rainfall at all stations.
On the other hand the simple daily intensity of rainfall on average per rainy day ranged from 8.2 mm per day at Hara to 11.4 mm per day at Gobye for the last 35 years. The coefficient of variation also showed that moderate fluctuations of intensity of rainfall at Sirinka, Woldia and Gobye stations while at Sanka, Hara and Delib extremely variation of rainfall intensity in the study area (See Table 3). Excessive rains are generally associated with crops loss due to floods that wash away the crops or make them rot in the gardens. Moreover, too much rain affects post-harvest handling of the crops and can result into substantial post-harvest losses. Besides, in the early stages of crop production, excessive rains can lead to erosion of topsoil's and leaching of soil nutrients, thereby affecting productivity. Other effects of excess rainfall on crop production include poor pollination, seed and fruits formation. In general, Heavy rainfall events leading to flooding can wipe out entire crops over wide areas, and excess water can also lead to other impacts including soil water logging, and reduced plant growth.
The spatial distribution of annual and seasonal rainfall: The spatial distributions of rainfall for annual and seasonal time scale are shown in Figure 5. From the Figure 5 it can be seen that the highest annual rainfall values were recorded (721-875 mm) in most parts of eastern gubalafto district and the lost values were recorded (566-643 mm) in pocket areas of north and eastern parts of the district. During kiremt season, the southern and western part of the study area received maximum rainfall while the northern and north eastern parts of the study area received low rainfall. Similarly, during Belg season, the highest rainfall was observed in the southern and eastern parts of the region while western and north western parts of study area received low rainfall.
Trends of annual and seasonal rainfall
Trends of annual and seasonal (Belg and Kiremt) rainfall totals presented in Table 4.
The Mann-Kendall trend test shows anon-significant increasing trends of annual rainfall at Sirinka, Sanka, Hara, Delib, and Woldia stations respectively. This is supported by Abiy Gebremichael, et al. [51] and annual rainfall showed an increasing trend at Indibir station in his study. Insignificant annual rainfall trends may be due to high inter-annual variability. On the contrary significant decreasing trend was observing in annual rainfall at Gobye by 10.5 mm per annual. This agrees with the results of the study by Wagaye BA, et al. [52]. On the other hand the kiremt seasonal rainfall showed increasing trend at all stations. However, the detected trends were statistically significant at Hara and Woldia stations only. This agrees with the result of the study by Abegaz WB, et al. [46]. The Belg rainfall also showed a non-significant decreasing trend at all stations but a non-significant increasing was observed at Hara station. Similarly, Ayalew, et al. [8] also found decreasing trend of belg rainfall was identified at kombolcha and Sirinka stations. Generally, the result showed that the areal annual and kiremt rainfall have been anon-significant increasing trends while the belg rainfall has been anon significant decreasing trends were observing in the Gubalafto district over the last periods.
Trends of onset, cessation and length of growing period: The Mann-kendall's trend test on starting of kiremt rainfall showed anon significant decreasing trend at Sirinka, Sanka, Woldia and Gobye stations respectively (See Table 5). In line with this Getaneh [53] reported that non- significant decreasing trend was observed at Lalibela station. The decreasing trend in onset date shows early starting of kiremt rainfall in the past 3 decades. On the contrary a non-significant increasing trend of the onset date was observing at Hara and Delib respectively. Similarly, the cessation date has been increasing at all stations except Gobye. However, the detected trends were significant at Hara, Sanka and Woldia stations. This agrees with study by Hadigu, et al. [9] reported that significantly increasing trends of cessation of kiremt season rainfall at Mekele and Adigudum stations in the Northern Ethiopia. The length of the growing period showed a non-significant decreasing trend at Gobye whereas at Sirinka, Sanka, Hara, Woldia and Delib have been increasing trends. However, the detected trends were significant at Sanka, Hara and Woldia stations.
Generally, the mann-kendal trend test showed that the onset date has been decreasing non-significantly by 1.4 days per decade while that of cessation date has been showing anon –significant increasing trend by 3 days per decade in the study area. Likewise, the length of growing period also increasing trends observed. However, the detected trend was non-significant.
Variations and trends in teff production
The highest Teff yield per hectare was 20.8 quintal per hectare in 2016 while the lowest yield of 8.6 quintal per hectare was recorded in 2015 at Gubalafto district (Figure 6). The mean yield was 16.2 quintal per hectare with moderate year to year variation in the study area for last years (Table 6).
Trends of teff production in the study area: Table 7 Showed the Man Kendall's trend test of Teff yield result over the study period (2010-2018) in Gubalafto district. The Man Kendall's trend test has been showing anon-significant decreasing trend of Teff yield by 0.23 quintal per hectare in the study area.
Relationship between rainfall characteristics and teff production: The correlation between rainfall characteristics and Teff production were computed and the result is presented in (Table 8).
The correlation between rainfall characteristics and teff yield shows that rainfall amount; number of rainy days, cessation date, and length of growing period shows strong positive correlations with Teff yield in the study area. This implies that the higher the amount of rainfall spread over the number of rain days with extended duration in a year, the higher the yield of Teff per hectare in the area.
Teff production anomalies and kiremt rainfall variability: Figure 7 shows anomalies of meher Teff production and kiremt rainfall variability at the district level. Teff production was below mean in the year 2011 and 2015 when kiremt rainfall was also below the mean for the same period. Above average Teff production was observed in 2010, 2013, 2014, 2016, 2017 and 2018 Kiremt rainfall was above average during those years. During the year 2012 the amount of rainfall was above the mean whereas below average teff production was observed (Figure 7).
Regression analysis of rainfall characteristics and teff yield: The results of linear regressions of precipitation on crop yields are presented in (Table 9). Linear regression analysis was carried out in order to determine the relationship between the rainfall variables and Teff yields.
The analysis described the effect rainfall characteristics (independent variable) jointly on the yields of the crops. Model summary of regression analysis showed that R2 for Teff yield was 86% in table below. This implies that climate alone explained these percentages of variation observed in the crop yield in the study area. Other factors such as farm management techniques and edaphic factors could be responsible for the remaining percentages. Among the rainfall characteristics amount of rainfall with increase in the number of wet days are the most important variable for the variation of Teff yield in the study area (Figure 8).
Equation of the regression model:
Yield = -3.36281-0.05697*kiremt RF + 0.72535*NRD (13)
Characteristics of respondents in the study area
From total 203 respondents included in the survey, 72% were male and the rest 28% were female. The majority of the farmers (83%) fall between the economic active ages (36-50 yrs). Around 66% of the respondents were 20-35 years old and about 54% were above 50 years old. Furthermore, marital statuses of respondents were 63% married, 31% single and 6% divorced from the sampled households. From the total respondents around 57% household heads respondents were illiterate with no formal education, 27% had primary education and 12% had secondary education and 7% had graduate with formal education (Table 10).
Perception of farmers on annual and seasonal rainfall variability and trends: Perception of farmers on trends and variability of seasonal and annual rainfall totals and its distribution is presented in Figure 9. The results showed that more than 81.2% of the farmers in the study area perceived a decreasing trend of kiremt and belg rainfall totals. On the contrary, 2.5% of the respondents reported that mean of kiremt and belg rainfall was increasing pattern over time in the study area. On the other hand, 4.4% and 8.9% of the farmers at gubalafto district perceived no change in the belg and kiremt rainfall in the last 20 years respectively. The result also 5.4% and 6.9% of the respondents reported that the amount of belg and kiremt rainfall respectively has been fluctuating over time in the study area.
Perception of farmers on trends of onset, cessation dates and the LGP: Farmers in the study area perceived that rainfall events such as onset date, cessation date and Length of Growing Period (LGP) have been changed (Figure 10). It has been indicated that 69.9% and 20.7% of the farmers at Gubalafto district had perceived late onset and late cessation of kiremt rainfall respectively and consequently, 100% believed decreased in LGP.
Moreover, about 9.8 and 73.4% of farmers at the study area had noticed decrease in frequency of onset and cessation date in kiremt rainfall, respectively while more than 63.6% perceived decrease in LGP.
Farmers' perception on teff production in the study area: Results showed that Teff is one of the significant crops cultivated in the study area because it is a staple food crop foremost farmer. However, 92.1% of the respondents reported that Teff yield is a decreasing pattern over time due to shortage of rainfall (46.5%), variability of rainfall distribution (31.5%) and variability of onset and cessation (13.4%) etc. On the other hand, 6.9% of the respondents reported no change of the crop over time (Figure 11 and Figure 12).
Perception of farmers on climate related hazards and other natural risks: The study results revealed decline in crop yield, increase in pest and disease; increased extreme climatic events such as drought, flood, thunder and other related events have devastating impacts on crop production in the Gubalafto district (Figure 13). Therefore, the results of 32% and 1.5% of respondents revealed that Teff yield was reduced by pest and diseases respectively in the study area. Likewise, almost 39%, 6.5%, 0.5% and 20.5% of the respondents confirmed that Teff yield is a decreasing trend over time due to severe drought, flood, thunder and other extreme climatic events respectively in the study area.
Conclusions
Ethiopia's agriculture is almost exclusively rain fed, so rainfall variability comprises an important source of uncertainty in agricultural production decisions. Information on seasonal Kiremt and seasonal Belg rainfall amount is important in the rain fed agriculture of Ethiopia since more than 85% of the population is dependent on agriculture particularly on rain fed farming practices [54]. But climate variations influences agricultural production and hence it affects crop productivity and land use pattern. This study investigated assessing the impact of rainfall variability and Farmers perception on Teff production. Case study in Gubalafto districts, North Eastern, Ethiopia.
The analysis on long term rainfall data for the study area showed large inter-annual and seasonal variation in the amount and distribution of rainfall. The rainfall trends showed decreasing in belg while increasing in both annual and kiremt. However, the detected trends are non-significant in the time series. Over the last periods trends of rainfall events such as onset date, cessation date and length of the growing period were changed non-significantly in the study area.
The variability of seasonal rainfall causes fluctuations in production of major crops. Due to high correlations between crop production and seasonal rainfall, small changes in amount and distribution of seasonal rainfall causes significant negative impacts on crop production that varies from reduced yield to the total loss of the crop. As result Teff production exhibits the largest year to year variations in the study area. This high inter-annual variability is caused by rainfall variability where in the rainfall components of amount of rain, number of rainy day, onset and cessation date and length of growing period often play the biggest role.
The result of the regression analysis shows rainfall characteristics contributed 86% in explaining the variations in the yield of Teff per hectare in the study area. Both farmers' perceptions and meteorological data show that rainfall is much more unreliable in the study area. Most farmers reported that Teff yield is a decreasing pattern over time due to shortage of rainfall, frequent irregularity of rainfall and other factors.
Recommended practices include water harvesting, supplementary irrigation, run-off management, conservation tillage and integration of more leguminous species into rotation systems. Improved soil surface management practices, small water harvesting systems and small irrigation systems have been shown to offer great potential for making maximum use of rainwater. In addition, such practices allow farmers to intensify their production activities and encourage increased diversity in production of high value crops.
Acknowledgments
The authors thank the National Meteorological Agency of Ethiopia (NMA) for providing all the data used for this study and this research was also well supported by National Meteorological Agency of Ethiopia.
Conflict of Interest
The authors declare no conflict of interest.